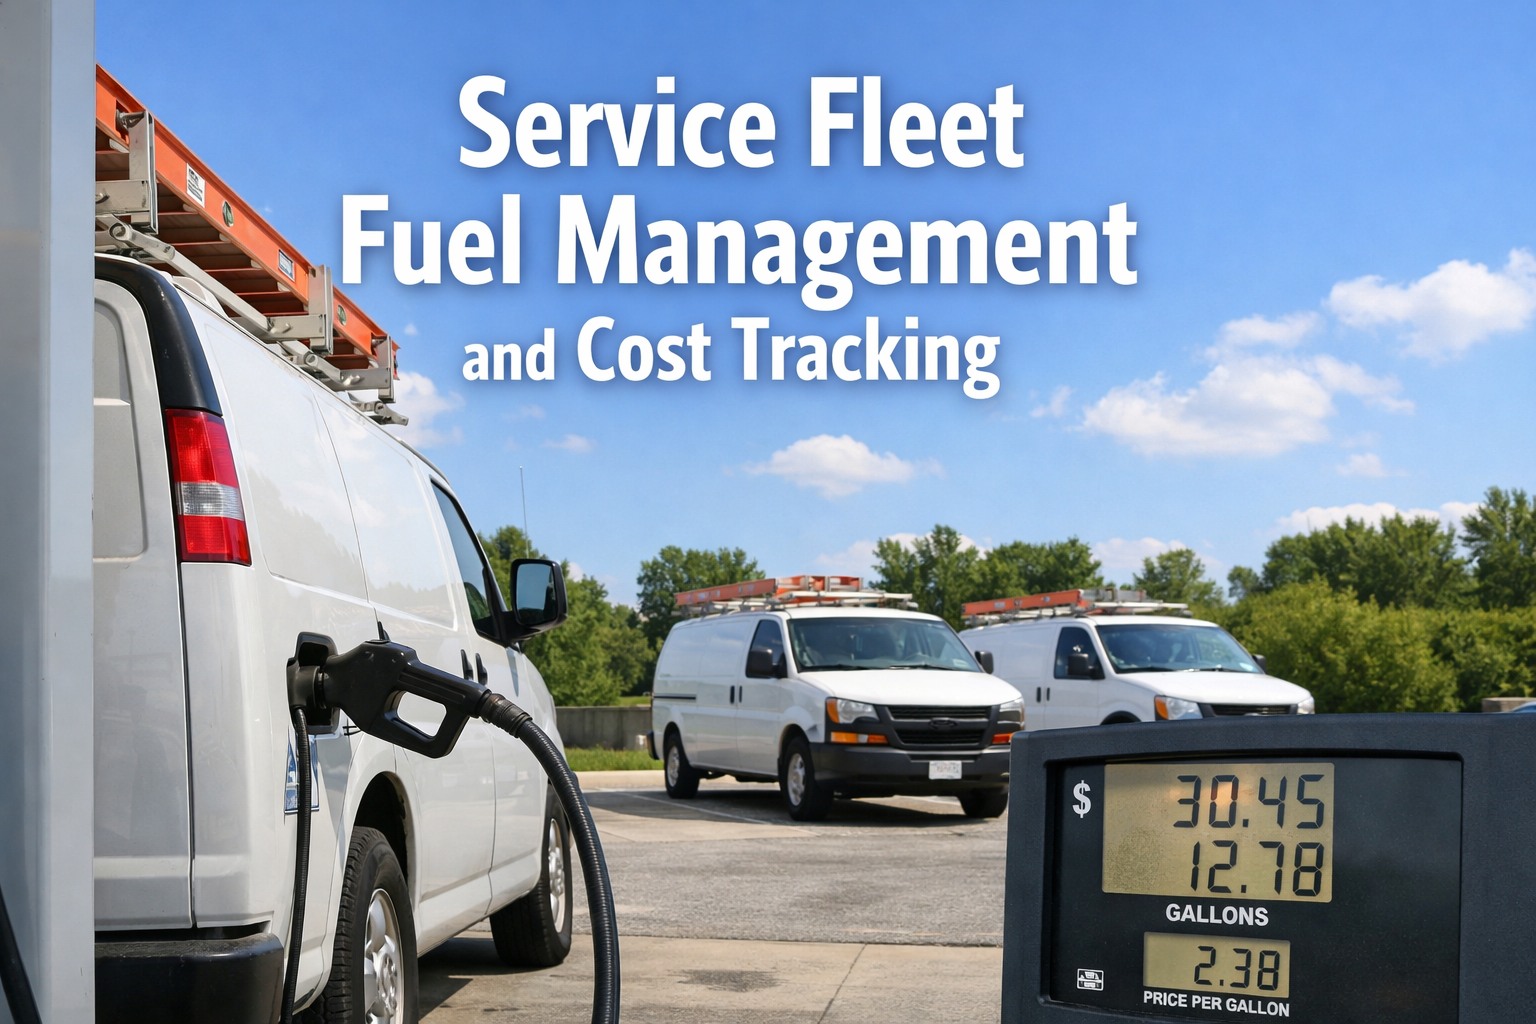
Fleet maintenance costs are rising — and they're rising faster than most service companies realize. Average maintenance and repair costs increased 11.3% year-over-year in 2024 and another 4.9% in Q1 2025, with average service cost reaching $105.87 per work order. Parts costs have jumped 15-25% since 2022, labor rates are climbing 8-15% annually, and aging vehicles in service longer are hitting the expensive end of their lifecycle. The total cost per mile to operate a single truck hit a record $2.27 in 2023 — a 33% increase from 2019. For HVAC, plumbing, electrical, and other service fleets running 10-50+ vehicles, uncontrolled maintenance costs can silently erode 20-30% of operating margins.
The difference between companies that control fleet costs and those that don't: data. Companies tracking maintenance spend per vehicle, cost per mile, and PM compliance achieve 20-30% lower total fleet costs while maintaining superior reliability. Unplanned repairs cost 3-9x more than scheduled maintenance. The benchmark for lean service fleets is $0.24/mile and $9,584 annual TCO per vehicle — but only 27.79% of fleets achieve 95-100% PM compliance. Oxmaint CMMS gives fleet managers the cost tracking, reporting, and analytics to hit these benchmarks. Schedule a demo.
Your Fleet Is a P&L Statement on Wheels.
Every truck either makes money or bleeds it. The data tells you which — if you're tracking it.
Cost per mile trend — peaked 2022, stabilizing toward benchmark
Where Your Fleet Maintenance Budget Goes
Understanding cost allocation is the first step to controlling it. Here's how a well-managed service fleet should distribute its maintenance budget, based on 2025 industry benchmarks:
The Cost Reports Every Fleet Manager Needs
Raw spending data is useless without context. These six reports transform maintenance records into actionable intelligence that identifies where money is being wasted and where strategic investment will pay off:
Cost Per Vehicle Ranking
Rank every vehicle by total maintenance spend (YTD and trailing 12 months). Flag units exceeding the $9,584 annual benchmark by 15% or more. These "money pit" vehicles need quarterly review — replace or continue? The vehicle at the top of this list is almost always your biggest cost-saving opportunity.
Cost Per Mile Trend
Track CPM monthly for each vehicle and fleet-wide. Industry benchmark: $0.24/mile for lean service fleets. Maintenance component: $0.06/mile target. Rising CPM on a specific vehicle signals aging-related cost escalation. Rising fleet-wide CPM signals systemic issues — PM compliance, parts pricing, or technician efficiency.
PM Compliance Rate
Percentage of preventive maintenance tasks completed on time. Only 27.79% of fleets achieve 95-100% compliance. Every missed PM is a future emergency repair at 3-9× the cost. Track by vehicle, by tech, and by PM type. Low compliance on a specific vehicle often means it's hard to schedule out of service.
Reactive vs. Preventive Ratio
Split all work orders into categories: preventive, corrective (planned), and emergency/reactive. Benchmark: reactive should be below 6.17% of total work orders. High reactive rates mean PM programs are failing or vehicle age is driving breakdowns. This is the single best indicator of fleet maintenance program health.
Downtime Cost Analysis
Track days each vehicle is out of service and assign a revenue-loss value. A service truck generating $800-1,500/day in revenue that's down for 3 days = $2,400-4,500 in lost revenue plus repair cost. Downtime is often 2-3× the repair bill. Element Fleet projects 20-25% increase in downtime through 2026 due to technician shortages.
Budget Variance Dashboard
Monthly actual vs. budgeted maintenance spend, broken by category (PM, reactive, consumables, major). Plan for 5-8% annual parts inflation and 6-10% labor increases. Include a 5-10% reserve for unforeseen expenses. Variance analysis catches cost creep before it becomes a crisis — the fleet managers who review this monthly outperform those who check quarterly.
Stop Guessing. Start Tracking Every Dollar.
Oxmaint auto-generates cost-per-vehicle, cost-per-mile, PM compliance, and budget variance reports from every work order your team completes. No spreadsheets. No guessing. Just data that saves money.
Cost Escalation by Vehicle Age: When to Replace
The single biggest cost driver in fleet maintenance isn't parts prices or labor rates — it's vehicle age. Data from Fleetio's 2025 benchmark report shows the cost curve steepens dramatically after specific milestones:
Warranty coverage, low failure rates. 45% of fleet vehicles fall here. Focus: PM compliance to protect warranty, establish baseline costs for each vehicle.
Warranty expired. Brake systems, suspension, A/C compressors begin failing. TCO sweet spot for replacement is often around year 3 or before 100K miles for commercial vehicles.
Major systems aging: transmission, engine components, electrical. Downtime increasing. Repair-vs-replace analysis should happen at every major repair. Trade cycle benchmark: 7.5 years (ATRI 2023).
Cost per mile 35% higher than younger vehicles. Engine rebuilds, transmission replacements common. 21% of fleets still run vehicles to complete inoperability — guaranteeing maximum cost and maximum downtime.
How Oxmaint Delivers Fleet Cost Intelligence
Every work order your team completes in Oxmaint automatically feeds the cost reporting engine. No manual data entry, no spreadsheet wrangling — just real-time visibility into where every maintenance dollar goes:
Automatic Cost Capture per Work Order
Parts, labor hours, vendor invoices, and consumables are logged against each vehicle as work orders are completed. Running cost totals update in real time. No end-of-month reconciliation surprises.
Vehicle Lifecycle Cost Tracking
Total cost of ownership calculated from acquisition through every repair, PM, tire, and fluid change. Depreciation plus maintenance cost curves show exactly when each vehicle crosses the replace-vs-repair threshold.
PM Compliance Scoring & Alerts
Automated scheduling based on mileage or time intervals. Compliance percentage tracked per vehicle and fleet-wide. Overdue PM alerts escalate to managers. Target: 95%+ compliance to join the top 27.79% of fleets.
Budget vs. Actual Dashboards
Set annual budgets by cost category. Monthly variance reporting shows where you're over or under. Drill into specific vehicles, repair types, or vendors to find the source of overruns. Export to PDF or CSV for leadership reporting.
Vendor & Parts Cost Comparison
Track what you're paying for the same service across different vendors. Identify parts price inflation trends. Negotiate volume pricing with data — not guesswork. Average service cost benchmark: $105.87/work order (Q1 2025).
Data-Driven Fleets Spend 20-30% Less
Companies that track maintenance cost per vehicle, PM compliance, and reactive-vs-preventive ratios achieve 20-30% lower total fleet costs. Oxmaint puts these numbers on your dashboard — automatically, from day one.
Frequently Asked Questions
What is a good cost per mile for fleet maintenance?
The 2025 benchmark for lean service fleets is $0.24 per mile total cost, with maintenance specifically at $0.06/mile. Industry-wide average cost per mile peaked at $0.39 in 2022 and has stabilized to $0.29 by 2024. ATRI found total operating cost per mile hit a record $2.27 in 2023 for trucking. Compare your fleet against these benchmarks monthly to identify vehicles and categories driving costs above target.
How much should I budget per vehicle for fleet maintenance?
The annual TCO benchmark for service fleet vehicles is $9,584 per vehicle. Flag any vehicle exceeding this by 15% or more ($11,000+) for repair-vs-replace review. Light duty trucks average $3,500-6,500 annually, medium duty $8,000-15,000, and heavy equipment $15,000-25,000. Budget 40-50% for PM, 25-35% for reactive, 8-12% consumables, 10-15% major repairs, with a 5-10% reserve. Plan for 5-8% annual parts inflation.
When should I replace a fleet vehicle instead of repairing it?
Cost per mile increases 35% after 10 years ($0.23 to $0.31/mile). The TCO sweet spot is often around 3 years or before 100,000 miles for commercial vehicles. Average trade cycle is 7.5 years (ATRI 2023). Key decision trigger: when a single repair exceeds 50% of the vehicle's current market value, or when total annual maintenance exceeds the annual cost of a replacement lease. Only 21% of top-performing fleets use lifecycle cost data for replacement timing.
What percentage of maintenance should be preventive vs. reactive?
Reactive/emergency work orders should be below 6.17% of total (Fleetio benchmark). Target PM at 40-50% of total budget. Preventive maintenance shows 545% ROI — an oil change averages $78 vs. $797 for a radiator replacement when PM is skipped. Only 27.79% of fleets achieve 95-100% PM compliance, yet those that do see dramatically lower total costs and downtime.
How does CMMS reduce fleet maintenance costs?
Oxmaint captures parts, labor, and vendor costs on every work order automatically, then generates cost-per-vehicle, cost-per-mile, PM compliance, reactive ratio, and budget variance reports without spreadsheet work. This visibility enables fleet managers to identify money-pit vehicles, catch cost creep early, maintain PM compliance above 95%, and make data-driven repair-vs-replace decisions. Companies with this level of tracking achieve 20-30% lower total fleet costs.