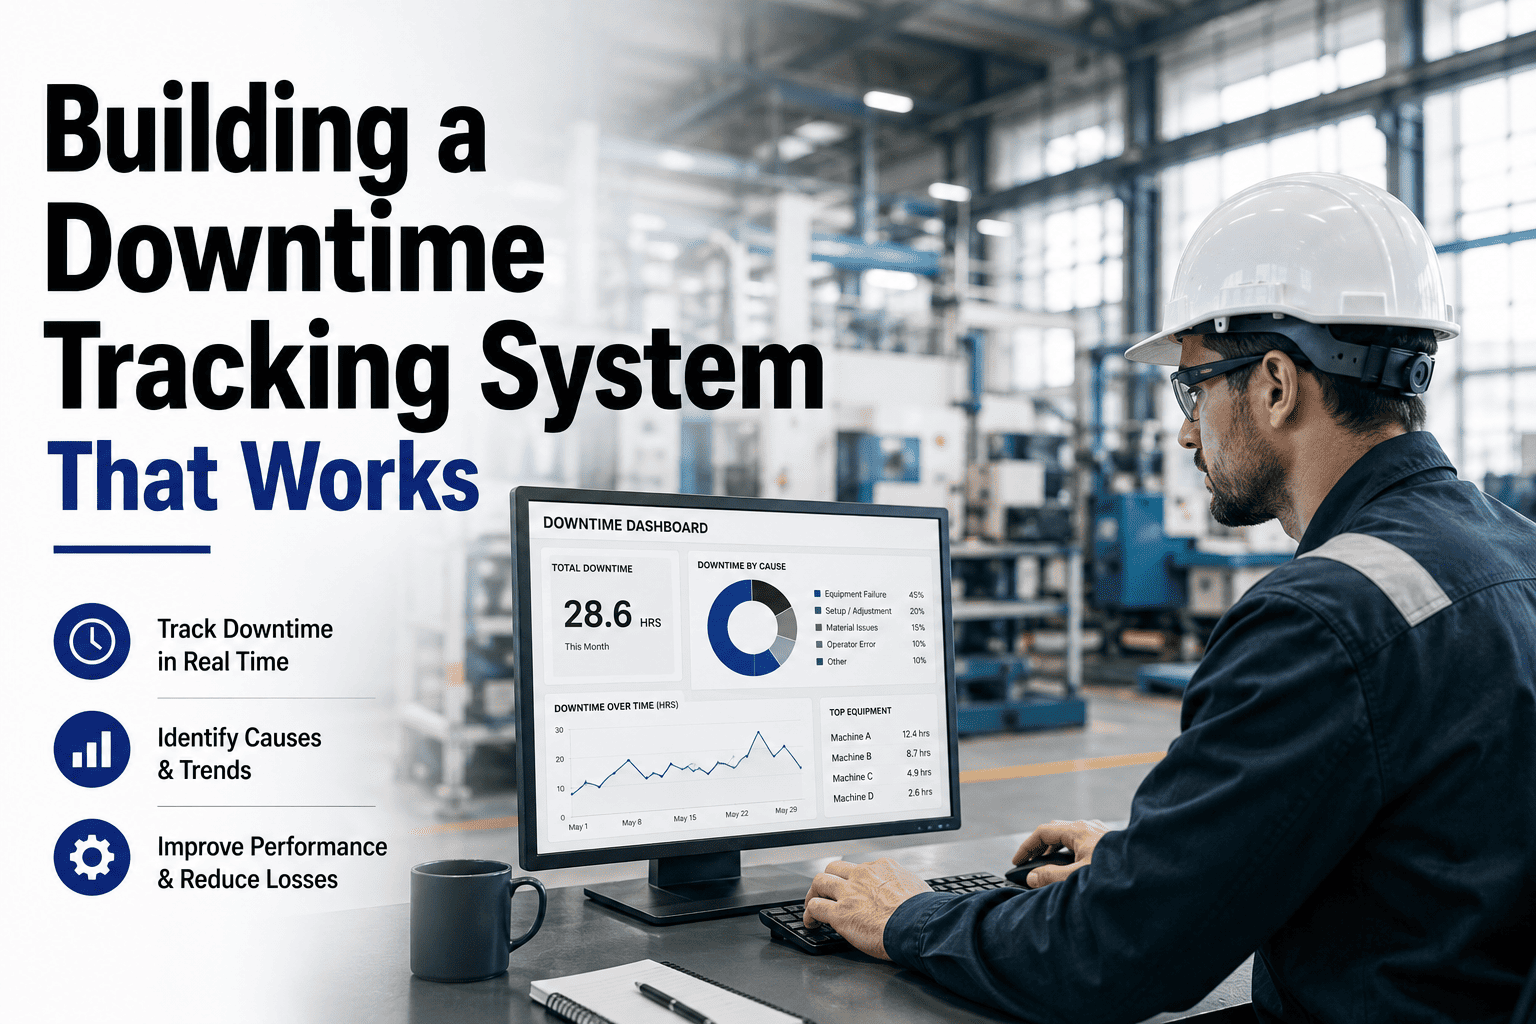
A downtime tracking system captures the exact start time, end time, and root cause of every production stoppage so your maintenance and reliability teams can replace guesswork with data. Manufacturing plants that log downtime events with disciplined reason codes typically cut unplanned downtime 25–40% within the first year, because the patterns hiding in the data finally become visible. This guide walks through how to build a downtime tracking system that actually works — from operator entry design and reason-code taxonomy to MES-CMMS integration and minor-stop capture — and shows how OxMaint turns raw downtime data into preventive and predictive action. Ready to stop guessing and start measuring? Start Free Trial and see your downtime data in one dashboard within hours.
DOWNTIME TRACKING GUIDE
How much production are you losing to downtime you never captured?
Most plants track major failures but miss the 2-minute micro-stops, shift-change gaps, and changeover overruns that quietly erode OEE by 15–20%. A purpose-built downtime tracking system captures every event — and tells you exactly where to act.
$50K+
Annual loss per critical asset from untracked minor stops and unplanned downtime — recovered when you capture every event
WHY DOWNTIME TRACKING MATTERS
The hidden cost of unmeasured downtime
Unplanned downtime costs industrial manufacturers an estimated $50 billion per year globally — yet most plants only capture 40–60% of actual downtime events, leaving the rest invisible in shift handovers and paper logs.
82%
of companies have experienced unplanned downtime in the past 3 years
4 hrs
average duration of a single unplanned downtime event in mid-size plants
$260K
average annual cost of a single critical machine's unplanned outages
The gap between what plants think they lose and what they actually lose comes down to downtime data collection. When operators rely on paper logs or end-of-shift memory, events under 5 minutes go unrecorded entirely. A study across 200+ discrete manufacturers found that micro-stops — those lasting under 2 minutes — account for up to 10% of total available production time, yet appear in fewer than 3% of downtime reports. Without a structured downtime tracking system, your reliability team is fighting a battle blindfolded.
STEP-BY-STEP BUILD
How to build a downtime tracking system in 5 phases
Rolling out machine downtime tracking that actually drives improvement requires a phased approach — skip any step and the data loses its teeth within 90 days.
PHASE 1
Define scope and asset criticality
Rank every asset by production impact and criticality (A/B/C classification). Track all Class-A assets first — typically the top 20% of equipment that drives 80% of downtime cost. Mount QR codes at each station so operators can log events in under 10 seconds from a phone or tablet.
PHASE 2
Design a 3-level reason-code taxonomy
Build a hierarchy: Level 1 = category (Equipment Failure, Changeover, Material Shortage), Level 2 = sub-system (Drive, Hydraulics, Controls), Level 3 = specific failure mode (Bearing seizure, Seal leak, Sensor fault). Cap Level 1 at 8 codes and Level 2 at 25 — more than that and operators default to "Other," which destroys your data.
PHASE 3
Deploy operator-friendly downtime logging
Give operators a one-tap interface — tablet kiosk at each line, mobile app, or MES/SCADA integration that auto-triggers a reason prompt when a machine stops. The entry must take under 15 seconds; if it takes longer, compliance drops below 60% within a month and the data becomes unreliable.
PHASE 4
Integrate downtime capture with your CMMS
Feed every downtime event directly into your CMMS so each stop automatically opens or links to a work order with asset ID, reason code, and duration pre-filled. This eliminates manual re-entry and ensures reliability engineers see the full failure history when planning preventive maintenance.
PHASE 5
Run weekly downtime analysis reviews
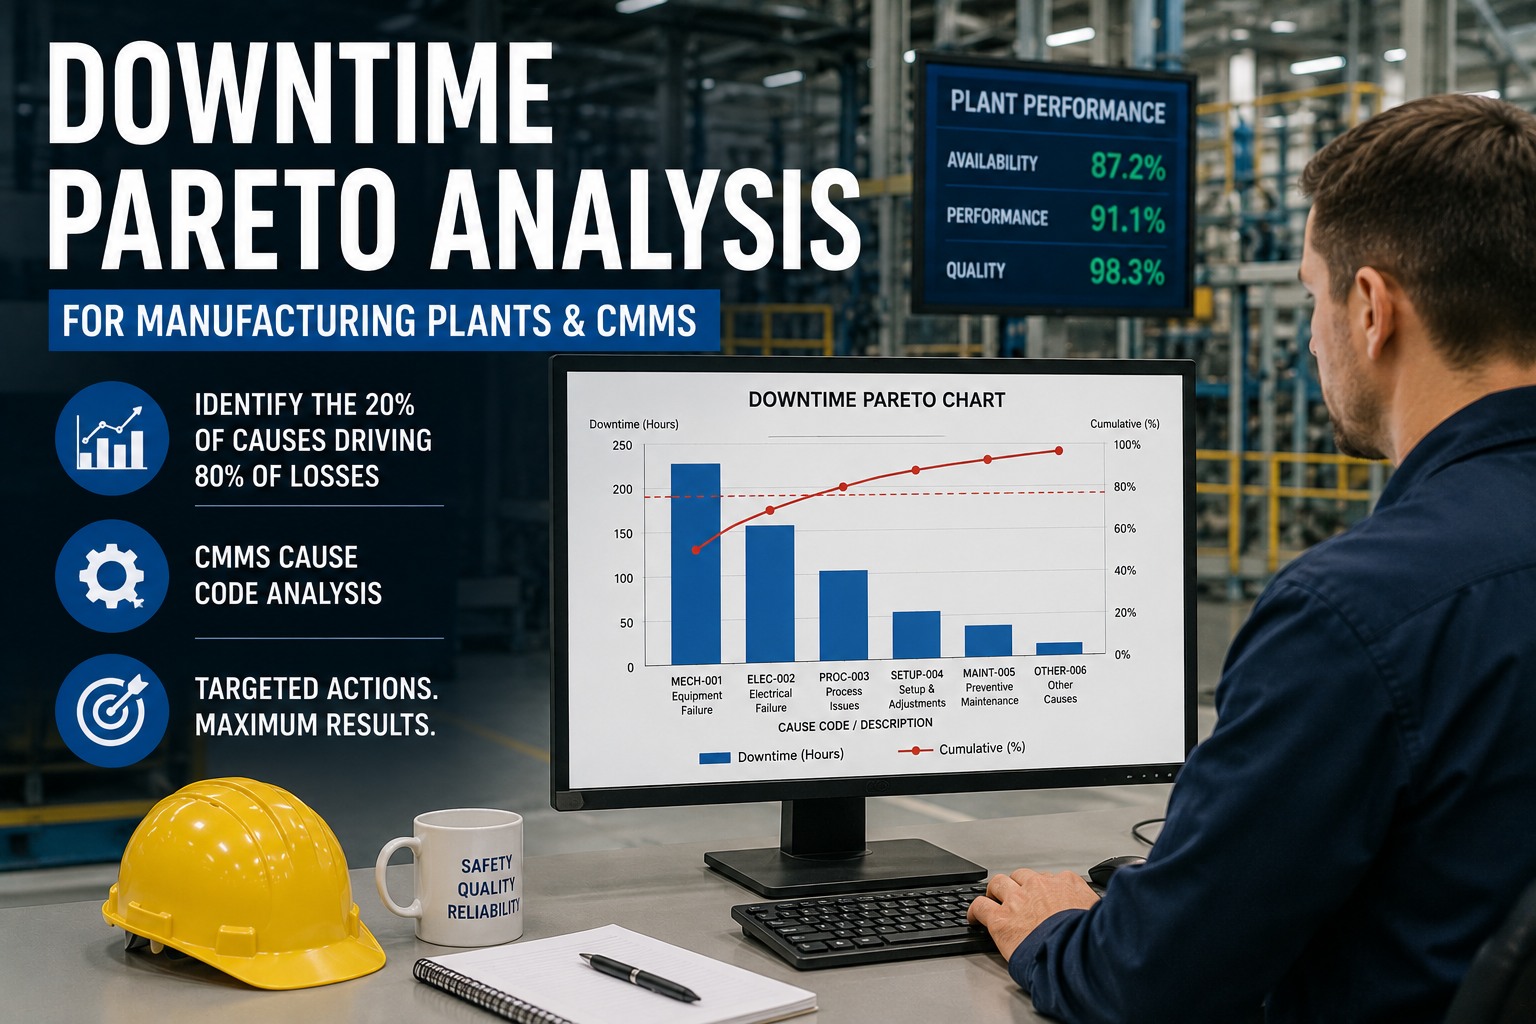
Review Pareto charts of downtime by reason code every week with both maintenance and operations. The top 3 reason codes should drive your improvement backlog — not a generic "reduce downtime" goal. Plants that hold these reviews cut their top downtime cause by 50% within 60 days.
REASON CODE DESIGN
Downtime reason codes that produce actionable data
The single biggest failure in downtime tracking manufacturing implementations is a reason-code list with 40+ options — operators pick "Other" 70% of the time and the data becomes useless. Here's the taxonomy that works.
| Level 1 — Category |
Level 2 — Sub-System |
Level 3 — Failure Mode |
Owner |
| Equipment Failure |
Mechanical Drive |
Bearing failure, Belt break, Gear wear |
Maintenance |
| Equipment Failure |
Electrical / Controls |
Sensor fault, VFD trip, Contactor failure |
Maintenance |
| Equipment Failure |
Hydraulics / Pneumatics |
Pressure loss, Valve stuck, Leak |
Maintenance |
| Changeover / Setup |
Format Change |
Die swap, Recipe load, First-piece approval |
Operations |
| Material / Supply |
Upstream Shortage |
Component stockout, Quality hold on input |
Supply Chain |
| Operator / Process |
Minor Stop |
Clear jam, Reset sensor, Reposition part |
Operations |
| Planned Maintenance |
Scheduled PM |
Weekly inspection, Calibration, Overhaul |
Maintenance |
A well-structured reason-code taxonomy does more than categorize downtime — it assigns ownership. When "Material Shortage" is owned by Supply Chain and "Minor Stop" is owned by Operations, the maintenance team stops getting blamed for losses they don't control. That shift alone changes the conversation in weekly production meetings and lets reliability teams focus on the equipment failures they can actually prevent.
FORMULA & METRICS
Downtime metrics every reliability team should track
Downtime reporting is only valuable if it feeds metrics that drive decisions. These four formulas turn raw downtime logs into KPIs your plant manager, reliability engineer, and CFO all care about.
WORKED EXAMPLE
A 180-asset food packaging plant was reporting 6% downtime rate on paper logs — but operators were only logging events over 10 minutes. After deploying OxMaint for downtime tracking with tablet-based logging and MES integration, the plant discovered its true downtime rate was 14.3%. The top reason code was "Minor Stop — Clear jam" at 31% of total downtime, a category that had never appeared in paper logs. By targeting jam-reduction PMs and sensor upgrades on the two worst lines, the plant cut its downtime rate to 7.1% in four months — recovering $312,000 in annual production capacity on a $0 software cost basis during the 14-day trial.
HOW OXMAINT HELPS
How OxMaint turns downtime data into reliability wins
OxMaint is an AI-powered CMMS and EAM platform built to capture, analyze, and act on downtime — so your team arrives at every morning huddle with root causes, not questions.
Automated downtime capture
Connect OxMaint to your PLCs, SCADA, or MES via OPC-UA or MQTT and every machine stop auto-logs with timestamp and duration. Operators confirm or correct the reason code in one tap — no paper, no end-of-shift data entry. Outcome: 95%+ event capture rate vs. 40–60% with manual logs.
AI-driven downtime analysis
OxMaint's AI engine groups downtime events by asset, reason code, and shift — then surfaces the top 3 loss drivers as automated Pareto charts delivered to your inbox every morning. Outcome: identify your biggest downtime cause in minutes, not a week of spreadsheet work.
Auto-generated work orders
Every unplanned downtime event above your threshold automatically creates a CMMS work order with asset ID, reason code, downtime duration, and technician assignment pre-filled — no manual entry. Outcome: cut work-order creation time by 80% and never lose a failure event to paperwork again.
Predictive maintenance from downtime patterns
OxMaint analyzes downtime frequency and duration trends per asset to predict the next failure window — then schedules preventive maintenance before it happens. Outcome: plants using OxMaint cut unplanned downtime 30–50% within 6 months.
MES + CMMS INTEGRATION
Why production downtime tracking needs MES-CMMS integration
A downtime tracking system that lives in a spreadsheet or a standalone MES report is a graveyard of data nobody acts on. When you bridge MES and CMMS, every downtime event becomes a trigger for maintenance action.
Without Integration
- Operator logs downtime on paper or in MES terminal
- Maintenance only hears about failures via radio or email
- Technician arrives with no failure history or reason code
- MTTR averages 3–5 hours due to diagnosis time
- Downtime data reviewed monthly — patterns already cold
- No link between downtime events and PM schedule adjustments
With OxMaint Integration
- Machine stop auto-logs downtime with timestamp and duration
- Work order triggers instantly with asset, reason, and history
- Technician arrives with full failure history and likely root cause
- MTTR drops to 1–2 hours — diagnosis is pre-done by the data
- Daily Pareto dashboards flag top losses by 7 AM every morning
- AI auto-adjusts PM frequency based on real downtime trends
See OxMaint capture your downtime in real time
Book a 30-minute demo and we'll connect OxMaint to a sample asset, show you live downtime tracking, and map out your reason-code taxonomy on the call.
FAQ
Downtime tracking system — frequently asked questions
What is a downtime tracking system and how does it work?
A downtime tracking system is a software tool that automatically or manually captures every production stoppage — recording the start time, end time, duration, asset, and reason code for each event. It works by connecting to machine sensors or PLCs for automatic capture, or by prompting operators to log stops via a tablet or mobile app. The data feeds into dashboards and your CMMS so reliability teams can analyze patterns, trigger work orders, and adjust preventive maintenance schedules.
Start Free Trial to see OxMaint's downtime capture in action.
How do you track equipment downtime accurately?
Accurate equipment downtime tracking requires three elements: automated machine integration (PLC/SCADA/MES) to capture stop times without operator intervention, a structured reason-code taxonomy capped at 8 Level-1 categories so operators can classify stops in under 15 seconds, and a CMMS that logs every event against the asset's history. Plants that combine all three achieve 90%+ data capture accuracy, compared to 40–60% with paper logs alone.
What are the best downtime reason codes for manufacturing?
The most effective downtime reason codes follow a 3-level hierarchy: Level 1 covers broad categories (Equipment Failure, Changeover, Material Shortage, Operator, Planned Maintenance — maximum 8 codes), Level 2 identifies the sub-system (Mechanical, Electrical, Hydraulics), and Level 3 names the specific failure mode (Bearing failure, Sensor fault). Keep the total under 40 codes and never include an "Other" option — if operators can't classify a stop in 15 seconds, the taxonomy is too complex.
How do you capture minor stops and micro-stops in downtime tracking?
Minor stops — events under 2–5 minutes — are the most underreported downtime category and can account for up to 10% of available production time. Capture them by integrating your downtime tracking system directly with machine PLCs or sensors that auto-log any speed drop or stoppage above a configurable threshold (e.g., any stop over 30 seconds). OxMaint's OPC-UA and MQTT connectors capture these automatically and group them by frequency so you can see which asset is racking up 200 micro-stops per shift.
Can OxMaint integrate downtime tracking with our existing CMMS or MES?
Yes. OxMaint connects to MES, SCADA, and PLC systems via OPC-UA, MQTT, and REST APIs to pull downtime events automatically, and it functions as a full CMMS itself — managing work orders, preventive maintenance, asset tracking, and spare-parts inventory. If you already have a CMMS, OxMaint can feed downtime-triggered work orders into it via API.
Book a Demo and we'll map your integration on the call.
Stop losing production to downtime you can't see
Every day without a real downtime tracking system, your plant is losing hours to unmeasured stoppages, unreported micro-stops, and reactive firefighting. OxMaint captures every event, analyzes the patterns, and predicts the next failure — so your reliability team shows up with answers, not questions.
Free 14-day trial · No credit card
![machine-downtime-tracking-template-for-manufacturing-[excel-dashboard]](./manage-post-2k26/uploads/machine-downtime-tracking-template-for-manufacturing-[excel-dashboard].png)
.png)