That conveyor motor runs 16 hours a day, every day. Right now, the bearings are developing micro-fractures you can't hear, see, or feel. In approximately six weeks, it will seize during peak production—halting your line for 8-12 hours while your team scrambles for emergency parts. The repair bill: $3,800. The lost production: $24,000 or more. Here's what makes this frustrating: 80% of motor failures show detectable warning signs weeks before breakdown. A systematic inspection checklist catches what your senses miss—transforming a $28,000 emergency into a $400 scheduled repair.
$1.4T
Lost annually by Fortune 500 to unplanned downtime
Siemens 2024
51%
Of all motor failures originate from bearing problems
IEEE/EPRI Studies
80%
Of bearing failures caused by improper lubrication
Reliable Plant
5:1
ROI ratio for every dollar spent on preventive maintenance
Industry Average
Why Motor Inspections Matter More Than Ever
Manufacturing plants depend on electric motors for everything—conveyors, pumps, compressors, fans, and production machinery. When motors fail unexpectedly, the cascade effect goes far beyond repair costs. IEEE reliability studies found that facilities with maintenance intervals under 12 months had failure rates of just 0.0124 per unit annually. Facilities stretching maintenance beyond 25 months? Their failure rate jumped to 0.0881—seven times worse.
Plants with Regular Inspection
0.8%
Annual failure rate
13% of facilities achieve this level
VS
Plants with Poor Maintenance
9.3%
Annual failure rate
17% of facilities fall here
The difference? Systematic inspection protocols that catch problems early.
The good news: motor failures follow predictable patterns with clear warning signs. Plants that implement digital inspection tracking catch these signals consistently, reducing unplanned downtime by 30-50% within the first year.
Where Motors Fail: The Complete Breakdown
Understanding failure patterns transforms random inspections into targeted prevention. Each component fails in specific ways with distinct warning signs that systematic inspection catches reliably.
Bearings
51%
Heat, vibration, grinding noise, lubricant breakdown
Windings & Insulation
30%
Burnt smell, discoloration, resistance drop, overheating
Rotor Issues
10%
Broken bars, imbalance, eccentricity
External Factors
9%
Contamination, misalignment, power quality
The 10°C Rule
Motor insulation life is cut in half for every 10°C increase above rated temperature. A motor rated for 20 years at 40°C will last only 5 years running at 60°C. Temperature monitoring isn't optional—it's essential.
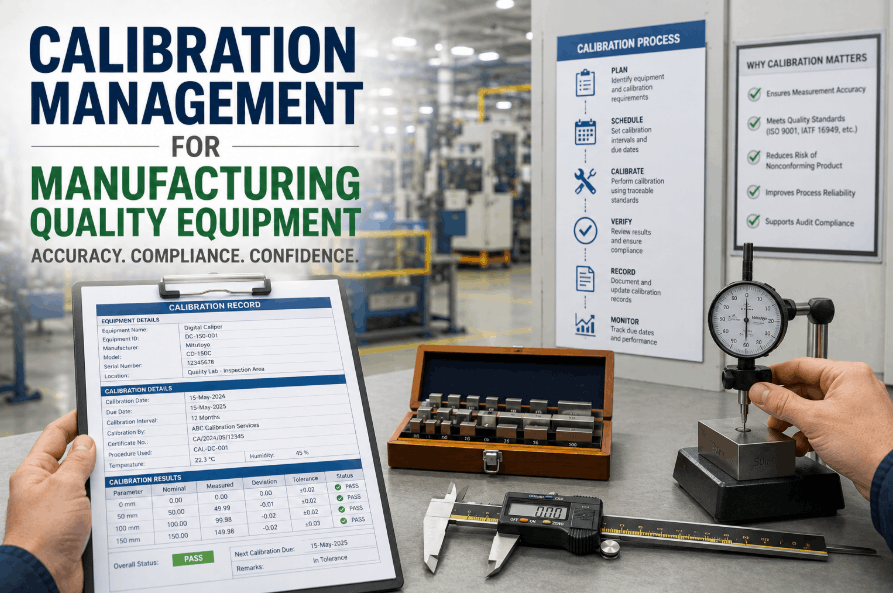
The Complete Motor Inspection Checklist
This 12-point protocol covers every major failure mode with specific thresholds and frequencies based on industry standards. Each checkpoint targets problems at their earliest detectable stage.
01
Terminal Connections
Check corrosion, looseness, heat discoloration
Alert
>20°C above ambient
02
Voltage Balance
Measure all 3 phases, calculate imbalance %
Max
2% imbalance
03
Insulation Resistance
Megohmmeter test, trend results over time
Min
1MΩ/kV + 1MΩ
04
Current Draw
Clamp meter on all phases vs nameplate FLA
Max
115% FLA
05
Bearing Temperature
IR thermometer at bearing housings
Range
<80°C OK | >90°C Act
06
Vibration Levels
3-axis measurement at bearing housings
Action
>4.5 mm/s RMS
07
Lubrication Status
Verify grease type/quantity per OEM spec
Note
80% failures = lube
08
Shaft Alignment
Laser/dial indicator, angular + parallel
Precision
<0.05mm/100mm
09
Cooling System
Clean fins/vents, verify fan operation
Impact
+15-25°C if blocked
10
Housing Temperature
IR scan entire housing for hot spots
Alert
>10°C from baseline
11
Contamination Check
Inspect for dust, oil, moisture ingress
Risk
9% of failures
12
Mounting Integrity
Torque bolts, check foundation, soft foot
Shim if
>0.05mm gap
Teams managing multiple motors across facilities can schedule a walkthrough to see how automated scheduling eliminates missed inspections and builds the trend data that predicts failures.
Ready to Digitize Your Motor Inspections?
See how mobile inspections, automated scheduling, and trend analysis work together to catch problems before they become emergencies.
Inspection Frequency by Motor Criticality
Not every motor needs daily attention. Allocate inspection resources based on failure impact—critical motors that halt production deserve more frequent checks than redundant equipment with backup capacity.
Swipe to view all columns →
Building custom schedules for your motor inventory requires understanding which assets matter most. Maintenance teams ready to optimize can sign up for free access and use built-in templates that adapt to criticality levels automatically.
Expert Perspective
The facilities that achieve world-class motor reliability don't just inspect—they trend. A single temperature reading means nothing in isolation. That same reading compared to last week, last month, and last year tells you exactly where you stand. The IEEE studies proved this: plants with structured inspection programs had failure rates 7-10x better than those without. It's not about working harder; it's about working systematically.
30-50%
Reduction in unplanned downtime with systematic inspection
20-40%
Extension in equipment life with proper maintenance
14.5 mo
Average time to full CMMS ROI
Implementing these inspection protocols requires more than paper checklists—it requires systems that capture data, maintain history, and surface trends automatically. Teams ready to make that transition can book a consultation to see the complete workflow in action.
Stop Reacting. Start Predicting.
Join manufacturing plants using OXmaint to catch motor problems at $400 instead of $28,000. Automated scheduling, mobile inspections, and trend analysis—all in one platform.
Frequently Asked Questions
What causes most electric motor failures?
Bearing failures cause 51% of motor breakdowns, with 80% of those bearing failures resulting from lubrication issues—either too little, too much, wrong type, or contaminated grease. Winding and insulation failures account for another 30%. The critical insight: 80% of all motor failures show detectable warning signs weeks before catastrophic breakdown, making systematic inspection highly effective.
How often should electric motors be inspected?
Frequency depends on motor criticality. Critical motors (single point of failure) need daily temperature checks and weekly vibration analysis. Standard duty motors require weekly visual inspection and monthly electrical tests. IEEE studies show facilities with maintenance intervals under 12 months have failure rates 7x better than those stretching beyond 25 months.
What bearing temperature indicates a problem?
Normal bearing operation stays below 80°C (176°F). Temperatures between 80-90°C warrant increased monitoring. Above 90°C requires immediate investigation—lubricant breakdown accelerates rapidly at these temperatures. More important than absolute temperature: any 10°C rise from your established baseline indicates developing problems.
What's the ROI of preventive motor maintenance?
Industry data shows preventive maintenance delivers a 5:1 ROI—every $1 invested saves $5 in avoided repairs and downtime. Predictive maintenance saves an additional 8-12% over preventive approaches and up to 40% over reactive (run-to-failure) strategies. CMMS implementation typically achieves full ROI within 14.5 months.
What tools do I need for basic motor inspection?
Essential tools include: infrared thermometer ($50-150), clamp-on ammeter ($100-200), megohmmeter for insulation testing ($300-500), and vibration pen ($100-300). A $500-1,500 investment can prevent failures costing $15,000-50,000 each. Digital CMMS platforms add automated scheduling and trend analysis for comprehensive programs.