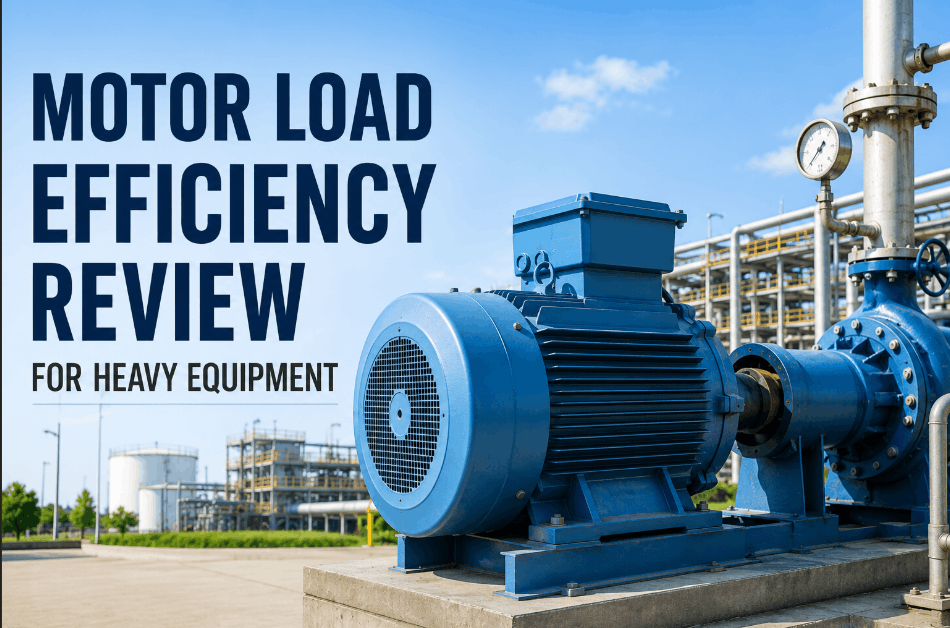
Plant managers face a persistent accountability gap: energy savings are real, but nobody agrees on who gets credit. When a motor upgrade in Building A lowers overall utility bills, does the credit belong to maintenance, operations, or the sustainability team? Without a structured energy savings allocation model, savings get lost in consolidated invoices, departmental disputes stall efficiency programs, and plant-level carbon intensity targets drift without ownership. Sign Up Free to see how OxMaint's asset and work order platform maps energy consumption directly to equipment, cost centers, and maintenance activities — turning abstract utility data into accountable, actionable savings. A proper allocation model connects submetering data, load profiles, and maintenance records so every kilowatt saved has a verified owner. Book a Demo to explore how OxMaint structures energy governance across shared plant areas.
Energy Governance for Plant Operations
Map Energy Savings to Equipment, Teams, and Cost Centers
OxMaint connects asset records, work orders, and meter readings so savings from every efficiency project are tracked, attributed, and reportable — across every shared zone in your plant.
30–40%
of industrial energy waste tied to untracked idle loads and thermal loss
3×
faster efficiency reviews with submetered asset-level data vs. consolidated billing
$180K+
average annual operating cost reduction per mid-size plant with structured allocation
Why Energy Savings Get Lost Without an Allocation Model
Shared infrastructure — compressed air headers, steam distribution, HVAC zones, cooling towers — serves multiple production areas simultaneously. When a leak is fixed or a motor is right-sized, the savings appear only on the master utility meter. Without submetering and a defined allocation methodology, savings are invisible at the department level. Sign Up Free to attach meter readings directly to assets in OxMaint, so every maintenance action generates a measurable energy baseline shift. The result: plant managers can present verified savings by cost center, not just plant-wide totals.
Compressed Air Losses
Leak repairs unlinked to cost center savings
Work order closes with kWh delta logged to zone asset
Steam Distribution
Steam trap failures inflate total utility cost, unattributed
Trap inspection records tied to BTU loss estimates per line
Motor Load Optimization
VFD upgrades show no departmental savings credit
Motor asset records track pre/post demand profile
Idle Load Management
Idle equipment draws unmeasured baseline power
Scheduled downtime tasks reduce idle load, logged by shift
Carbon Intensity Reporting
Plant-wide kWh gives no per-product carbon view
Asset-level consumption feeds carbon intensity per run
The 5 Layers of an Energy Savings Allocation Model
Utility Mapping and Submetering
Link meter points to asset hierarchies in OxMaint
InputMain meter + zone submeters + circuit-level sensors
OutputConsumption baseline per cost center, per asset
Without submetering, shared areas (HVAC, compressed air, water treatment) consume energy that appears nowhere in departmental budgets. OxMaint's asset hierarchy maps meter points to equipment records, establishing the data foundation for all downstream allocation.
Layer 1
Demand Profile Analysis
Correlate production schedules with load data
InputShift schedules, production run logs, meter interval data
OutputPeak demand attribution by line, shift, and product
Demand charges often represent 30–50% of industrial utility bills. Mapping demand spikes to specific production activities — using OxMaint's work order timestamps alongside meter data — identifies which lines drive peak demand and where load balancing changes reduce cost.
Layer 2
Thermal Waste and Steam Loss Accounting
Inspection records generate BTU loss estimates
InputSteam trap inspection results, insulation audit findings
OutputHeat loss cost attributed to distribution segment
Failed steam traps and uninsulated lines bleed energy continuously. OxMaint's inspection checklists capture trap condition and insulation gaps; combined with BTU loss formulas, each finding generates an estimated annual cost that feeds directly into the allocation model.
Book a Demo to see the inspection-to-savings workflow.
Layer 3
Maintenance Action Attribution
Close work orders with pre/post energy readings
InputWork order completion + meter reading before and after
OutputVerified kWh or BTU saved per maintenance action
Every efficiency action — motor replacement, VFD installation, air leak repair, heat exchanger cleaning — has a measurable energy impact. OxMaint captures pre- and post-action readings at work order close, creating a verified savings record linked to the asset, technician, and cost center responsible.
Layer 4
Energy Governance Reporting
Periodic efficiency reviews with attributed savings tables
InputAsset consumption history, work order savings log, meter trends
OutputCost center savings report, carbon intensity per product, power factor trend
Monthly and quarterly efficiency reviews require presenting savings at the cost center level — not plant totals. OxMaint's reporting exports asset-level consumption history, maintenance-attributed savings, and trend data so plant managers can show exactly which areas improved, by how much, and why.
Layer 5
Shared Plant Areas — Allocation Logic by Zone
Compressed Air System
Flow volume by line (m³/hr)
Leak inspection work orders log CFM loss per zone asset
Steam Distribution
Trap condition and line BTU loss
Trap inspection checklists generate BTU loss estimate per segment
HVAC / Cooling Towers
Zone area (m²) or ton-hours served
Preventive maintenance tasks track filter and coil condition by zone
Motor-Driven Equipment
Run hours × nameplate kW
Asset runtime logs in OxMaint calculate consumption per motor asset
Water Treatment / Pumping
Volume processed (m³) per area served
Pump maintenance records track efficiency degradation over service life
Lighting (Production Zones)
Operating hours by zone schedule
Shift-based PM schedules log fixture condition and retrofit completions
How OxMaint Builds the Data Foundation for Energy Allocation
Step 1
Asset Hierarchy and Meter Mapping
Register all energy-consuming assets in OxMaint with location, cost center, and nameplate data. Map available meter points to asset groups. Where submeters don't yet exist, use runtime-based estimation until hardware is installed.
Step 2
Baseline Consumption Recording
Run 4–8 weeks of meter reading collection before any efficiency work begins. Log readings against asset records in OxMaint to establish the pre-improvement baseline used for all future savings calculations.
Sign Up Free to start baseline data collection immediately.
Step 3
Work Order Integration for Savings Capture
Configure work order templates in OxMaint with pre/post energy reading fields for efficiency-type tasks. Technicians record meter values at job close; the platform logs the delta against the asset record automatically.
Step 4
Periodic Efficiency Review Reporting
Schedule monthly efficiency reviews using OxMaint's asset consumption reports. Export cost center savings tables, maintenance action attribution logs, and carbon intensity trends for management reporting and sustainability audits.
Book a Demo to see the reporting workflow.
Energy Savings Model: Manual Tracking vs. OxMaint-Structured Allocation
Savings attribution accuracy
Estimated / disputed (manual)
Verified per work order (OxMaint)
Idle load visibility
Runtime-logged per asset (OxMaint)
Steam / thermal loss tracking
Annual audit only (manual)
Each inspection generates BTU estimate
Carbon intensity per product
Unavailable without asset-level data
Calculated from asset run logs (OxMaint)
Manual Tracking
OxMaint Allocation Model
Compressed Air Accountability
10–30% leakage reduction
Leak inspection work orders log CFM loss per zone. Repairs close with verified flow improvement, attributed to cost center.
Motor Load Optimization
15–25% motor energy reduction
Asset records capture motor nameplate data and runtime. VFD and right-sizing upgrades are tracked with pre/post demand profiles.
Steam System Efficiency
$12K–$40K BTU savings per year
Steam trap inspection checklists generate BTU loss estimates per failed trap, feeding the allocation model directly.
Idle Load Reduction
5–15% baseline demand cut
Scheduled downtime PMs in OxMaint ensure equipment de-energization is tracked as a recurring task, not left to operator discretion.
Power Factor Improvement
3–8% utility billing reduction
Capacitor bank and motor maintenance records in OxMaint create a power factor trend log used to justify and verify correction projects.
Reporting and Audit Time
80% reduction in prep time
OxMaint's asset history replaces manual spreadsheet reconciliation — efficiency reviews that took days take hours with structured allocation data.
Total Operating Cost Impact: $35K–$120K annually for mid-size plants using OxMaint's asset-linked energy allocation model
Plant Energy Governance
Attribute Every Kilowatt Saved. Defend Every Efficiency Claim.
OxMaint links work orders, asset records, and meter readings into a verified energy allocation model — so plant managers can present cost center savings with data, not estimates.
Frequently Asked Questions — Energy Savings Allocation for Plant Managers
What is an energy savings allocation model in a plant context?
It is a structured methodology for distributing measured energy consumption and savings across departments, cost centers, or production lines — so each area has verified accountability for its energy spend and efficiency improvements.
How does OxMaint support energy savings allocation without a dedicated energy management system?
OxMaint's asset hierarchy, work order completion fields, and inspection checklists capture the data inputs for allocation — meter readings, runtime logs, maintenance outcomes — without requiring a separate energy platform.
Sign Up Free to set up your asset hierarchy today.
Which shared plant areas are hardest to allocate energy costs to?
Compressed air, steam distribution, and HVAC systems are the most common problem areas because they serve multiple zones simultaneously. OxMaint uses flow-based and area-based allocation drivers tied to inspection and maintenance records to address these.
Can OxMaint track carbon intensity per product line?
Yes. By linking asset energy consumption to production run work orders, OxMaint generates consumption-per-run data that can be converted to carbon intensity per unit or per product line for sustainability reporting.
How often should plant managers run energy efficiency reviews using this model?
Monthly reviews using OxMaint asset reports are recommended for active efficiency programs; quarterly reviews are the minimum for maintaining accountability and catching degradation before it escalates to budget impact.
Book a Demo to see the review workflow.
Does the allocation model require submeters on every circuit?
No. OxMaint supports a hybrid approach: zones with submeters use direct meter data; unmetered zones use runtime-based estimation from asset records. Allocation accuracy improves as metering expands, but the model works from day one.
Energy Allocation and CMMS
Stop Estimating. Start Attributing Energy Savings with Verified Data.
30–40%
typical untracked waste found in shared areas
$120K+
annual operating cost impact per plant
80%
reduction in audit preparation time