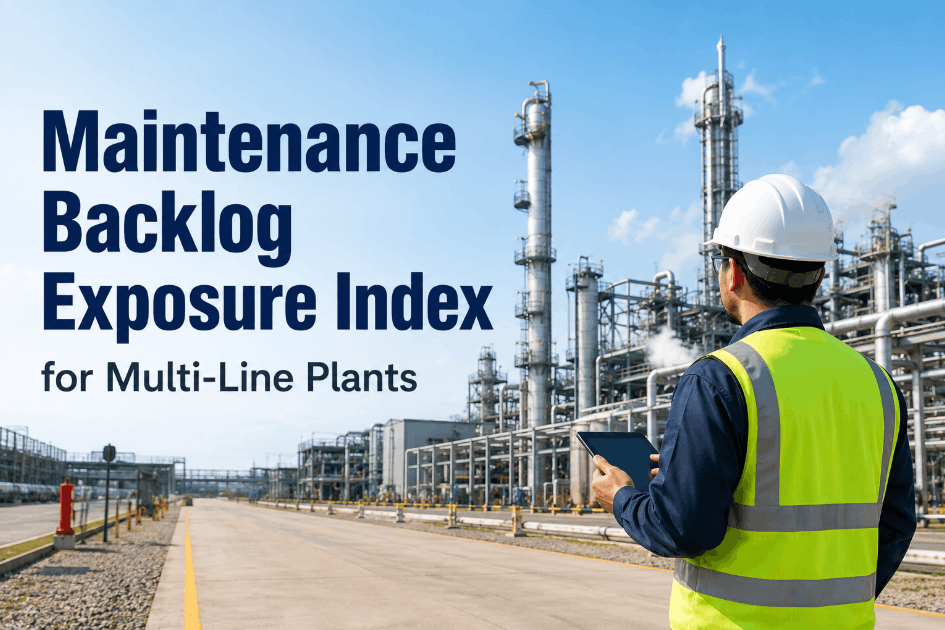
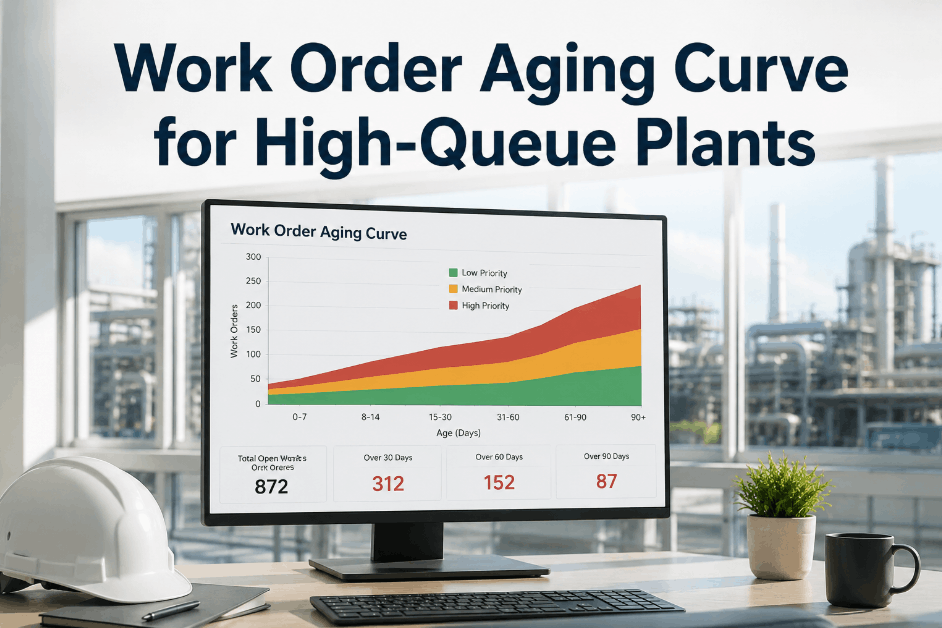
Multi-line plants face a silent operational threat: maintenance backlogs that grow faster than teams can clear them. When open work queues stack up unchecked, overdue PMs accumulate, assignment lag widens, and production pressure builds until a preventable failure forces a reactive response. Facilities that Sign Up Free on Oxmaint can build a structured backlog risk index — mapping open work age, PM overdue rates, and dispatch delays into a single operational score that maintenance planners act on before queue pressure reaches the shop floor. For multi-site or complex plant environments, Book a Demo to see how Oxmaint surfaces backlog risk across production lines in real time.
Oxmaint gives maintenance planners a live risk index — tracking open work aging, PM overdue rates, and assignment lag before queue pressure reaches critical levels.
5 Backlog Indicators That Predict Production Pressure
A maintenance backlog risk index is only as useful as the signals feeding it. Multi-line plants need a structured view of queue health — not just total open work count, but task aging, priority distribution, and technician assignment coverage. Facilities that Sign Up Free on Oxmaint can configure backlog dashboards with automatic aging thresholds and priority-based escalation rules without spreadsheet maintenance.
Work orders sitting unassigned beyond shift or daily targets signal planner capacity gaps or technician availability issues before they compound into critical backlogs.
PM compliance slippage is an early indicator of backlog pressure. When scheduled preventive tasks age past due dates, reactive work volume typically follows within days.
Time from work order creation to technician assignment reveals dispatch bottlenecks. High assignment lag on priority-one tasks correlates directly with unplanned downtime events.
Measuring open corrective work by production line identifies which assets carry disproportionate queue load — enabling targeted resource reallocation before output is affected.
Backlog risk compounds when low-priority tasks displace critical work. Tracking priority-rule adherence across shifts exposes scheduling drift that formal planning reviews miss.
Comparing work order closure rate to creation rate per line measures whether queues are shrinking or accumulating — the single most actionable metric for maintenance supervisors.
Backlog Risk Scoring: How to Classify Queue Pressure by Line
Not all open work carries equal production risk. A structured scoring model lets maintenance leaders differentiate between manageable queues and accumulations that threaten throughput. Use this framework to benchmark your current backlog health and identify where Oxmaint's work order flow engine closes the gaps. Teams ready to move from spreadsheet tracking to live queue scoring can Book a Demo with Oxmaint.
| Risk Indicator | Measurement Method | Low Risk Threshold | High Risk Threshold | Recommended Action |
|---|---|---|---|---|
| Open Work Age | Average days open per WO | < 2 days | > 5 days | Escalate to planner |
| PM Overdue Rate | % PMs past due date | < 5% | > 15% | Schedule recovery block |
| Assignment Lag | Avg. hours to assign P1 WOs | < 1 hour | > 4 hours | Review dispatch rules |
| Backlog Density | Open WOs per production line | < 10 WOs | > 25 WOs | Reallocate technicians |
| Burn-Down Ratio | Closures vs. creations per shift | > 1.0 | < 0.7 | Add shift capacity |
| Priority Adherence | % P1 WOs closed before P2 | > 90% | < 70% | Retrain planners |
| Task Aging Trend | Week-over-week age increase | Stable / declining | +20% WoW | Flag for weekly review |
| Dispatch Delay | Time to parts and technician ready | < 30 min | > 2 hours | Audit parts availability |
How Multi-Line Plants Deploy Backlog Risk Monitoring Without Extra Headcount
The challenge in high-volume manufacturing is not measuring backlog — it is keeping the measurement current without adding manual reporting overhead. Oxmaint automates work order aging tracking, PM overdue detection, and queue density calculations across every production line in the asset hierarchy. Facilities can Sign Up Free and configure line-level backlog dashboards in the first session — no IT project required.
- Automatic work order aging flags when open tasks exceed planner thresholds
- PM overdue rate tracked per asset and line with escalation alerts
- Assignment lag measured from WO creation to technician acceptance
- Burn-down ratio visible by shift, line, and technician group
- Priority rule compliance scored automatically from work order sequence data
- Backlog density heatmap across the full production asset hierarchy
- Spreadsheet backlogs? Oxmaint replaces manual queue tracking with live WO data
- No planner visibility? Role-based dashboards surface risk without report requests
- Multi-line complexity? Per-line backlog scoring with consolidated plant view
- Shift handover gaps? Automated aging flags carry context across shifts automatically
- Parts delays inflating lag? Storeroom integration links parts status to WO timelines
- No compliance record? Every WO action is timestamped and attributed for audit
16 Questions to Ask Before Selecting a Backlog Risk Management Platform
Platform demos show clean dashboards. These questions expose whether the system tracks aging accurately, escalates automatically, and integrates with how your planners actually work. Teams shortlisting CMMS platforms for backlog control can Book a Demo with Oxmaint for direct answers during evaluation.
- Does the system track open work order age automatically from creation date?
- Can aging thresholds be set differently by priority tier or asset class?
- Is assignment lag calculated and reported per shift and per line?
- Does the platform flag PM overdue rates without manual report generation?
- Can backlog density be viewed by production line and by asset criticality?
- Is burn-down ratio tracked at shift level and weekly planning level?
- Does the system score priority rule adherence automatically from WO sequence?
- Can planners see a live queue heatmap without exporting to spreadsheets?
- Are backlog threshold breaches escalated automatically to supervisors?
- Can alert rules differ by shift, line, or production schedule type?
- Does the mobile app surface backlog risk to technicians without planner intervention?
- Is there a configurable escalation path from backlog flag to management notification?
- Can backlog risk scores be compared week-over-week per line?
- Is there a planned vs reactive ratio report available without custom configuration?
- How is backlog data used to feed capacity planning for the following week?
- What is the total cost of ownership including multi-line and multi-site access?
Backlog Risk Management ROI: What Controlled Queue Flow Delivers
Per-user SaaS pricing with no server infrastructure. Most multi-line facilities configure live backlog dashboards within 30 days of initial onboarding.
Manual backlog tracking consumes planner time that should go to scheduling. Platforms with live auto-calculated queue metrics eliminate weekly reporting cycles entirely.
High PM overdue rates and aging open work directly precede unplanned failures. Each avoided breakdown in a multi-line plant typically recovers multiple months of platform cost.
Plants with structured backlog risk monitoring report measurable improvements in planned maintenance ratio within the first quarter — reducing production stoppages caused by deferred work.
Automated aging flags and priority scoring reduce daily planner coordination overhead by removing manual queue review. Planners focus on resource allocation instead of status tracking.
Timestamped WO records, PM completion history, and backlog trend reports reduce compliance preparation effort and support ISO and customer audit requirements without manual assembly.
Oxmaint gives multi-line plants live backlog visibility — open work aging, PM overdue rates, assignment lag, and burn-down ratio tracked automatically without spreadsheets.
Maintenance Backlog Risk Index — Questions Planners and Operations Leaders Ask
A backlog risk index combines open work queue age, PM overdue rate, assignment lag, and burn-down ratio into a single operational score. It helps maintenance planners identify which production lines face the highest queue pressure before throughput is affected.
Oxmaint calculates work order age from creation date and flags tasks that exceed configurable thresholds by priority tier. Aging alerts appear on planner dashboards and mobile technician views without manual report generation.
Yes. Oxmaint's condition-based rules engine allows planners to set line-specific and criticality-specific aging thresholds — so a bottleneck line triggers escalation faster than a redundant asset with backup capacity.
A burn-down ratio above 1.0 — more closures than creations per shift — indicates a clearing queue. Ratios below 0.7 consistently signal that open work is accumulating faster than the team can resolve it and typically precede reactive events.
Most facilities configure their production line hierarchy, priority rules, and backlog aging thresholds within the first week. Live backlog risk dashboards are typically active within 30 days of initial setup without IT project involvement.
Yes. Oxmaint's multi-site hierarchy provides consolidated backlog risk views across all plants in a single account — with site-specific user roles and portfolio-level comparison dashboards for operations leadership.
Oxmaint gives multi-line facilities a live backlog risk index, automated aging alerts, and mobile work order execution — no IT project required to go live.