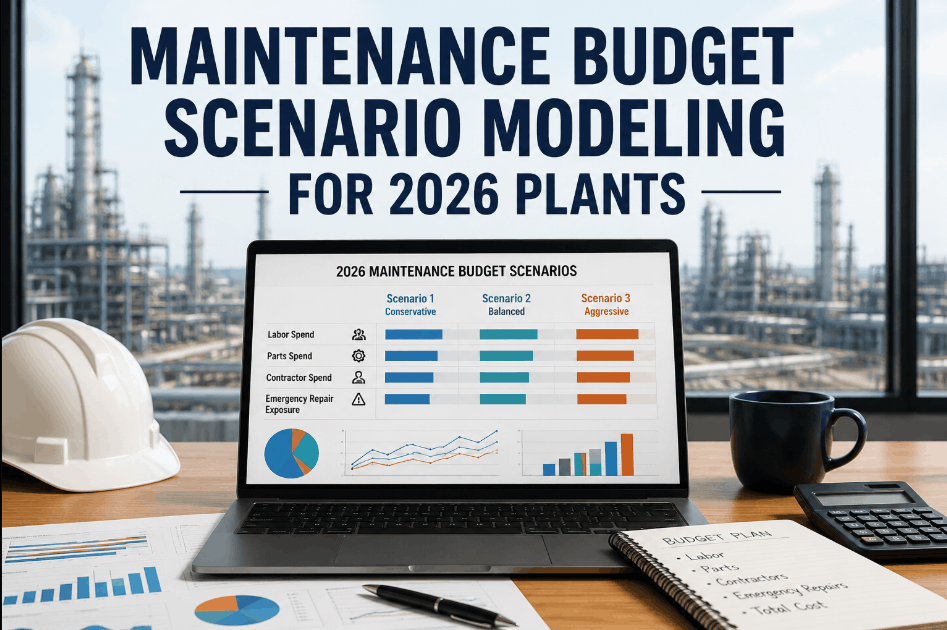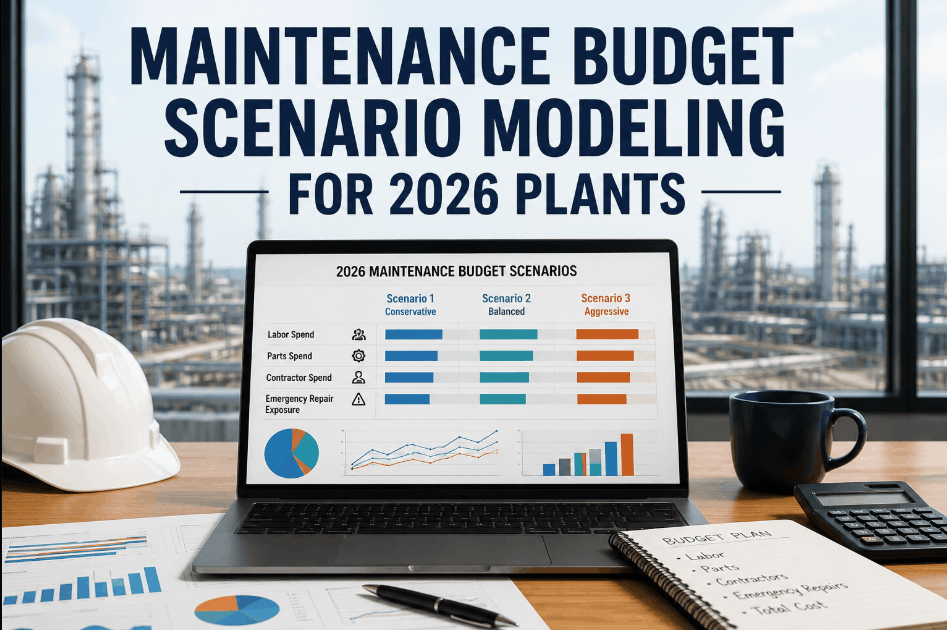
Plant maintenance budgets for 2026 cannot be built on last year's spreadsheets. When labor cost, parts consumption, contractor spend, and emergency repair exposure are tracked across disconnected systems, finance teams and plant managers end up negotiating over estimates rather than analyzing actual cost drivers. Scenario modeling requires consolidated work order cost data — and that is exactly what a CMMS platform provides when every repair, inspection, and replacement is logged with time, materials, and vendor attribution. Sign Up Free on Oxmaint to pull real maintenance spend into budget scenarios instead of relying on averaged assumptions that break down mid-year.
The Four Cost Drivers Every Plant Budget Scenario Must Include
Accurate scenario modeling starts with isolating the cost categories that actually move the budget. Book a Demo to see how Oxmaint breaks down maintenance spend into actionable cost drivers across your plant portfolio.
Total technician hours logged against planned preventive maintenance, inspections, and scheduled overhauls. Oxmaint tracks labor time per work order so you can project crew utilization and overtime exposure under different PM interval scenarios.
Cost of replacement parts, lubricants, filters, and consumables tied to specific assets and work order types. Historical parts data in Oxmaint lets you model inventory carrying costs against projected failure replacement demand.
Spend on third-party technicians, specialized repair services, and equipment OEM support contracts. Oxmaint logs contractor costs per work order so you can compare insourced versus outsourced scenarios with real data.
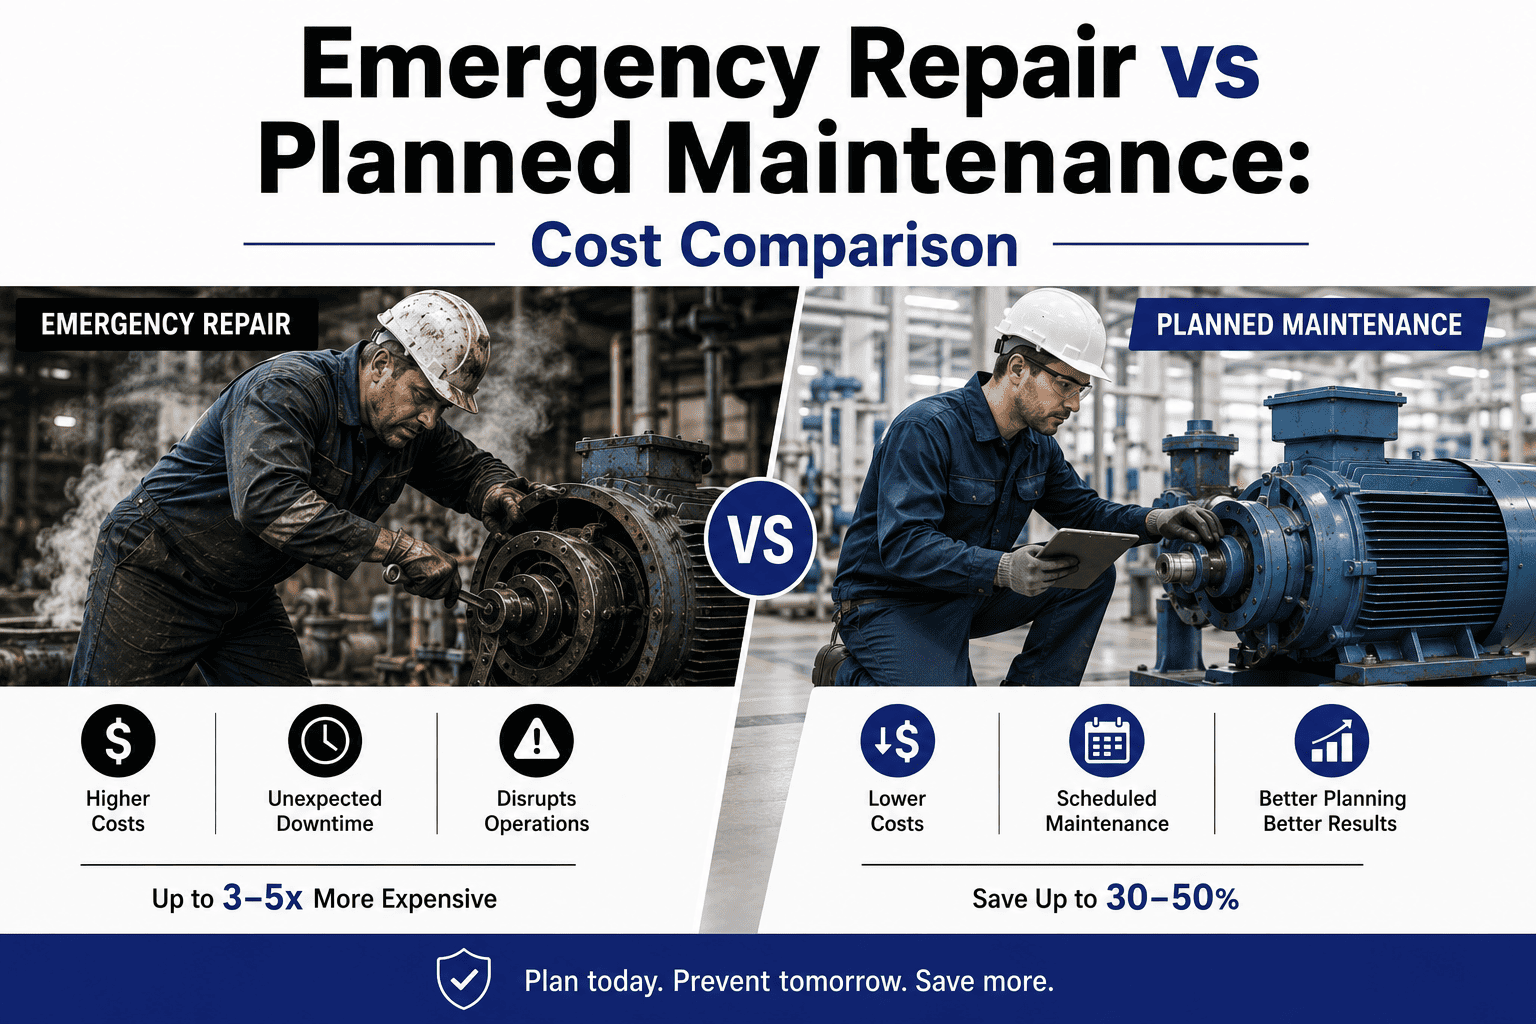
Unplanned work order costs including overtime labor, expedited parts, and production downtime impact. Oxmaint's reactive-to-planned work order ratio gives finance a quantified risk metric for each scenario model.
Building Scenario Models from Work Order History in Oxmaint
Export Cost Data by Category and Time Window
Pull work order cost summaries from Oxmaint segmented by labor, parts, contractors, and reactive versus planned classification for the trailing 12–24 months. This becomes the baseline dataset for all scenario projections.
Model PM Expansion Impact on Reactive Spend
Use Oxmaint's planned-to-reactive work order ratio to project how increasing PM frequency on critical assets reduces emergency repair costs. Sign Up Free and use historical resolution data to quantify the tradeoff.
Compare Insourced vs. Outsourced Maintenance Costs
Filter Oxmaint work orders by assigned technician type — internal crew versus external contractor — and compare total cost per repair category. This comparison supports make-versus-buy decisions in capital-constrained scenarios.
Stress-Test Scenarios Against Asset Replacement Thresholds
Identify assets in Oxmaint with cumulative repair costs approaching replacement value. Scenario models that continue servicing these assets inflate reactive spend projections — flagging them for capital budget consideration instead.
Present Scenario Comparison to Finance with Documented Data
Oxmaint's reporting exports give plant managers cost-per-asset, cost-per-category, and trend data that finance teams can audit — replacing negotiation over assumptions with review of documented maintenance spend patterns. Book a Demo to see the reporting layer.
Budget Scenario Comparison Framework
| Scenario | PM Investment | Projected Reactive Spend | Contractor Reliance | Risk Level |
|---|---|---|---|---|
| Baseline — Maintain Current | No change | Within 5% of prior year | Current mix | Moderate |
| Growth — Expand PM Coverage | +15–25% | Projected -20% reduction | Shift to internal crew | Low |
| Constraint — Reduce Total Spend | -10% | Projected +30% exposure | Increase outsourced share | High |
| Capital Shift — Replace High-Cost Assets | Redirect to capital | -35% on replaced assets | OEM warranty period | Low post-deployment |