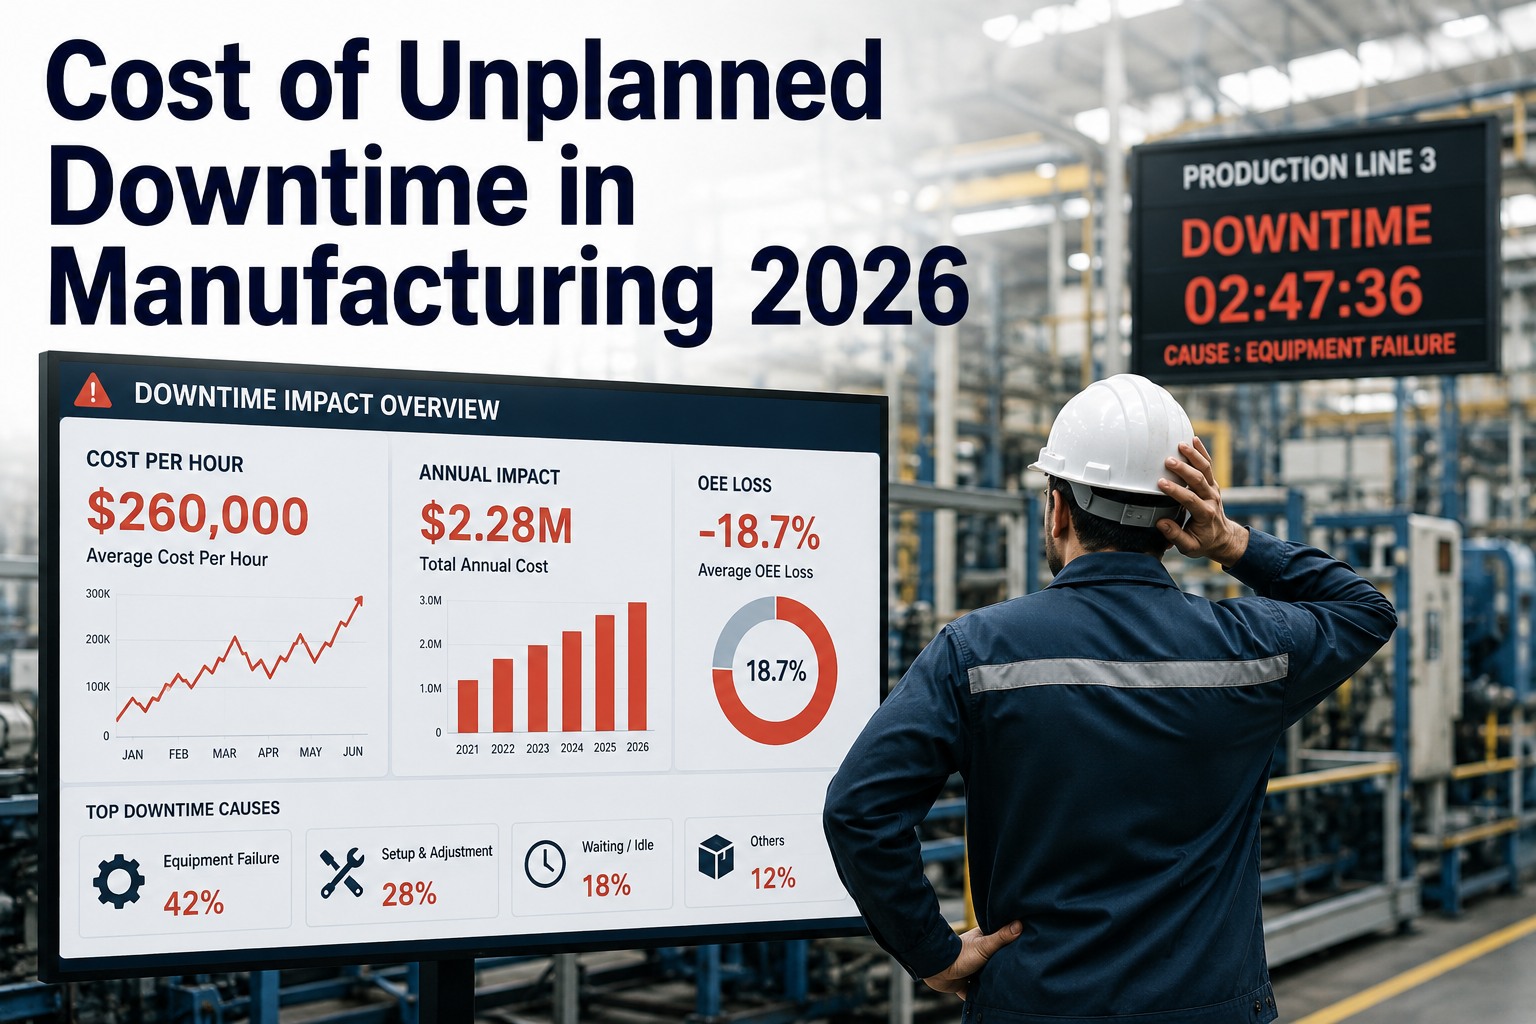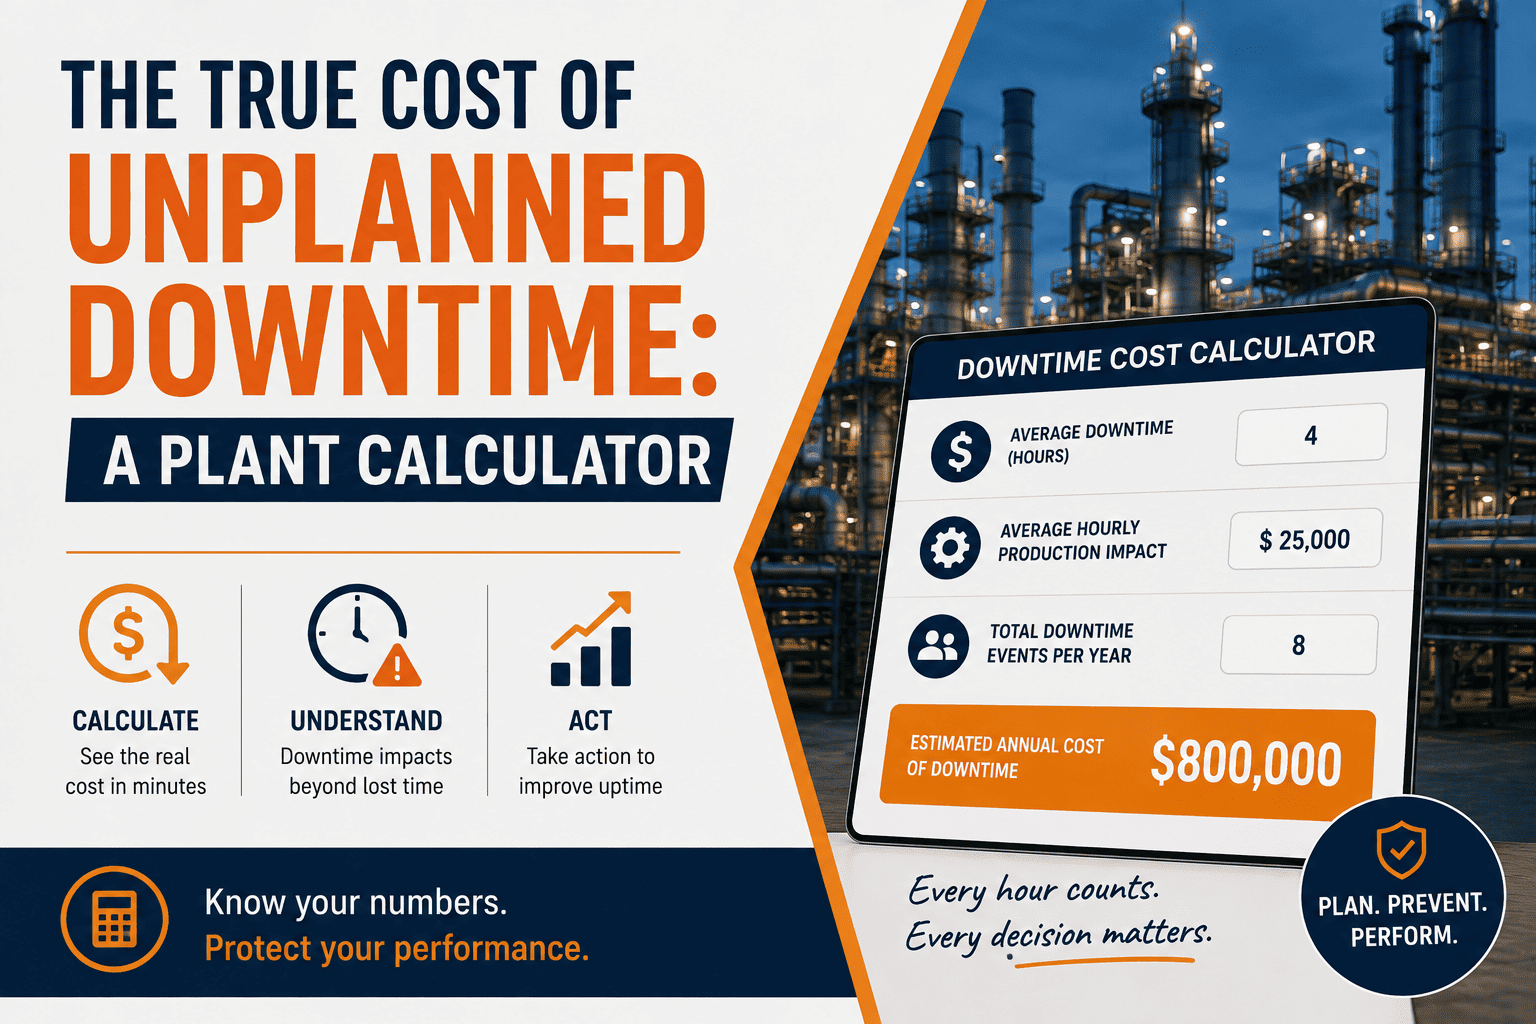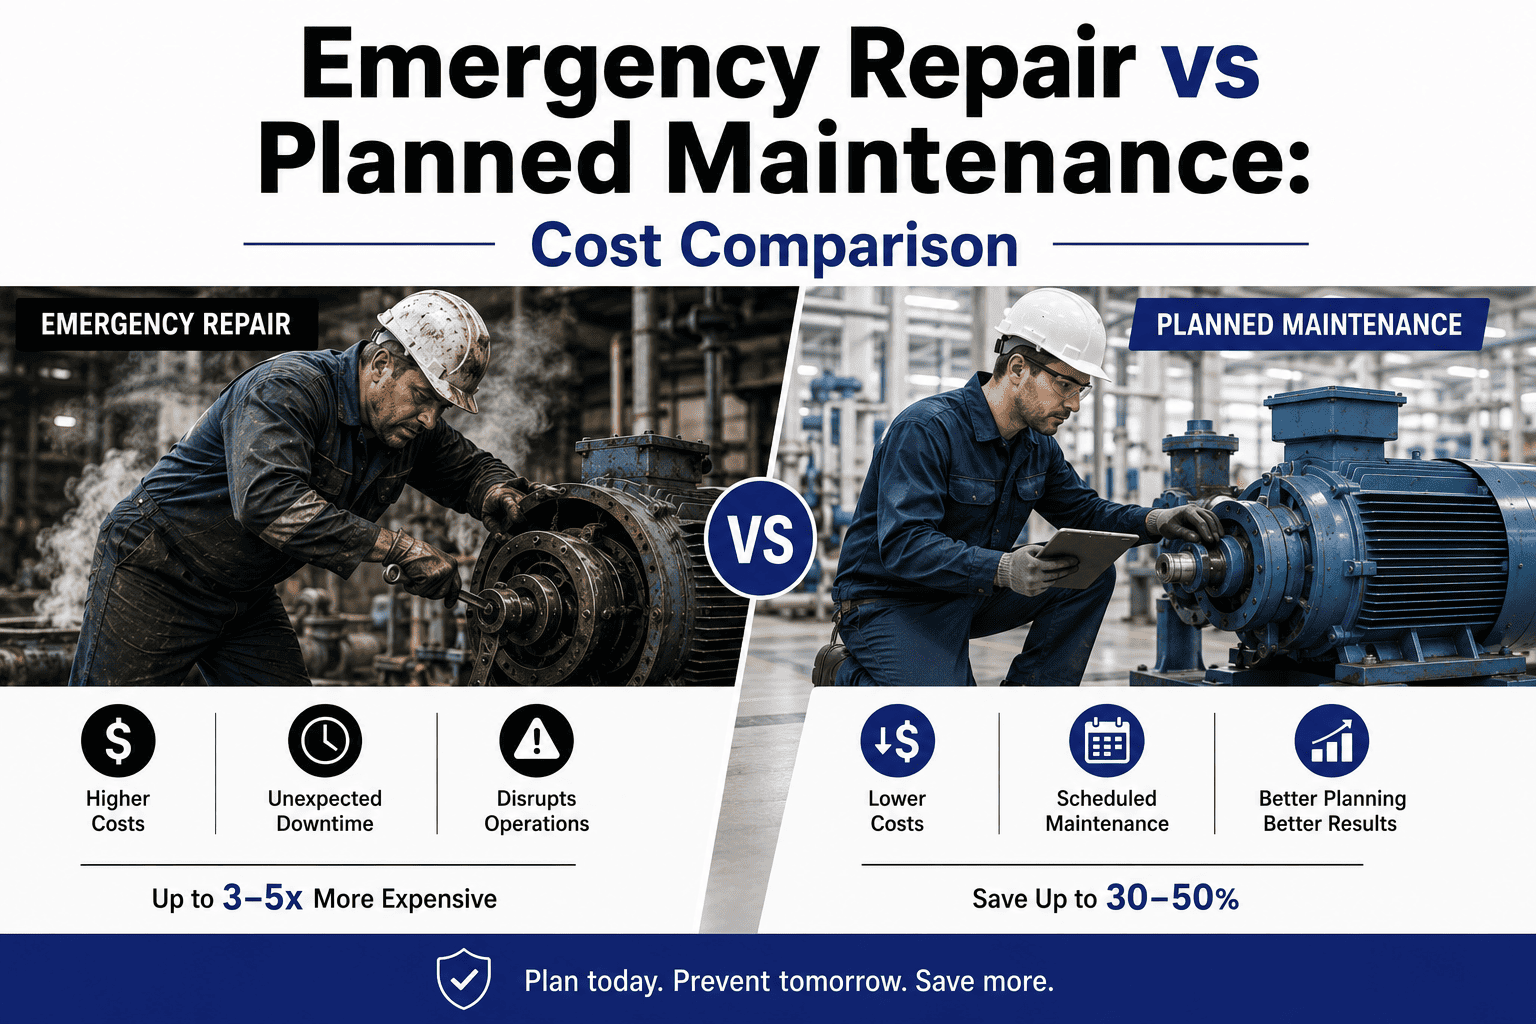
Emergency repair cost typically runs 3 to 9 times higher than planned maintenance for the identical job, making the emergency repair vs planned maintenance comparison one of the most consequential financial decisions a plant manager faces. That multiplier covers overtime labor rates, expedited parts freight, collateral equipment damage, and the cascading production loss that follows every unplanned repair. When you shift even 20% of your workload from reactive to planned maintenance, the savings on labor, spare-parts inventory, and downtime avoidance are immediate and measurable. This guide breaks down the real maintenance cost comparison — labor, parts, quality impact, safety risk — and shows how CMMS scheduling discipline and criticality-based planning using OxMaint can help your team capture those savings. Start Free Trial to see your own reactive cost gap shrink in real time.
Every $1 in planned work prevents up to $9 in emergency repair cost
Reactive maintenance doesn't just cost more in labor and parts — it drives unplanned downtime, safety incidents, and quality defects that erode margins across your entire operation. See exactly where the money leaks, and how to close the gap.
What drives emergency maintenance cost so much higher?
The emergency repair vs planned cost gap isn't a single line item — it's a stack of compounding costs that each hit harder under time pressure. Here's where the money goes on every reactive call.
Emergency repair vs planned: a real $47,200 cost gap on one pump
Consider a 75-hp centrifugal pump on a critical process line. If the bearing seizes during production, the emergency repair cost vs planned maintenance cost comparison looks like this:
| Cost Component | Emergency Repair | Planned Replacement | Difference |
|---|---|---|---|
| Mechanic labor (6 hrs) | $840 (OT + callout) | $300 (day shift) | +$540 |
| Bearing + seal kit | $620 (expedited freight) | $340 (stock) | +$280 |
| Production downtime (8 hrs) | $44,000 (at $5.5K/hr line rate) | $0 (scheduled off-cycle) | +$44,000 |
| Collateral (coupling + shaft damage) | $2,800 | $0 | +$2,800 |
| Total Job Cost | $48,260 | $640 | $47,620 saved |
How to calculate your reactive maintenance cost and planned maintenance ROI
Most plants understate their true reactive maintenance cost because they only count the invoice — not the production hours, quality scrap, and safety exposure. Use these formulas to size your own gap and project the payback of a planned maintenance program.
True Emergency Repair Cost
The downtime and collateral terms are the ones most plants omit — and they're typically 70–85% of the total.
Planned Maintenance Savings
A plant shifting 200 reactive work orders/year to planned saves $200K–$350K net, even after software and PM labor costs.
Planned Maintenance ROI
Typical CMMS-driven planned maintenance ROI in year one: 250–450%. Year two (program mature): 400–700%.
Full maintenance cost comparison: 10 dimensions
Beyond the direct dollar cost, reactive and planned maintenance differ across nearly every operational dimension that matters to a plant manager.
| Dimension | Reactive / Breakdown | Planned / Preventive |
|---|---|---|
| Direct labor cost per job | 2–3× standard rate | Standard shift rate |
| Parts cost | +40–60% expedite freight | Stock or scheduled PO |
| Production downtime | Unplanned, 4–24 hrs avg | Scheduled, 0 unplanned hrs |
| Mean time to repair (MTTR) | 6–14 hours | 2–4 hours |
| Mean time between failures | Short, unpredictable | Extended, predictable |
| Asset lifespan | Reduced 20–40% | Maximized to design life |
| Quality / scrap impact | High (process disruption) | Minimal |
| Safety incident rate | 3–5× higher | Baseline |
| Energy efficiency | Degraded (running to failure) | Maintained at spec |
| Audit / compliance readiness | Poor (no records) | Full documented history |
Stop paying the 9× emergency repair premium
See how OxMaint's AI-driven PM scheduling, criticality ranking, and spare-parts automation can move your plant from 60% reactive to 80%+ planned in one quarter — and put the savings on your P&L.
How OxMaint shifts your plant from reactive to planned maintenance
OxMaint is an AI-powered CMMS and EAM platform built to make planned maintenance the default — not the exception. Here's how four core capabilities directly cut your emergency repair cost and drive measurable ROI.
AI-Driven PM Scheduling
OxMaint auto-generates and auto-assigns preventive work orders based on asset criticality, runtime hours, condition data, and OEM intervals — so PMs happen before failures, not after. No more missed PMs buried in a spreadsheet.
Predictive Maintenance Analytics
Machine-learning models on vibration, temperature, and pressure data flag developing failures weeks before they trigger an emergency — converting reactive calls into scheduled interventions during planned downtime windows.
Spare-Parts Inventory Automation
OxMaint tracks min/max levels, auto-generates replenishment POs, and links parts to asset BOMs — so the bearing, seal, or belt you need for a PM is always in stock, eliminating the 40–60% expedite freight premium.
Mobile Work Orders + Compliance Trail
Technicians receive, complete, and sign off work orders on mobile — with photos, readings, and parts consumed captured in real time. Every PM, inspection, and repair is audit-ready for ISO 55000, OSHA, and FMCSA without paperwork.
How to shift from reactive to planned maintenance in 4 phases
You don't flip a switch — you build a planned maintenance program in deliberate phases. Here's the proven 4-phase path from 60% reactive to 80%+ planned, with realistic timelines and the cost-ratio shift at each stage.
Asset Criticality Audit (Weeks 1–4)
Import your asset register into OxMaint, rank every asset by criticality (A/B/C), and identify the top 20% of assets driving 80% of emergency repairs. These are your first PM targets.
PM Program Build-Out (Weeks 5–12)
For every A-critical asset, define PM checklists, intervals, required parts, and assigned technicians in OxMaint. Auto-schedule recurring PMs and set condition-based triggers for predictive monitoring.
Spare-Parts Optimization (Weeks 10–16)
Link BOMs to PM schedules, set min/max stock levels for critical spares, and enable auto-replenishment POs. This eliminates the "parts not available" excuse that pushes PMs back into emergency territory.
Predictive + KPI Tuning (Ongoing)
Activate OxMaint's predictive analytics on high-criticality assets, tune PM intervals using failure data, and track MTBF, MTTR, and planned-maintenance percentage on live dashboards. Iterate quarterly.
What maintenance teams save with OxMaint
"We were running 65% reactive on 220 assets. After rolling out OxMaint's PM scheduling and parts automation, we hit 78% planned in four months. Emergency repair spend dropped from $38K/month to $14K/month — that's $288K annualized."
"The predictive alerts caught a bearing failure on our main compressor three weeks before it would have seized. Scheduled the replacement during a planned shutdown — saved an estimated $92K in downtime and emergency repair cost."
Emergency repair vs planned maintenance: your questions answered
How much more does emergency maintenance cost compared to planned maintenance?
Emergency maintenance typically costs 3 to 9 times more than the same job performed on a planned schedule. The premium comes from overtime labor rates, expedited parts freight, unplanned production downtime (often $200–500K per hour), and collateral damage to connected equipment. Most plants only count the direct repair invoice and miss 70–85% of the true cost.
What is a good planned maintenance percentage to target?
World-class maintenance organizations target 80% or higher planned maintenance ratio, with less than 20% reactive. Most plants start at 40–60% reactive. Shifting to 80% planned typically cuts total maintenance budget 25–30% and reduces unplanned downtime 30–50%. You can track this KPI in real time on your OxMaint dashboard — Book a Demo to see it configured for your assets.
How long does it take to shift from reactive to planned maintenance?
A focused implementation with a CMMS like OxMaint can move a plant from 60% reactive to 80%+ planned in 3–4 months. Phase 1 is asset criticality auditing, Phase 2 builds the PM program, Phase 3 optimizes spare-parts inventory, and Phase 4 activates predictive analytics and KPI tuning. The biggest savings typically appear in months 2–3 as PMs replace emergency calls.
Does planned maintenance really have a positive ROI?
Yes — planned maintenance ROI in year one typically ranges from 250% to 450%, meaning every $1 invested in a PM program returns $2.50–$4.50 in avoided emergency repair and downtime cost. Year-two ROI often reaches 400–700% as the program matures and predictive analytics begin preventing failures before they develop. The payback period for a CMMS implementation is usually 3–6 months.
Can a CMMS really reduce emergency repair cost?
A CMMS like OxMaint reduces emergency repair cost by auto-scheduling preventive work orders, ensuring critical spare parts are in stock, flagging developing failures via predictive analytics, and creating a documented maintenance history that improves asset reliability over time. Plants typically see a 30–50% reduction in unplanned downtime within 90 days of implementation. Start Free Trial to begin measuring your own reactive cost gap.
Your next emergency repair is already developing. Catch it before it costs 9×.
Book a 30-minute demo and see OxMaint's AI-powered CMMS configured for your assets, your failure modes, and your maintenance team. We'll map your reactive-to-planned shift and project your first-year savings in real time.
Free 14-day trial · No credit card