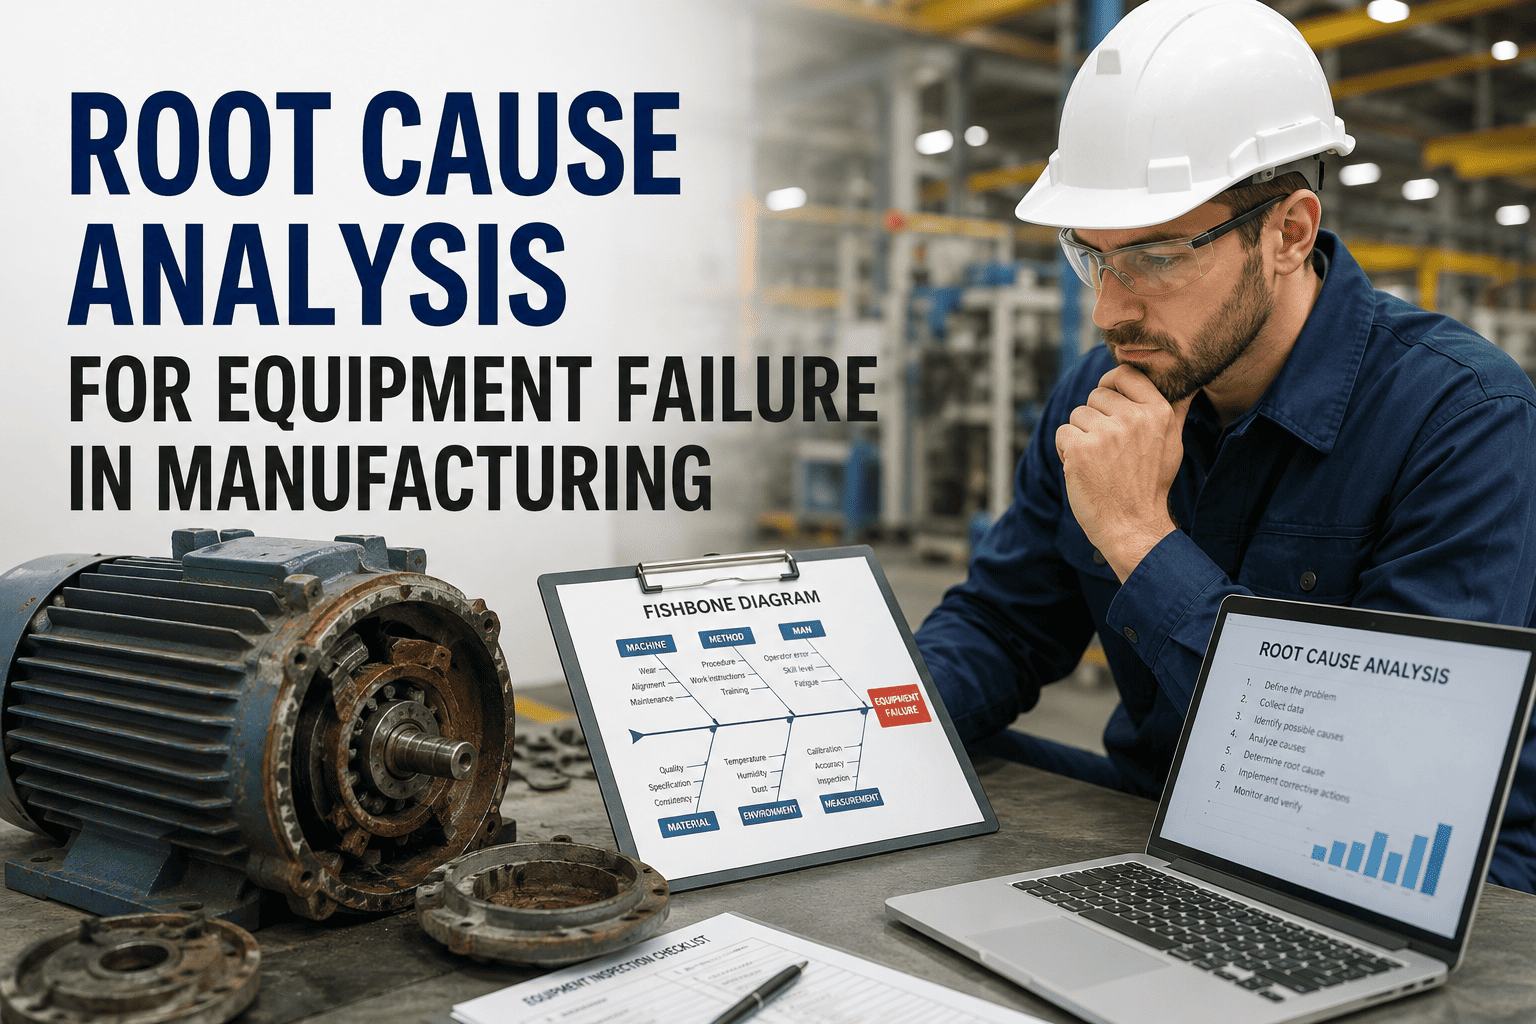
Every manufacturing plant manager knows the sinking feeling — a critical production line goes silent at the worst possible time, and the scramble begins. Equipment failures drain an average of $260,000 per hour from manufacturing operations, yet nearly 80% of these breakdowns follow patterns that structured Root Cause Analysis can detect and prevent well in advance. This guide breaks down the exact RCA methods, investigation frameworks, and failure prevention strategies that high-performing plants use to slash unplanned downtime by 40-60% and turn every breakdown into a permanent reliability win. Schedule a free consultation to see how Oxmaint helps manufacturing teams run faster, smarter failure investigations.
What Equipment Failure Really Costs Your Plant
The invoice for a broken bearing or a blown seal is just the tip of the iceberg. For every dollar spent on the actual repair, four to five dollars disappear into lost production, scrapped material, overtime labor, missed shipments, and cascading quality issues downstream. Understanding the full cost picture is the first step toward building a business case for a structured failure analysis program.
$50B+Annual cost of unplanned downtime to US manufacturers
800 hrsAverage unplanned downtime per plant each year
42%Of all downtime caused by aging equipment failures
80/20Rule — 20% of failure modes cause 80% of breakdowns
Direct repair costs — parts, labor, and contractor fees — typically represent only 20-30% of the total financial impact of a failure event. The hidden costs include production losses during downtime (often 60-70% of total impact), quality defects from restart transitions, expedited shipping to meet delayed orders, and the opportunity cost of pulling your best technicians away from planned improvement work. For critical production equipment, a single incident can exceed $250,000 when all direct and indirect costs are tallied. Sign up for Oxmaint to start capturing the true cost of every failure event and build data-driven justification for reliability investments.
Tired of watching profits drain through preventable breakdowns? Join thousands of manufacturers using Oxmaint to track failures, run RCA, and eliminate repeat breakdowns.
Not every equipment failure demands the same investigative approach. A simple valve leak and a catastrophic gearbox seizure require very different analytical tools. The key is matching the method to the failure complexity, available data, and the stakes involved. Here are the five RCA methods every manufacturing maintenance team should master.
Method 1
The 5 Whys Technique
Quick & Simple
How It Works
Start with the failure event and ask "Why did this happen?" repeatedly — typically five times — until you drill past the symptoms and reach the fundamental root cause. Each answer becomes the subject of the next "Why?" question.
When to Use It
Best for straightforward failures with a linear cause-and-effect chain. Use it for recurring minor breakdowns, single-component failures, or as a finishing tool after other methods have narrowed the field. Can be completed in 30-60 minutes.
Example: Conveyor stopped → Why? Motor overheated → Why? Bearing seized → Why? No lubrication → Why? PM schedule was missed → Why? No automated reminders in the system. Root cause: lack of CMMS-driven PM scheduling.
Method 2
Fishbone (Ishikawa) Diagram
Team Brainstorming
How It Works
Place the failure event at the "head" of a fish skeleton diagram, then map potential causes along six category "bones" — Machine, Method, Material, Manpower, Measurement, and Environment. Sub-causes branch off each category for deeper analysis.
When to Use It
Ideal when multiple potential causes exist and you need cross-functional input. Excellent for complex failures where the root cause is not immediately obvious, and you want to systematically explore every contributing factor with the team.
Key Advantage: Forces structured thinking across all six categories, preventing teams from fixating on the first obvious cause and missing deeper systemic issues.
Method 3
Failure Mode & Effects Analysis (FMEA)
Proactive Risk Assessment
How It Works
For each component, list every possible way it could fail (failure modes). Rate each mode on three scales: Severity (1-10), Occurrence likelihood (1-10), and Detection probability (1-10). Multiply to get a Risk Priority Number (RPN) that ranks which failures to address first.
When to Use It
Best used proactively — during new equipment commissioning, after process changes, or when redesigning maintenance programs. FMEA identifies risks before they become failures, making it the most powerful preventive tool in the RCA toolkit.
RPN Formula: Severity (S) x Occurrence (O) x Detection (D) = RPN. Focus corrective actions on the highest RPN scores first for maximum impact.
Method 4
Fault Tree Analysis (FTA)
Complex Systems
How It Works
Start with the top-level failure event and work downward using Boolean logic gates (AND/OR) to map how combinations of lower-level events lead to the failure. AND gates mean all sub-events must occur; OR gates mean any single sub-event is sufficient.
When to Use It
Reserved for high-consequence failures involving complex system interactions, safety-critical equipment, or incidents where multiple conditions combined to cause the failure. Requires more time and expertise but provides the deepest understanding of systemic vulnerabilities.
Key Advantage: Reveals how individually "acceptable" risks combine to create unacceptable outcomes — exposing hidden dependencies that other methods miss.
Method 5
Pareto Analysis (80/20 Prioritization)
Data-Driven Focus
How It Works
Pull failure data from your CMMS and rank all failure types by frequency, cost, or downtime impact. Plot them on a bar chart with a cumulative percentage line. The vital few failure modes — typically 20% of the total — will account for roughly 80% of your losses.
When to Use It
Use as a starting point before any deep-dive investigation. Pareto tells you where to invest your limited RCA resources for maximum return. It is also the best tool for identifying "bad actor" equipment that repeatedly drains your maintenance budget.
Pro Tip: Run a Pareto analysis quarterly. As you fix the top failure modes, new ones will rise to the top — creating a continuous improvement cycle.
From Breakdown to Breakthrough: The RCA Investigation Workflow
A failure just occurred. The clock is ticking. What do you do first? Following a structured six-phase investigation process ensures that your team captures the right evidence, asks the right questions, and produces corrective actions that actually stick — instead of the same breakdown showing up again next quarter.
1
Secure the Evidence (First 30 Minutes)
Document everything before any repairs begin. Photograph damaged components, save alarm and PLC logs, record operating parameters at time of failure, and capture witness statements from operators. The first half hour contains 80% of your investigative evidence — once repairs start, critical clues are lost forever.
2
Build the Right Team
Assemble a cross-functional group: the operator who witnessed the failure, the technician who knows the equipment, a process engineer, and a reliability lead. Different perspectives catch different clues. Operators notice behavioral changes that engineers miss; engineers see design flaws that operators overlook.
3
Write a Sharp Problem Statement
Define exactly what failed, when, where, and the measured impact. Good example: "CNC lathe #7 spindle bearing collapsed at 02:15 on Feb 3, causing 8.5 hours of unplanned downtime, $72,000 in lost production, and 2 scrapped workpieces." Bad example: "The lathe broke." Specificity drives effective analysis.
4
Analyze with the Right RCA Tools
Select the RCA method matching the failure complexity. Use 5 Whys for clear linear causation, Fishbone for multi-factor exploration, FMEA for risk-based assessment. Always go beyond the physical cause — ask why the system allowed it to happen. Was the PM missed? Was the part spec wrong? Was training inadequate?
5
Define SMART Corrective Actions
Every corrective action must be Specific, Measurable, Achievable, Relevant, and Time-bound with a named owner. Replace "train technicians better" with "By April 15, deliver a 4-hour vibration analysis course to all 8 mechanical technicians, with a practical exam requiring 90% pass rate, tracked in the CMMS."
6
Verify, Standardize, Share
Track MTBF (Mean Time Between Failures) to confirm the fix works. If successful, update PM procedures, SOPs, and training materials across the plant. Share findings with other shifts and facilities — one RCA done well can prevent dozens of similar failures elsewhere. Sign up for Oxmaint to automate this entire close-the-loop process.
Want to see this workflow running live inside a CMMS? Book a personalized demo and we will walk through a real failure investigation using Oxmaint.
Understanding the most common failure categories helps your team focus investigation efforts where they will deliver the biggest payoff. Industry data consistently shows that a handful of root cause categories account for the vast majority of manufacturing equipment failures.
42%
Aging & Wear-Out
Gradual degradation of components past their useful life. Look for increasing vibration trends, rising operating temperatures, and declining output quality as leading indicators.
RCA Approach: FMEA + Condition monitoring review
21%
Mechanical Failure
Sudden breakdowns — bearing seizures, shaft fractures, seal blowouts, gearbox failures. Often the result of missed warning signs from the aging category above.
RCA Approach: 5 Whys + Physical evidence analysis
11%
Human & Operator Error
Incorrect machine settings, skipped startup procedures, overloading, or improper material handling. Usually points to training gaps, unclear SOPs, or fatigue-related mistakes.
RCA Approach: Fishbone diagram (Manpower focus)
~10%
Lubrication Failures
Wrong lubricant type, contaminated oil, missed lubrication schedules, or over/under-greasing. One of the most preventable failure categories with proper PM discipline.
RCA Approach: 5 Whys + Lubrication audit
~9%
Electrical & Controls
Voltage fluctuations, sensor drift, PLC faults, wiring degradation, and VFD failures. Intermittent faults in this category are notoriously difficult to diagnose without proper data logging.
RCA Approach: Fault Tree Analysis + Electrical testing
~7%
Design & Installation Defects
Equipment installed without proper alignment, undersized for the application, or designed with inherent weaknesses. Failures repeat despite good maintenance because the root issue is engineering-level.
RCA Approach: FMEA + Design review
Firefighting vs. Failure-Proofing: A Side-by-Side Reality Check
Most maintenance teams know they should be doing RCA, but daily urgencies keep pulling them back into reactive mode. Here is a clear-eyed comparison of what each approach actually delivers over 12 months — and what it costs you to stay in firefighting mode.
Maintenance Dimension
Reactive Repair
Systematic RCA
When Failures Repeat
Same breakdowns return every 3-6 months
Root causes eliminated — failures do not recur
Institutional Knowledge
Tribal knowledge trapped in individual heads
Captured in CMMS — accessible to entire team
Parts & Procurement
Emergency parts cost 3-5x normal pricing
Planned repairs at standard parts pricing
Team Culture
Morale drops from constant firefighting
Team evolves into reliability engineers
Investment Justification
No data to justify reliability spending
Clear ROI data drives continuous improvement
Stop Fixing the Same Equipment Twice
Oxmaint gives your maintenance team structured RCA workflows, automated corrective action tracking, and a searchable failure knowledge base — so every breakdown becomes the last of its kind.
While the principles of RCA are universal, the specific equipment, failure modes, and investigation priorities vary significantly between industries. Here is how failure analysis delivers results across six major manufacturing sectors.
A failure analysis program that cannot demonstrate measurable results will eventually lose management support and budget. These are the four metrics that the most successful RCA programs track to prove their value and justify continued investment in reliability improvement.
70%
Repeat Failure Elimination
Percentage of investigated failures that do not recur within 12 months after corrective actions
3-5x
Return on Investment
Typical ROI from reduced downtime, lower emergency spend, and extended equipment service life
50%
Emergency Spend Reduction
Drop in emergency maintenance costs as failures shift from unplanned crises to planned interventions
35%
MTBF Improvement
Increase in Mean Time Between Failures as root causes are systematically identified and eliminated
Start measuring your reliability improvements today. Create a free Oxmaint account to get instant dashboards showing MTBF trends, failure patterns, and corrective action completion rates.
Why a CMMS Is the Engine Behind Every Great RCA Program
Root Cause Analysis is only as strong as the data feeding it and the follow-through after it. Without a centralized system to capture failure details, track corrective actions, and surface recurring patterns, even the best investigation will eventually be forgotten in a filing cabinet. Here is how a modern CMMS transforms RCA from an occasional exercise into a continuous reliability engine.
Complete Failure History
Every breakdown, part replacement, and repair is automatically logged with timestamps, cost data, and technician notes — building a rich historical database that powers pattern recognition and trend analysis.
Bad Actor Identification
Automatic identification of repeat offenders — the 20% of equipment causing 80% of your headaches. CMMS analytics surface chronic failures, rising cost trends, and declining MTBF scores so you know exactly where to investigate next.
Corrective Action Tracking
Assign owners, set deadlines, and track every RCA-driven corrective action to completion. Automated reminders and escalation workflows ensure no finding is forgotten and no fix is left half-done.
Evidence-Based PM Scheduling
Use real failure data — not manufacturer guesses — to set preventive maintenance intervals. Adjust PM frequencies based on actual failure modes, operating conditions, and equipment age to maximize uptime without over-maintaining.
The difference between a maintenance team that fights fires and one that prevents them comes down to one thing: whether they treat every failure as a learning opportunity or just another repair ticket. A CMMS with built-in RCA workflows is what makes that shift possible at scale.
— Plant Reliability Engineering Manager
Make Every Breakdown the Last of Its Kind
Your spreadsheets cannot track failure patterns across hundreds of assets, ensure corrective actions are completed on time, or surface the hidden "bad actors" draining your maintenance budget. Oxmaint gives you structured investigation workflows, automated follow-through, and real-time reliability dashboards — turning equipment failure analysis from paperwork into a profit center.
What is root cause analysis in manufacturing equipment maintenance?
Root cause analysis (RCA) is a systematic investigation method used to identify the fundamental reasons behind equipment failures — not just the immediate symptom. In manufacturing, RCA typically involves collecting failure evidence, assembling a cross-functional team, and applying structured tools like 5 Whys, Fishbone Diagrams, or FMEA to trace the failure back to its true origin and develop corrective actions that prevent recurrence. Book a demo to see how Oxmaint streamlines this entire process for manufacturing teams.
Which RCA method should I use for my equipment failure?
It depends on complexity. Use 5 Whys for simple, single-cause breakdowns that need quick resolution (30-60 minutes). Fishbone Diagrams work best when multiple potential causes require cross-functional brainstorming. FMEA is ideal for proactive risk assessment on new or modified equipment. Fault Tree Analysis handles complex system failures with multiple interacting components. Most mature programs combine several methods depending on the situation and use Pareto Analysis first to decide which failures to investigate.
How long does a typical RCA investigation take?
A straightforward 5 Whys analysis takes 30-60 minutes. A full Fishbone or FMEA investigation typically requires 2-4 hours of team time across 1-2 sessions. Complex Fault Tree Analysis for critical or safety-related failures may require a week or more of investigation, testing, and verification. The key principle is matching the depth of your analysis to the severity and cost of the failure — not every breakdown warrants a full investigation.
How does a CMMS help with equipment failure analysis?
A CMMS like Oxmaint captures the complete failure history for every asset — symptoms, causes, repairs performed, parts consumed, downtime duration, and cost. This data is essential for identifying failure patterns, surfacing repeat offenders, and validating whether corrective actions are working. The system also automates corrective action tracking, adjusts PM schedules based on real failure data, and provides dashboards showing reliability trends over time. Sign up for free to start building your equipment failure knowledge base today.
What ROI can we expect from a structured RCA program?
Plants with mature RCA programs typically see 3-5x return on investment through 40-60% reduction in unplanned downtime, up to 50% lower emergency maintenance spending, 25-35% longer equipment service life, and fewer safety incidents. Most facilities see measurable results within the first 90 days, with full payback within 6-12 months. The key is consistency — running RCA on every significant failure and rigorously following through on corrective actions.