
Mean time between failures (MTBF) is the clearest reliability signal a manufacturing plant can track — it tells you, in hard numbers, how long your critical assets run before breaking down. To improve MTBF, maintenance and reliability teams need disciplined failure-code capture, rigorous bad-actor analysis, precision maintenance practices, and the right CMMS reports to verify that reliability improvement projects are actually moving the needle. Plants that systematically increase MTBF typically cut unplanned downtime by 25–40% and slash emergency work-order costs in half. This guide walks through the MTBF calculation, the levers that drive equipment MTBF upward, and how an AI-powered CMMS like OxMaint makes reliability MTBF tracking automatic — so you can see results in weeks, not years. Ready to stop reacting and start improving? Start Free Trial and see your asset MTBF data come alive.
RELIABILITY GUIDE
Is your MTBF stuck while unplanned downtime keeps climbing?
Most manufacturing plants track mean time between failures — but few have the failure-code discipline, bad-actor visibility, and CMMS reporting to actually improve it. OxMaint turns raw work-order data into a clear MTBF improvement roadmap.
TYPICAL MTBF GAIN
35%
Average increase in equipment MTBF within 6 months when plants adopt disciplined failure tracking + predictive maintenance in a modern CMMS.
MTBF FUNDAMENTALS
What is MTBF and how do you calculate it for manufacturing equipment?
Mean time between failures is the average operating hours a repairable asset runs before its next unplanned failure. It is the single most telling reliability metric for manufacturing because it distills hundreds of work-order data points into one number you can trend month over month. The MTBF calculation is straightforward — total operating time divided by the number of unplanned failures in that period — but the discipline behind accurate inputs is where most plants fall short.
MTBF FORMULA
MTBF = Total Operating Hours ÷ Number of Unplanned Failures
Worked example — hydraulic press line
A critical press runs 6,800 hours in a quarter and logs 4 unplanned failures (seal leak, valve stick, motor overheat, sensor fault). MTBF = 6,800 ÷ 4 = 1,700 hours. If a reliability improvement project pushes that to 2,600 hours the next quarter, you have concrete evidence the initiative worked — not just a gut feeling.
2.5×
Higher maintenance cost on assets with MTBF in the bottom quartile vs. top quartile
40%
Of unplanned failures stem from a small group of bad-actor assets — usually under 15% of inventory
$50B
Annual U.S. manufacturing downtime cost — much of it preventable through MTBF improvement
STEP-BY-STEP FRAMEWORK
How to improve MTBF: a 5-step reliability improvement roadmap
MTBF improvement is not a single project — it is a repeatable cycle of measuring, analyzing, fixing, and verifying. The timeline below maps the five phases most plants move through over a 6-month reliability push. Each phase has a clear deliverable and a CMMS report that confirms progress.
MONTH 1
Lock down failure-code discipline
Standardize a failure-mode code set (ISO 14224-aligned) and make it mandatory on every unplanned work order. Without consistent failure codes, MTBF analysis is guesswork — you cannot fix what you cannot categorize. Plants that enforce failure coding see 60% cleaner reliability data within 4 weeks.
MONTH 2
Run a bad-actor analysis
Rank assets by failure frequency and downtime cost. The Pareto rule holds: roughly 15% of equipment drives 40–50% of unplanned events. Focus your MTBF improvement effort on these bad actors first — one resolved recurring failure can lift plant-wide MTBF by double digits.
MONTH 3
Conduct RCM-lite reviews on top offenders
For each bad actor, gather 12 months of failure history, FMEA data, and OEM recommendations. Decide for each failure mode: predictive task, preventive task, run-to-failure, or redesign. RCM-lite avoids the months-long slog of full RCM while delivering 80% of the benefit in 20% of the time.
MONTH 4
Deploy precision maintenance practices
Train technicians on precision alignment, balancing, torque procedures, and contamination control. Studies show 50–60% of premature bearing failures trace to misalignment or lubrication errors. Standard work checklists in your CMMS ensure precision practices are followed on every PM.
MONTHS 5–6
Verify with MTBF tracking and trend reports
Pull MTBF-by-asset and MTBF-by-failure-mode reports from your CMMS each month. Compare the trend line before and after each intervention. If equipment MTBF is not moving, the fix did not work — go back to the RCM-lite review and adjust. What gets measured gets improved.
BAD-ACTOR DEEP DIVE
Why bad-actor analysis drives 80% of your MTBF gains
A mid-size manufacturing plant with 180 critical assets was spending $42,000 annually on emergency repairs — and 70% of that cost came from just 22 machines. By running a bad-actor analysis in their CMMS, the reliability team identified three recurring failure modes: seal degradation on centrifugal pumps, bearing failure on conveyor motors, and overheating on hydraulic power units. Targeted predictive maintenance (vibration analysis and thermal imaging) on those 22 assets alone lifted plant-wide MTBF by 28% in five months and cut emergency repair spend by $18,000.
| Approach | Failure Data Quality | MTBF Visibility | Time to First Gain | Downtime Reduction |
|---|---|---|---|---|
| Reactive / spreadsheet tracking | Inconsistent, missing codes | Manual, lagging | 6–12 months | 0–5% |
| Basic CMMS (work orders only) | Moderate, often incomplete | Monthly, manual export | 3–6 months | 10–15% |
| OxMaint AI-powered CMMS | Enforced, ISO 14224-aligned | Real-time dashboards | 4–8 weeks | 25–40% |
PLATFORM CAPABILITIES
How OxMaint helps you increase MTBF — automatically
OxMaint is built for maintenance and reliability teams that need to move beyond reactive maintenance and spreadsheet tracking. The platform connects work-order data, asset history, condition monitoring, and spare-parts inventory — so MTBF improvement is driven by real data, not guesswork. Here is how OxMaint maps directly to the MTBF improvement levers in this guide.
Enforced failure-code capture
Every unplanned work order in OxMaint requires an ISO 14224-aligned failure mode before closure — no exceptions. The result: 60% cleaner reliability data within 4 weeks and MTBF analysis you can actually trust.
Real-time MTBF dashboards
OxMaint automatically calculates asset MTBF, failure frequency, and downtime cost — updated in real time as work orders close. No more manual spreadsheet exports. Spot bad actors in seconds and trend reliability month over month.
Predictive maintenance alerts
AI-driven condition monitoring (vibration, thermal, oil analysis) flags developing failures before they become unplanned downtime. Plants using OxMaint predictive alerts cut emergency work orders by 30–50% and extend equipment MTBF by weeks per asset.
PM optimization and standard work
Attach precision-maintenance checklists to every preventive work order. OxMaint tracks PM compliance and correlates it with MTBF trends — so you can see which PM strategies are actually improving equipment reliability and which are wasted effort.
SEE IT ON YOUR ASSETS
Book a 30-minute demo and see your MTBF improvement roadmap
Walk through OxMaint with a reliability expert. We will load a sample of your asset data, show you the bad-actor report, and map the exact steps to lift equipment MTBF in your plant — no commitment, just clarity.
FREQUENTLY ASKED QUESTIONS
MTBF improvement: what reliability teams ask most
What is a good MTBF for manufacturing equipment?
A "good" MTBF depends on asset type, duty cycle, and criticality, but most manufacturing plants target 2,000–8,000 operating hours for critical repairable equipment. The more important benchmark is your own trend — if asset MTBF is rising month over month, your reliability program is working. OxMaint automatically benchmarks each asset against its historical baseline so you always know whether you are improving.
How is MTBF different from MTTR?
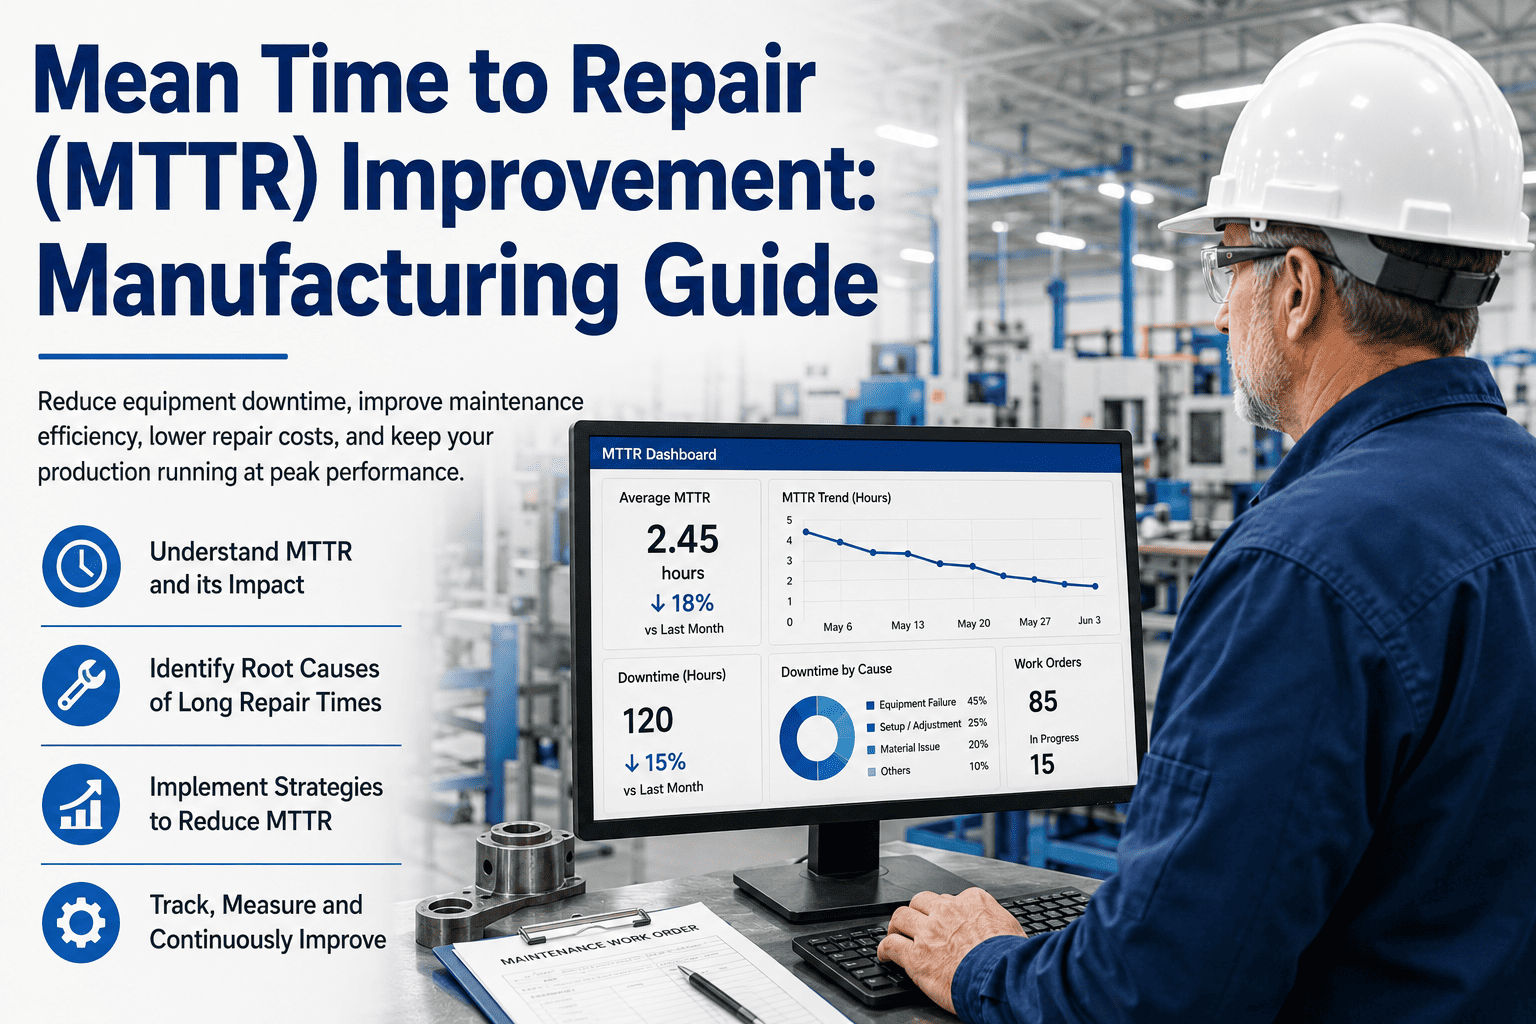
MTBF (mean time between failures) measures how long an asset runs before failing — it reflects reliability. MTTR (mean time to repair) measures how quickly you fix it after failure — it reflects maintainability. Together they form availability: Availability = MTBF ÷ (MTBF + MTTR). Improving MTBF reduces how often you break down; improving MTTR reduces how long you stay down. Start Free Trial to track both metrics automatically.
How long does it take to see MTBF improvement?
With disciplined failure coding and a focused bad-actor analysis, most plants see measurable MTBF gains within 4–8 weeks. The largest improvements come from resolving recurring failure modes on a small group of problem assets. Full plant-wide MTBF culture change typically takes 6–12 months, but the first wins should appear within the first quarter.
Can a CMMS actually improve MTBF or just track it?
A CMMS improves MTBF by enforcing the behaviors that drive reliability — consistent failure coding, PM compliance, predictive alerts, and data-driven RCM reviews. Tracking alone does not improve MTBF; acting on the data does. OxMaint goes beyond tracking by using AI to surface bad actors, predict failures, and recommend the right maintenance strategy for each asset. Book a Demo to see the difference.
What data do I need to start calculating MTBF?
You need three data points per asset: total operating hours in the period, count of unplanned failures, and failure dates. If your current system captures work-order completion dates and failure flags, you can begin MTBF calculation immediately. OxMaint imports existing work-order history from spreadsheets or legacy CMMS platforms, so you can start trending MTBF from day one — no greenfield data collection required.
START IMPROVING MTBF TODAY
Turn failure data into reliability gains with OxMaint
Join the manufacturing plants using OxMaint to increase MTBF, cut unplanned downtime, and prove reliability ROI with real data. Set up your assets, import work-order history, and see your first MTBF dashboard in under an hour.
Free 14-day trial · No credit card

-formula,-benchmarks-&-improvement-tips.png)