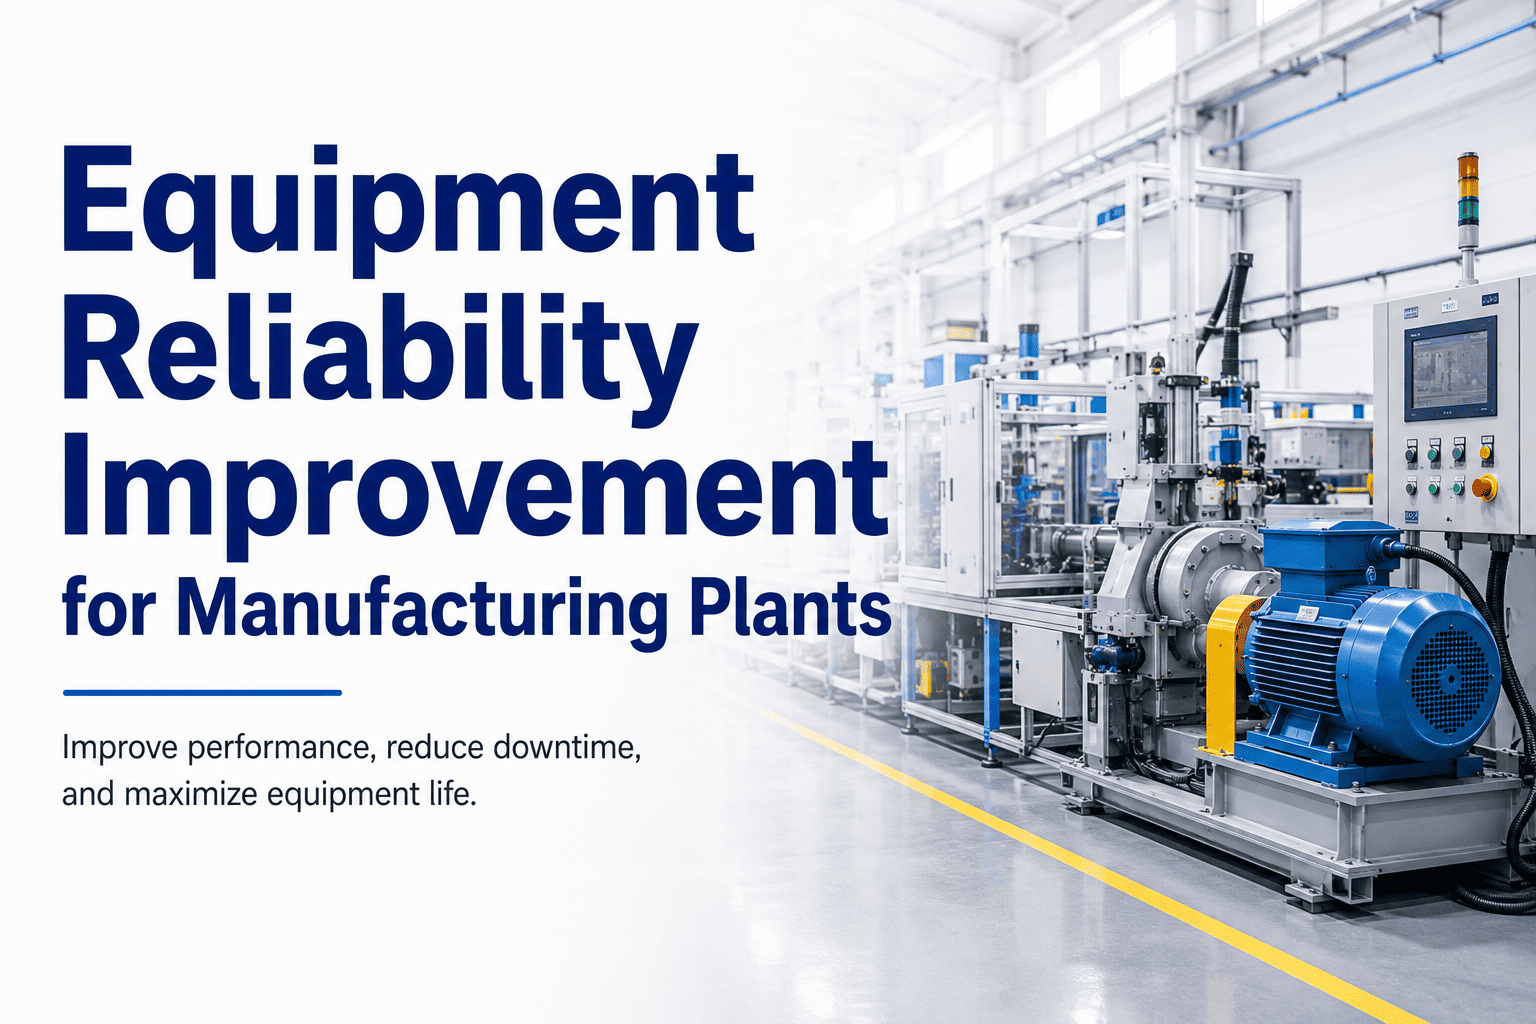
Equipment reliability improvement is the discipline that separates plants running at 85% OEE from those stuck in the 50s — it's a repeating loop of failure analysis, redesign, PM adjustment, and precision maintenance, not a one-time project. Top-performing manufacturing plants follow a predictable framework: bad actor analysis to find the 20% of assets causing 80% of downtime, defect elimination at the source, RCM-light decision logic for critical systems, and CMMS-driven MTBF trend monitoring that proves the program is actually working. When you run this loop correctly, a 180-asset plant can cut unplanned downtime by 30–45% within 12 months and recover hundreds of thousands of dollars in lost production. The framework below walks through each stage with real numbers, worked examples, and the exact metrics to track — then you can Start Free Trial to put it into practice.
PLANT RELIABILITY FRAMEWORK
Is your equipment reliability program actually reducing downtime — or just documenting it?
The best manufacturing plants don't chase every failure. They run a tight loop — analyze, redesign, adjust PMs, execute precision maintenance — and let CMMS MTBF trends prove the gain. This guide gives you that exact loop, with benchmarks, formulas, and a worked example for a 180-asset plant.
45%
Reduction in unplanned downtime within 12 months when the full reliability loop is executed
STAGE 01 — IDENTIFY
Bad Actor Analysis: Finding the 20% Driving 80% of Downtime
In a typical manufacturing plant, roughly 20% of assets generate 80% of unplanned downtime and maintenance cost. Reliability improvement starts by identifying those bad actors with CMMS data — not opinion.
20%
ASSETS CAUSING
80% OF DOWNTIME
5
BAD ACTORS IN A
180-ASSET PLANT
$42K
ANNUAL LOSS FROM
TYPICAL BAD ACTOR
STEP 1
Pull 12 months of CMMS failure data
Export work orders tagged as "breakdown" or "unplanned." Rank assets by total downtime hours and total repair cost. The top 10–15 entries are your initial bad-actor list — typically 5 to 10 assets in a mid-sized plant.
STEP 2
Calculate MTBF and failure frequency for each
For each bad actor, divide operating hours by number of failures. An MTBF under 90 days on a critical asset is a red flag. Compare against manufacturer benchmarks — if you're at 30% of rated MTBF, there's a fixable root cause.
STEP 3
Prioritize by production impact and repair cost
Rank by (downtime hours × production rate per hour) + repair cost. A pump failing monthly that blocks a $4K/hour line jumps ahead of a fan failing weekly on a non-critical cooling loop.
STAGE 02 — ELIMINATE
Defect Elimination at the Source
Defect elimination asks "why did this fail?" — then changes the design, procedure, or spec so it can't fail the same way again. Plants that eliminate 70% of recurring defects see MTBF double within 9 months.
Root Cause Failure Analysis
Use 5-Whys or fishbone on every recurring failure. Document the physical, human, and latent root causes — then assign a corrective action with an owner and due date in the CMMS.
Component Upgrade Program
When the same bearing, seal, or sensor fails repeatedly, upgrade the spec — not just the part. Switching to a higher-rated bearing or a mechanical seal with a different face material often eliminates the failure mode entirely.
Lubrication Improvement
Up to 40% of premature bearing failures trace to lubrication issues — wrong grease, over/under-greasing, or contamination. Define lube routes, use color-coded tags, and sample oil quarterly on critical assets.
Precision Maintenance Standards
Laser alignment, laser shaft alignment within 0.05mm, dynamic balancing to ISO 1940 G2.5, and torque-to-spec bolting. Imprecise reassembly reintroduces the same failure mode you just fixed.
"
A 180-asset food processing plant spending $42K/yr on repeat seal replacements invested $8K in upgraded mechanical seals and laser alignment training. Within 9 months, seal failures dropped 70%, recovering $31K/yr — a 3.1-month payback.
— Worked example based on typical mid-sized plant benchmarks
STAGE 03 — OPTIMIZE
RCM-Light: Right Maintenance for the Right Failure Mode
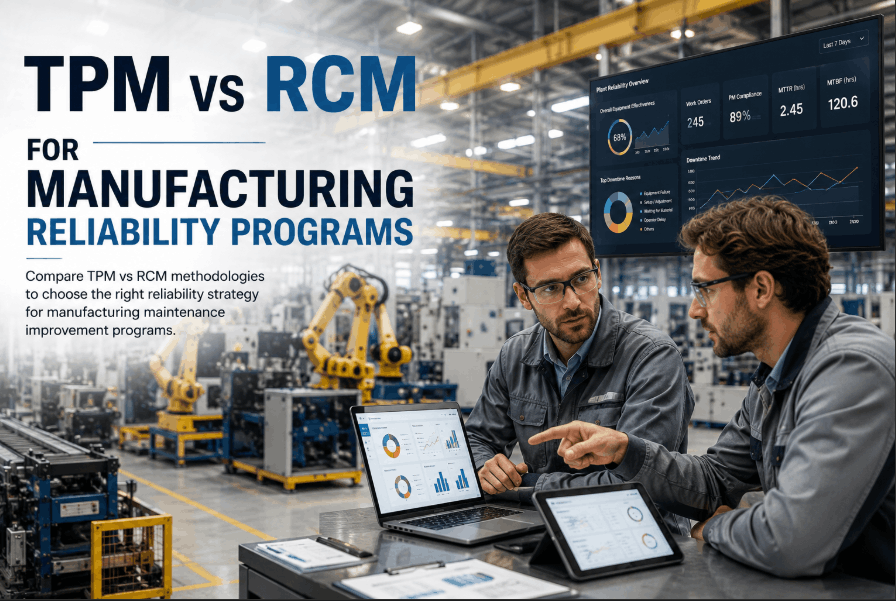
Full RCM is rigorous but slow. RCM-light applies the same logic — failure modes, consequences, task selection — to critical assets only, and delivers 80% of the benefit in 20% of the time.
| Failure Mode Pattern | Maintenance Strategy | Typical Task Interval | Detection Method |
| Wear-out (bearings, couplings) |
Time-based PM |
3–6 months |
Vibration trend |
| Random failure (electronics) |
Run-to-failure / redundancy |
On failure |
Visual / alarm |
| Degradation (seals, filters) |
Condition-based |
Continuous / monthly |
Oil analysis, DP gauge |
| Fatigue (shafts, welds) |
Inspection-based NDT |
12–24 months |
Ultrasonic, dye penetrant |
| Contamination (lubricants) |
Lubrication PM |
Quarterly sampling |
Oil sample lab report |
STAGE 04 — MONITOR
CMMS Metrics That Prove Reliability Is Improving
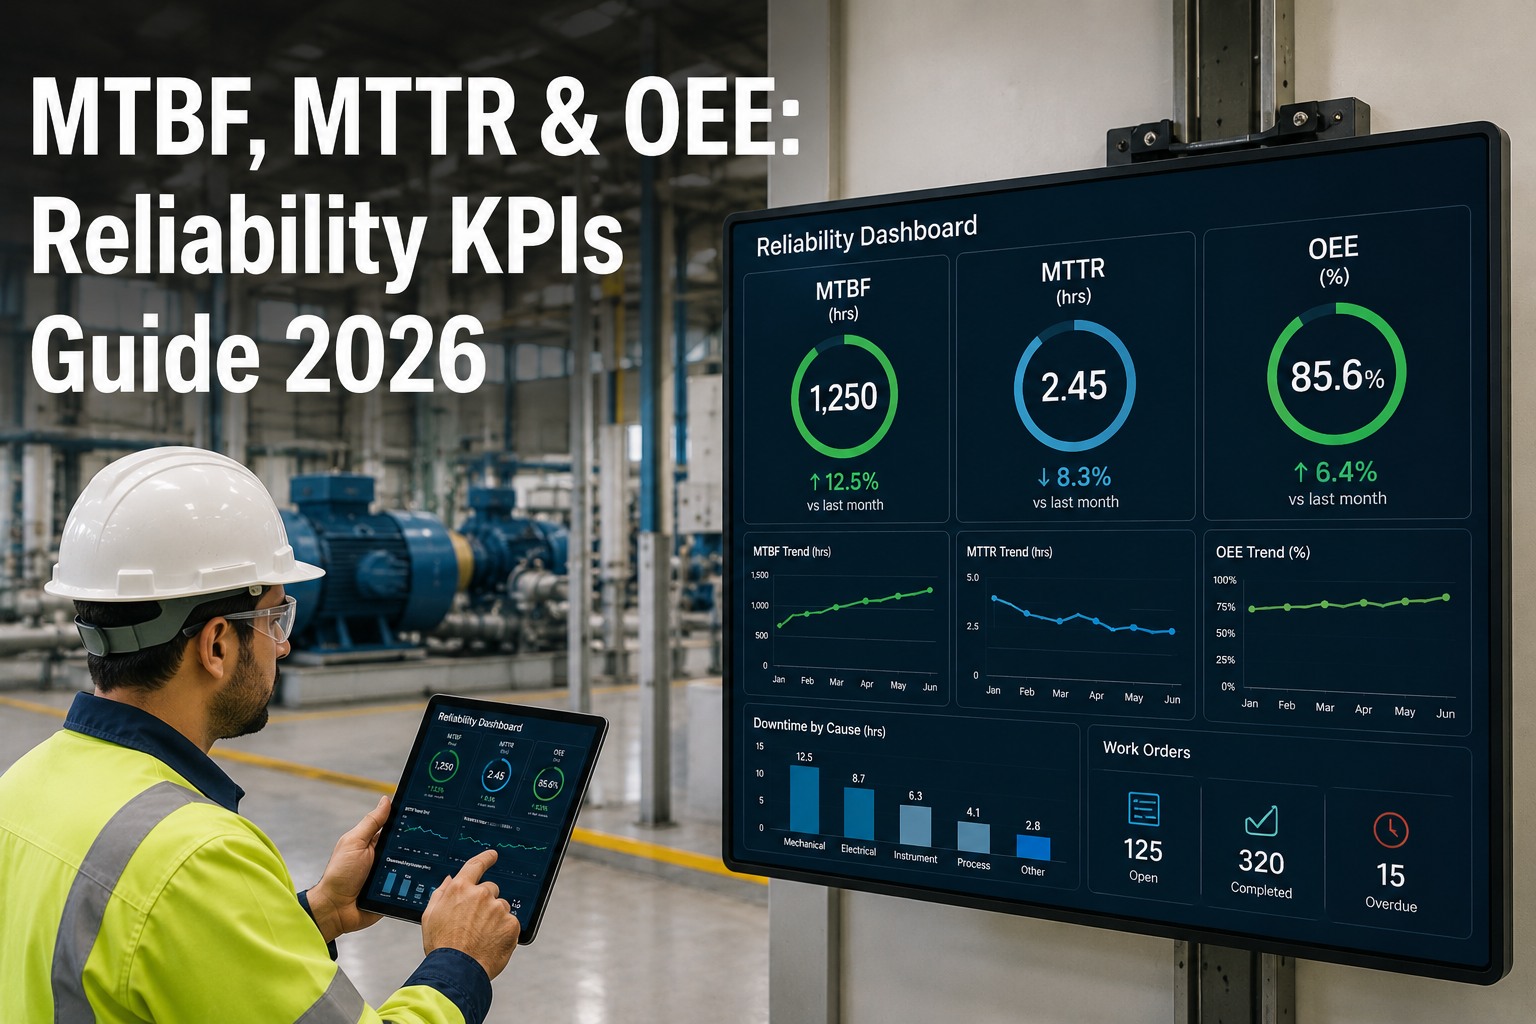
If MTBF isn't trending up month over month, your reliability program isn't working — regardless of how many PMs you completed. Track these four metrics in the CMMS and review them monthly.
MONTH 1–2
Baseline MTBF & PM Compliance
Establish current MTBF for top 10 bad actors. Set PM compliance target at 95%+. If compliance is under 80%, fix scheduling before optimizing tasks.
MONTH 3–4
Defect Elimination Sprints
Complete RCA on top 5 recurring failures. Implement corrective actions — component upgrades, lubrication changes, alignment standards. Expect first MTBF gains here.
MONTH 5–8
PM Optimization & Condition Monitoring
Convert time-based PMs to condition-based where failure is progressive. Add vibration and oil analysis routes. MTBF should climb 20–30% above baseline.
MONTH 9–12
Sustained Improvement & Expansion
MTBF up 35–45%, unplanned downtime down 30–45%. Expand RCM-light to next tier of assets. Annualize savings and reinvest in training and predictive tools.
MTBF
Primary reliability indicator — trending up = program working
MTTR
Mean time to repair — trending down = better spares & skills
PM%
Share of maintenance hours that are planned — target 80%+
OEE
Overall equipment effectiveness — reliability's bottom-line metric
REAL-WORLD IMPACT
What a Completed Reliability Loop Delivers
The numbers below are typical ranges for a mid-sized manufacturing plant (150–250 assets) that executes the full loop over 12 months — bad actor analysis through CMMS MTBF monitoring.
BEFORE RELIABILITY PROGRAM
MTBF on critical assets: 45–60 days
Unplanned downtime: 12–18% of available hours
Planned maintenance share: 50–55%
OEE: 52–61%
Repeat failures: common, undocumented root cause
Annual maintenance spend: $480K–$620K
AFTER 12-MONTH PROGRAM
MTBF on critical assets: 95–140 days
Unplanned downtime: 6–9% of available hours
Planned maintenance share: 80–85%
OEE: 74–82%
Repeat failures: rare, RCA on every event
Annual maintenance spend: $340K–$410K
Turn your CMMS data into a reliability improvement engine
Oxmaint gives you bad-actor dashboards, MTBF trend tracking, PM optimization workflows, and defect-elimination tracking in one platform — built for manufacturing plants.
FAQ
Equipment Reliability Improvement — Common Questions
How long does it take to see measurable reliability improvement?
Most plants see the first MTBF gains in months 3–4 after completing initial defect-elimination sprints on top bad actors. Sustained 30–45% downtime reduction typically takes 9–12 months of disciplined execution across all four stages — analyze, eliminate, optimize, and monitor.
What's the difference between RCM and RCM-light?
Full RCM analyzes every failure mode on every asset with a cross-functional team — thorough but slow and expensive. RCM-light applies the same failure-mode logic only to critical assets (typically the top 15–20% by risk), delivering roughly 80% of the benefit in 20% of the time and cost.
Which CMMS metrics should I track first for reliability?
Start with MTBF and PM compliance for your top 10 bad actors — these two tell you whether failures are decreasing and whether planned work is actually getting done. Add MTTR, planned-maintenance percentage, and OEE as the program matures. You can set up these dashboards in minutes when you
Start Free Trial on Oxmaint.
How much should we spend on component upgrades vs. preventive maintenance?
A practical rule: if a component fails more than twice in 12 months and the failure mode is age or wear-related, upgrade the spec rather than increasing PM frequency. Upgraded bearings, seals, and sensors typically cost 20–40% more but eliminate the failure mode, paying back in 3–6 months on critical assets.
Can a small plant with limited maintenance staff run this program?
Yes — the framework scales. A plant with 2–4 technicians should focus on the top 3–5 bad actors, run RCM-light on critical assets only, and use CMMS automation for PM scheduling and MTBF tracking. Book a walkthrough at
Book a Demo to see how Oxmaint simplifies this for smaller teams.
Start your reliability improvement loop this week
Pull your CMMS data, identify your bad actors, and run the full loop — analyze, eliminate, optimize, monitor. Oxmaint makes every stage faster and visible.
Free 14-day trial · No credit card



-for-manufacturing-plants-a-2026-guide.png)