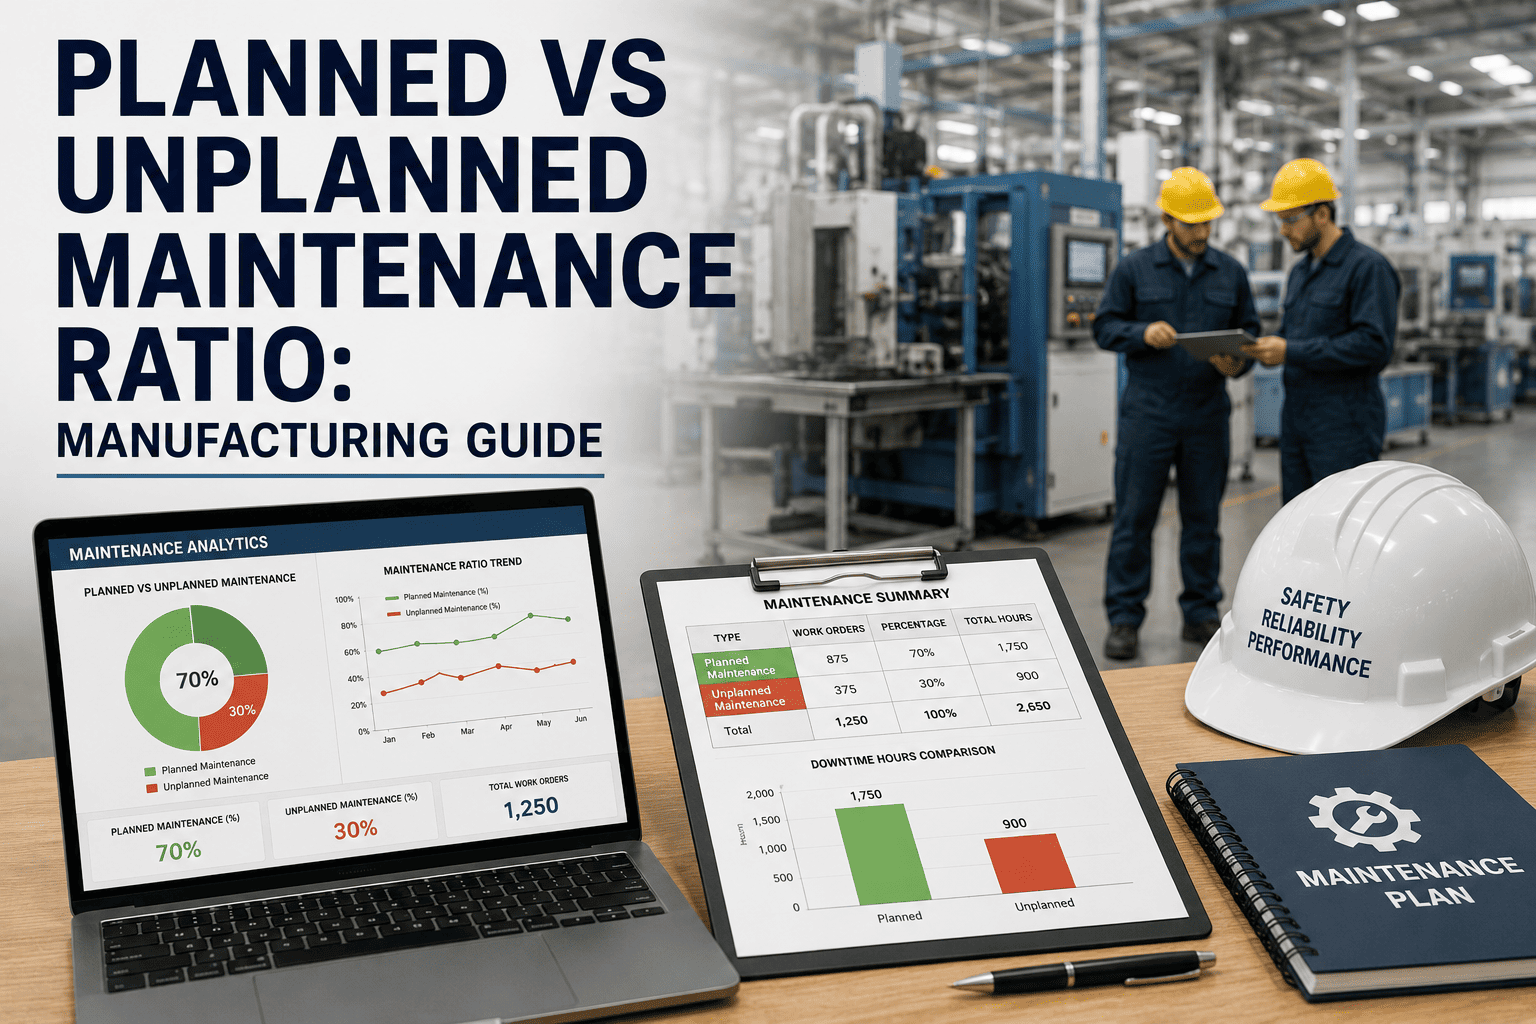
The planned-to-unplanned maintenance ratio is the single most revealing leading indicator of plant reliability — world-class facilities sustain 80:20 while firefighting plants languish near 30:70. Yet most maintenance managers measure it incorrectly, tracking labor hours instead of work orders and inflating their "planned" numbers with PMs that fail half the time. This guide breaks down the precise CMMS practices, PM compliance benchmarks, and backlog controls that move the needle without gaming the metric — so you can build a defensible 18-month roadmap from reactive chaos to condition-driven planning. Ready to see it on your own asset register? Start Free Trial and import your first 500 assets today.
Is 60% of your wrench-time spent putting out fires you saw coming?
Most plants know their ratio is broken — they just measure it wrong. Here's how to quantify the real gap between planned and unplanned work, why chasing the number blindly makes downtime worse, and the CMMS workflow that compounds 4% compliance gains into 20-point ratio shifts inside two quarters.
Stop Measuring Hours. Start Counting Work Orders.
The single biggest error maintenance teams make is calculating their ratio from labor-hours booked against "planned" vs "unplanned" cost codes — a method that rewards over-staffing and hides failed PMs.
Count only completed WOs in a rolling 90-day window. A work order is "planned" if its labor, parts, and procedure were defined before scheduling — not merely if a PM triggered it.
This inflates the ratio by 12–18 points because emergency repairs often consume 3–5× the labor of the original PM that should have caught the failure.
Where You Stand Against the Reliability Curve
Industry data from SMRP and IMC benchmarking studies places plants into four maturity tiers — each tier has a predictable cost-per-asset-year and a characteristic failure signature.
| Maturity Tier | Planned : Unplanned | PM Compliance | Cost / Asset / Year | Signature Behavior |
|---|---|---|---|---|
| Reactive | 30 : 70 | < 45% | $1,850 | Operators call maintenance by phone |
| Preventive | 50 : 50 | 55 – 70% | $1,200 | Calendar PMs exist but miss failures |
| Predictive | 70 : 30 | 75 – 88% | $780 | Vibration & oil analysis drive work |
| World-Class | 80 : 20 | > 90% | $520 | RCA on every critical failure |
A reactive plant spends roughly 3.6× more per asset-year than a world-class one. On a 500-asset facility that's $665,000 of recoverable annual margin — before counting lost production.
A 180-Asset Plant Moves from 58:42 to 79:21
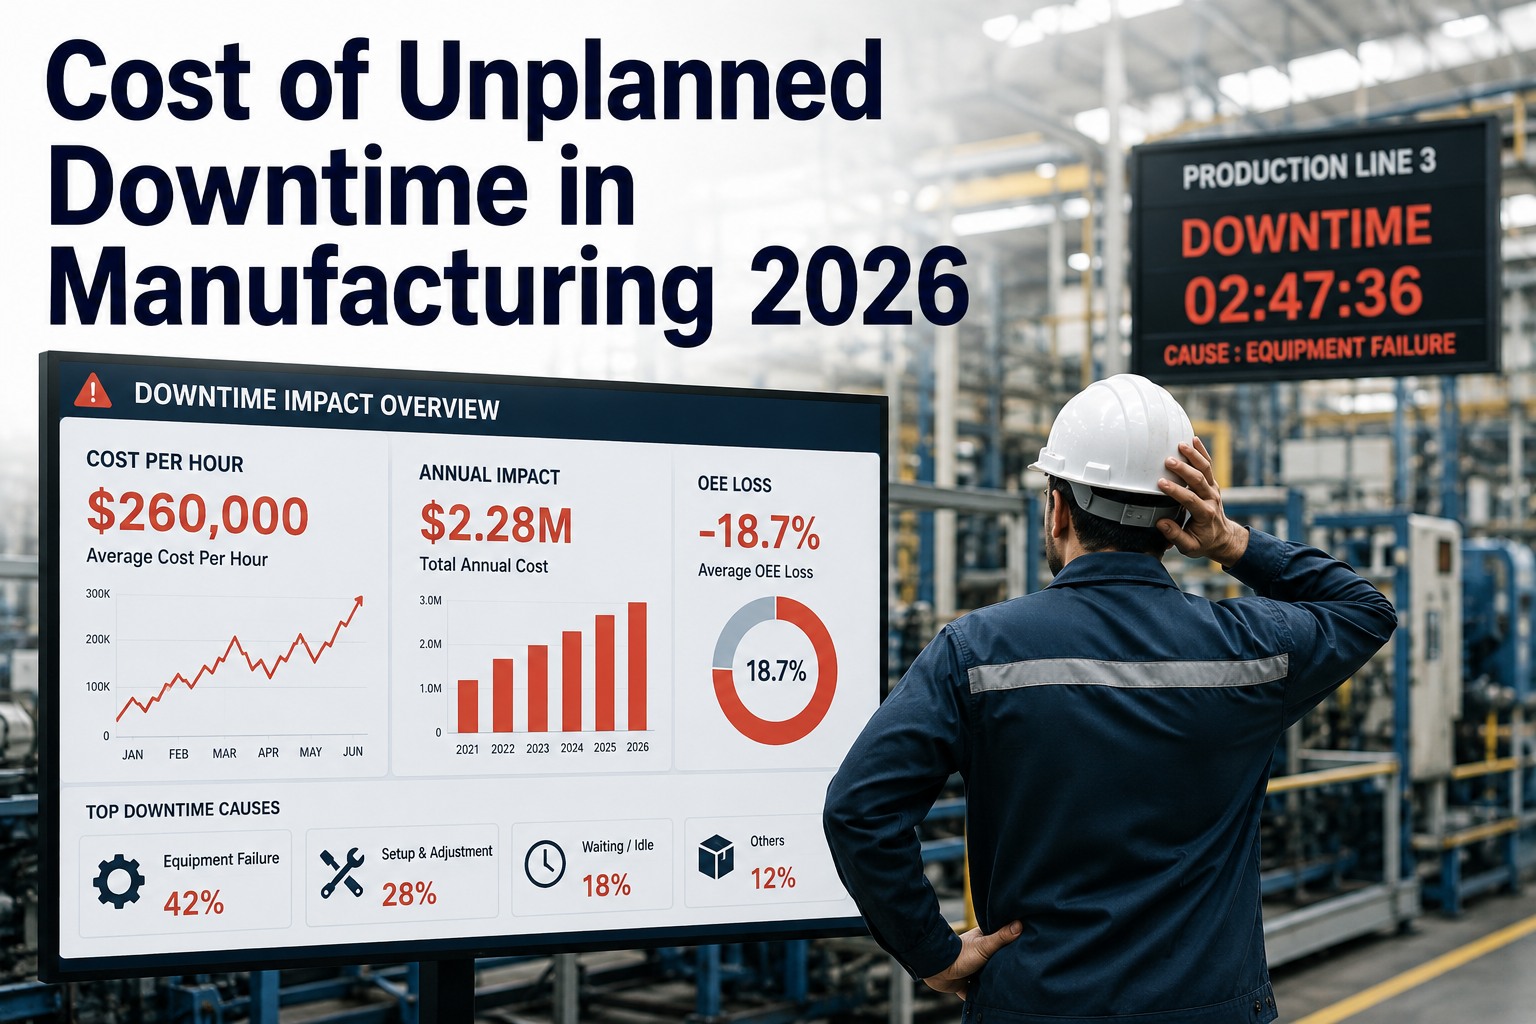
A Tier-2 food packaging plant in the Midwest tracked 4,200 work orders in FY-2023 and ran a 58:42 ratio — costing $314K in unplanned downtime. Here's the 12-month arc after implementing disciplined CMMS practices.
Closed 340 orphan WOs, re-tagged 1,100 assets against ISO 14224 criticality, and killed 62 duplicate PMs generating no findings. PM compliance baseline measured at 51%.
FoundationIntroduced a 7-day rolling schedule with a 95% fill target. Backlog aged past 30 days dropped from 410 WOs to 95. Wrench-time rose from 28% to 41% without adding headcount.
SchedulingVibration sensors on 22 critical motors and gearboxes replaced calendar PMs. First quarter caught 7 bearing failures early, converting 38 unplanned jobs to planned — each saving ~$4,200 in lost production.
CBMEvery unplanned critical failure now triggers a 5-Why within 72 hours. Final FY-2024 ratio: 79:21. PM compliance hit 91%. Unplanned downtime cost fell to $96K — a $218K annual recovery.
OptimizationWhat Actually Shifts the Ratio — and What Wastes Time
After auditing 300+ CMMS implementations, four practices separate plants that climb the curve from those that stall at 55:45 for years.
PM Compliance Above 90%
A PM not completed on schedule is worse than no PM — it creates false confidence. Track compliance weekly, not monthly. Plants below 80% compliance typically show a negative correlation between PM count and reliability.
Schedule Adherence & Wrench-Time
If your weekly schedule breaks more than 15% of the time, you don't have a scheduling problem — you have an unplanned-work problem. Measure schedule breakouts by cause code; the top 3 codes usually account for 70% of disruptions.
Backlog Aging Under 21 Days
Healthy backlog is 2–4 weeks of ready-to-schedule work. Beyond 30 days, WOs decay — assets change state, parts go missing, and the job gets re-planned anyway. Run a weekly aging report and kill or fast-track anything over 21 days.
RCA on Every Critical Failure
Without a closed-loop root cause analysis, the same failure recurs in 6–14 months. mandate a 5-Why or fishbone within 72 hours of any unplanned critical-event WO. The pattern data alone will reshape your PM strategy within a year.
Three Ways Plants Game the Ratio — and Make Things Worse
When the metric becomes the target, bad behavior follows. These three anti-patterns look like improvement on the dashboard but quietly destroy reliability.
Re-labeling breakdown WOs as "planned" after the fact
Some teams convert an emergency repair into a "planned" WO because a PM existed for that asset. A PM that didn't prevent the failure is not a planned event — it's a failed PM. Counting it as planned hides the real gap and starves the improvement conversation.
Failed PMs must be counted as unplanned
If a PM-triggered WO discovers a failure requiring immediate repair, the repair portion is unplanned. This honesty is the only way to identify which PMs need to be re-engineered, shortened, or converted to condition-based.
Adding more PMs to inflate the planned count
Doubling your PM library doesn't improve reliability — it dilutes wrench-time and pushes compliance below 60%. Plants that add PMs without removing ineffective ones see their ratio worsen within two quarters as the backlog explodes.
Cut ineffective PMs before adding new ones
Run a PM effectiveness audit: any PM that hasn't generated a finding or corrective action in 12 months is a candidate for elimination or extension. World-class plants run 30% fewer PMs than reactive plants — but execute them at 90%+ compliance.
Your CMMS already has the data. Use it to find your real ratio in 48 hours.
Oxmaint connects to your existing asset register and auto-classifies every work order as planned or unplanned — no manual recoding, no spreadsheet exports.
Planned vs Unplanned Maintenance — Answered
What is a good planned-to-unplanned maintenance ratio?
World-class plants sustain 80:20, meaning 80% of completed work orders are planned and 20% are unplanned. The SMRP benchmark for "acceptable" is 65:35, but anything below 60:40 indicates a reactive culture where maintenance is driven by failure rather than by strategy. The target depends on asset criticality — a plant running legacy equipment may reasonably sit at 70:30 while a newer facility should aim for 85:15.
How is the planned maintenance percentage (PMP) calculated?
PMP = (Planned Work Orders ÷ Total Work Orders) × 100, measured over a rolling 90-day window. A work order counts as planned only if labor hours, parts, and procedure were defined before the job was scheduled. Do not use labor hours as the denominator — it inflates the ratio by 12–18 points because emergency repairs consume disproportionately more labor than the PMs that should have caught them.
How long does it take to move from 60:40 to 80:20?
A disciplined plant with executive support can move 20 points in 12–18 months. The fastest gains come in months 3–6 from backlog control and scheduling discipline; the durable gains come in months 6–15 from condition monitoring and RCA loops. Plants that try to shortcut by adding PMs without removing ineffective ones typically stall at 65:35. Book a demo at calendly.com/oxmaintapp/30min to see a personalized roadmap.
What CMMS reports should I run weekly to track the ratio?
Run four: (1) WO completion by type code — planned vs unplanned, (2) PM compliance % on a 7-day lag, (3) backlog aging by week-bucket, and (4) schedule adherence with breakout cause codes. Review them in the same 30-minute weekly meeting. If your CMMS can't generate all four in under five minutes, it's time to evaluate whether it supports reliability-driven maintenance or just work-order logging.
Does a higher planned maintenance ratio always mean lower costs?
Not automatically — a ratio above 85% with PM compliance below 70% means you're planning work that isn't getting done, which is worse than being honest about being reactive. The ratio must be read alongside PM compliance, schedule adherence, and backlog age. A plant at 75:25 with 92% PM compliance and 14-day backlog is healthier than one at 82:18 with 60% compliance and 45-day backlog. Context is everything.
Stop firefighting. Start planning with intent.
Import your asset register, classify your work orders automatically, and watch your real planned-to-unplanned ratio appear on day one — no recoding, no consultants, no 6-month implementation.
Free 14-day trial · No credit card




.png)

