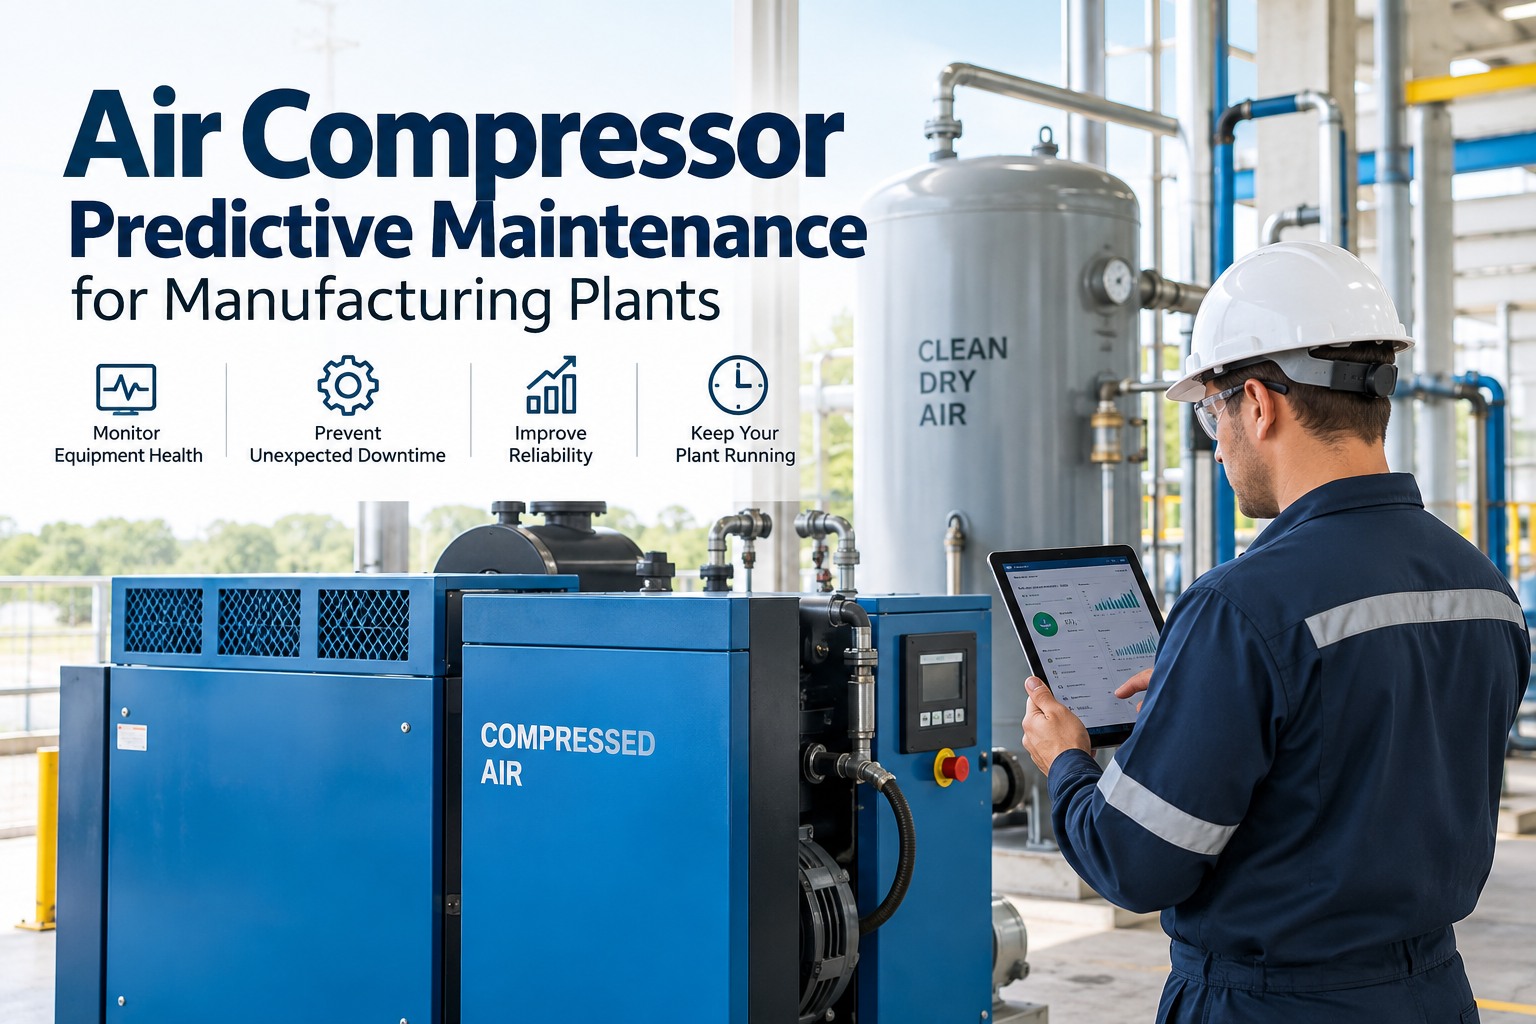
Every hour of unplanned downtime in a discrete manufacturing plant costs thousands — lost production, idle technicians, premium rush shipping for parts, and customers questioning your reliability. Yet most facilities respond to downtime reactively, creating emergency work orders only after equipment fails. The plants that minimize downtime don't fix equipment faster; they prevent failures before they happen through systematic root cause elimination, condition-based maintenance triggers, and real-time visibility into asset health. Unplanned downtime isn't inevitable — it's a symptom of maintenance program maturity. Facilities that track downtime causes, link those causes to preventive actions, and measure success through declining failure rates can reduce unplanned downtime by 50–70% within 18 months. Sign Up Free to start tracking downtime causes and converting them into targeted prevention strategies inside your CMMS.
Downtime Prevention Strategy
Stop Downtime Before It Stops Your Production
OxMaint tracks every minute of downtime, categorizes root causes, and automatically recommends preventive actions — spare parts to pre-position, PM tasks to prioritize, or assets requiring condition monitoring — so your maintenance team can be proactive instead of reactive.
Why Discrete Manufacturing Experiences Unplanned Downtime
The Root Causes Behind Equipment Failures and Production Loss
Inadequate Preventive Maintenance
A
Equipment is scheduled for PM, but schedules don't align with actual failure patterns. Tasks are missed or incomplete. The gap between scheduled PM and actual PM execution grows until equipment fails unexpectedly. Industry data shows 35–40% of unplanned downtime originates from incomplete or delayed preventive maintenance.
No Condition Monitoring or Early Warning
B
Equipment condition degradation goes undetected until failure occurs. Vibration increases, temperatures rise, fluid contamination accelerates — but without sensors or routine inspections capturing these signals, technicians don't know there's a problem until the equipment stops. Most failures are predictable 7–21 days before they occur.
Critical Spare Parts Not Available
C
Equipment fails, but the replacement part isn't stocked. Procurement lead times of 3–5 days turn a 2-hour repair job into 5+ days of downtime. For high-impact assets, unavailable spares often extend downtime by 300–400%. Strategic spares positioning eliminates this delay entirely.
Technician Skill Gaps or Unavailability
D
Equipment requires specialized knowledge, but the technician with that expertise is on vacation, assigned to another project, or has insufficient training. Single-source technician skills create bottlenecks. Cross-training reduces repair time 25–40% and ensures availability during unexpected failures.
Poor Root Cause Documentation
E
Equipment fails repeatedly with the same symptom, but root causes aren't documented. The same asset fails 3, 5, even 10+ times with identical symptoms because the underlying problem was never eliminated. Recurring failures account for 25–30% of unplanned downtime at most facilities.
Lack of Real-Time Downtime Visibility
F
Downtime incidents aren't logged immediately or accurately. Days pass before downtime is recorded in the CMMS. This delays analysis, makes pattern recognition impossible, and prevents rapid response to emerging failure trends. Real-time downtime tracking is essential for trend detection.
35–40%
of unplanned downtime stems from inadequate or delayed preventive maintenance execution
25–30%
of failures are recurring events on the same asset with identical root causes
50–70%
potential downtime reduction for plants implementing structured downtime prevention programs
The Downtime Prevention Framework: Six Strategies to Reduce Unplanned Downtime
Proven Tactics to Eliminate Failures Before They Stop Production
1
Audit and Optimize Preventive Maintenance Compliance
Review your PM schedule against OEM recommendations and actual failure history. Are PM tasks happening on time? Are they comprehensive enough? Many facilities have PM schedules that don't align with equipment needs. Increase PM completion rate to >90% and adjust task lists based on failure root causes.
Book a Demo to see how OxMaint benchmarks your PM compliance against industry targets.
2
Deploy Condition Monitoring on Critical Assets
Identify your facility's 20–30% highest-impact assets and deploy monitoring — vibration sensors on rotating equipment, thermography on electrical systems, oil analysis on hydraulic systems. Set alert thresholds so technicians know when to schedule maintenance 7–14 days before failure. Condition monitoring predicts 70–80% of failures in advance.
3
Implement Strategic Spare Parts Positioning
For critical assets, maintain "just-in-case" inventory of common failure parts on-site. Bearings, seals, drive belts, coupling elements — parts that fail frequently and take days to procure. Reducing spare parts wait time from 3+ days to 30 minutes eliminates a major downtime source.
Sign Up Free to track which parts cause longest procurement delays and optimize stock levels.
4
Cross-Train Technicians and Develop Repair Procedures
Identify your highest-risk single-source skills — the knowledge only one technician possesses. Develop documented procedures and cross-train at least one backup technician on each critical asset type. Document repair sequences, parts lists, and estimated duration for rapid reference. Technician availability bottlenecks often extend downtime 50–100%.
5
Track and Eliminate Recurring Failure Modes
Every month, audit your downtime log for assets that failed 2+ times in the past 12 months with identical symptoms. These are your best improvement opportunities — eliminating one recurring failure mode prevents 5–15 future incidents. Root cause analysis followed by targeted redesign, upgraded components, or changed operating conditions pays back quickly.
6
Implement Real-Time Downtime Tracking and Analysis
Capture downtime incidents immediately — when equipment stops, not days later. Record duration, root cause, technician response time, and corrective action. Analyze downtime trends weekly to detect emerging failure patterns before they multiply. Most facilities eliminate 15–25% of downtime through simple trend-based prevention once they can see patterns.
Downtime Prevention Checklist: Critical Assessment Areas
Evaluate Your Facility's Readiness to Reduce Unplanned Downtime
- PM completion rate: >90% of scheduled tasks
- PM overdue work orders: <5% of active PM schedule
- PM tasks reviewed annually against OEM specs
- Technicians have documented PM procedures
- Critical assets have condition sensors (vibration, thermal, fluid)
- Alert thresholds established and calibrated
- Condition data auto-triggers maintenance work orders
- Technicians trained on sensor data interpretation
- Critical parts stocked on-site for key assets
- Reorder points set and monitored monthly
- Stockout incidents tracked and minimized
- Obsolete inventory removed quarterly
- 2+ technicians trained on each critical asset
- Repair procedures documented and accessible
- Training records current for all technicians
- On-call rotation established for emergencies
- All downtime incidents logged within 24 hours
- Root cause categorized for 100% of incidents
- Recurring failures identified and tracked monthly
- Downtime trends analyzed for prevention patterns
- CMMS connected to condition sensors or alert systems
- Work order closure captures actual repair time & root cause
- Downtime KPIs calculated automatically (MTTR, MTBF)
- Reports available on-demand for trend analysis
Calculating Downtime Cost and ROI of Prevention Investments
Why Downtime Prevention Always Pays Back
Lost Production Value
Production capacity × number of units per hour × equipment downtime hours × gross margin per unit
Example: 500 units/hour × $2 margin × 8 hours downtime = $8,000 lost gross margin per incident
Emergency Labor & Overtime
Technician hourly rate × 1.5–2.0 multiplier (overtime premium) × hours to resolve
Example: $35/hr × 1.75 × 12 hours emergency repair = $735 premium labor cost
Expedited Parts & Materials
Standard part cost + rush shipping premium (often 100–300% markup)
Example: $400 bearing at standard cost + $800 overnight shipping = $1,200 vs. $450 with planning
Customer Impact & Risk
Contractual penalties + risk of losing customer + damage to reputation
Example: $500 weekly penalty × 2 weeks late delivery + $10k contract at risk = significant exposure
A single 8-hour downtime incident often costs $10,000–$25,000 in lost production, emergency labor, and expedited parts. A facility experiencing 10–15 unplanned downtime incidents per year at this cost faces $100,000–$375,000 in annual downtime losses. Investing $30,000–$50,000 in condition monitoring, spare parts optimization, and cross-training pays back in one year. Most facilities reduce downtime 40–60% in year one, delivering 2–5× ROI.
Real-Time Downtime Prevention Platform
Transform Downtime Data Into Prevention Intelligence
OxMaint tracks every downtime incident, identifies root causes, benchmarks your performance against industry standards, and recommends prevention actions ranked by impact — so you eliminate the failures costing you the most.
Frequently Asked Questions: Reducing Unplanned Downtime
What's the fastest way to reduce unplanned downtime?
Identifying and fixing recurring failures (assets failing 2+ times with identical root causes) delivers the fastest payback. These account for 25–30% of downtime and are often fixable with a single targeted intervention — upgraded component, design change, or operating adjustment.
How much should I invest in spare parts to prevent downtime?
Stock critical parts for your highest-impact assets — typically 20–30 of the facility's 80/20 rule. Parts that fail frequently and take days to procure warrant on-site inventory. Carrying cost (5–10% of parts value annually) is minor compared to downtime cost ($10,000–$25,000 per incident).
Can condition monitoring prevent all unplanned downtime?
Condition monitoring can predict 70–80% of failures in advance, but not 100%. Some failures (catastrophic seizures, sudden bearing collapse) occur too rapidly. Combining condition monitoring with spare parts positioning and technician readiness captures most preventable downtime.
What's a realistic downtime reduction target for the first year?
Most facilities reduce unplanned downtime 40–60% in year one through optimized PM, real-time tracking, and recurring failure elimination. Year two improvements of additional 20–30% come from condition monitoring and process refinement. Payback typically occurs within 12 months.
How do I track downtime if my equipment doesn't have sensors?
Start simple: technicians manually log downtime when it occurs. Capture start time, end time, affected equipment, and root cause. Use this data to identify your worst-performing assets — then justify sensor investment based on potential savings.
Should I focus on preventing failures or reducing repair time?
Preventing failures is 5–10× more cost-effective than reducing repair time. An asset that fails once per year and takes 8 hours to fix is far less impactful than one that fails monthly. Always prioritize prevention — spare parts and technician improvements are secondary strategies.
Downtime Prevention & Production Reliability
Stop Reactive Maintenance. Start Predictive Protection.
OxMaint puts your facility on the path to predictable, maintainable operations — with downtime prevention strategies backed by real data and measurable ROI.