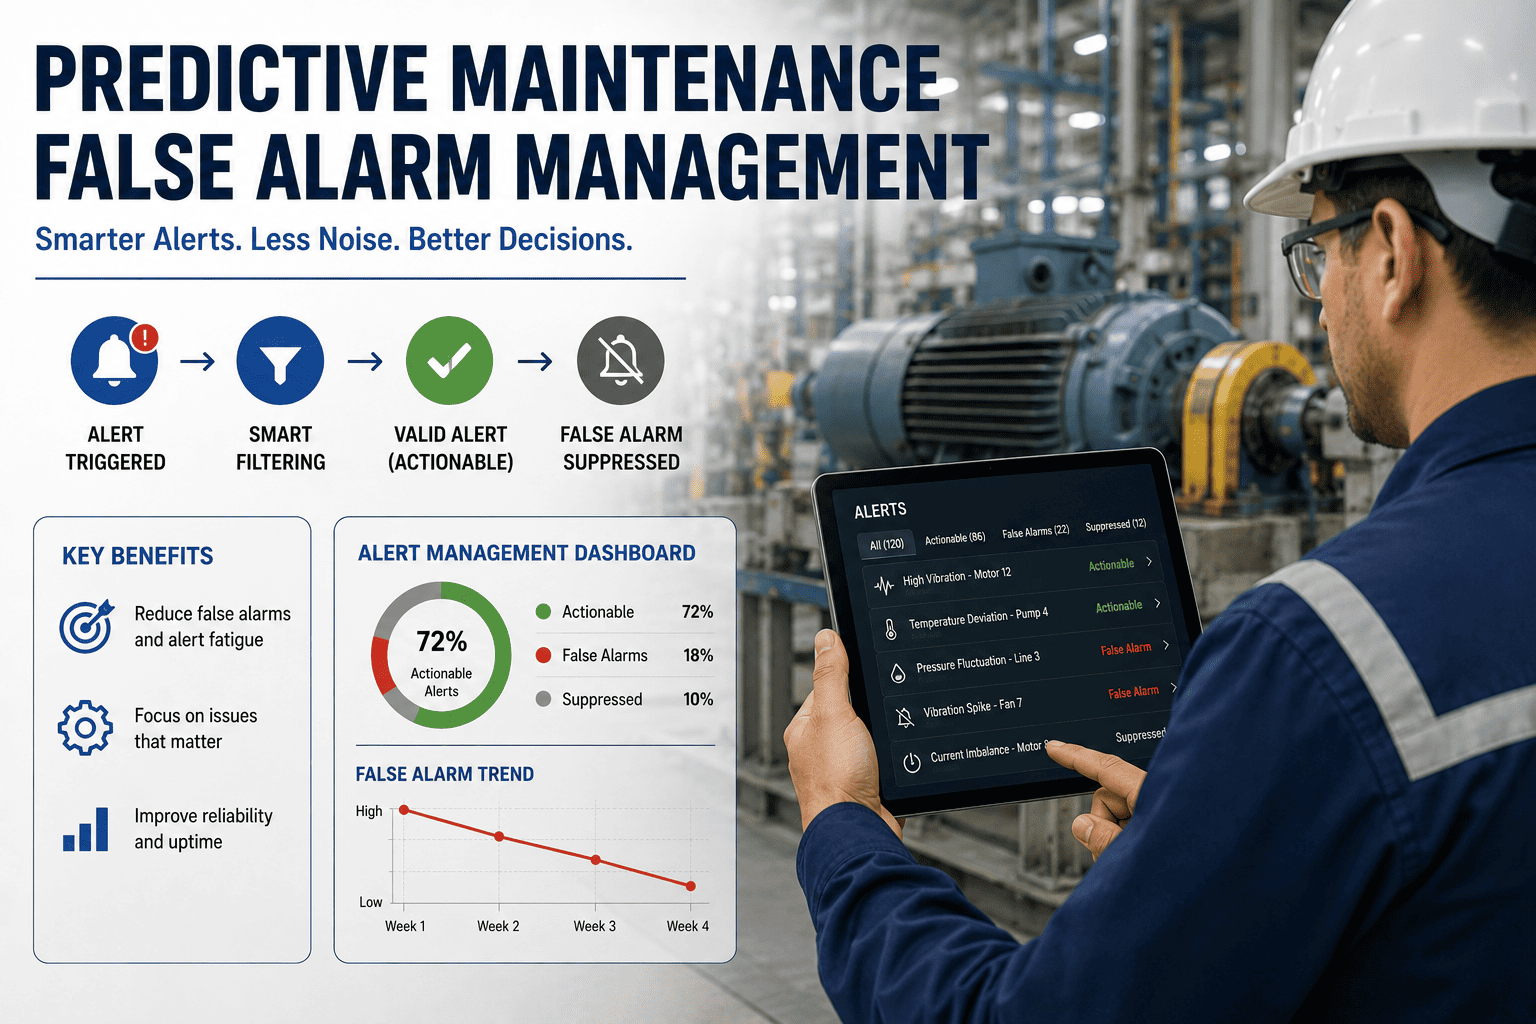
Predictive maintenance promises to catch failures before they happen — but when 30 to 50 percent of the alerts your vibration, oil-analysis and thermal sensors fire off turn out to be false positives, the program quietly turns against itself. Technicians start treating every notification as noise, real warnings slip through, and within months you are back to reactive firefighting with a six-figure monitoring stack collecting dust. The good news is that false alarm rates can be driven below 10 percent without missing genuine failures, using a disciplined combination of baseline tuning, multi-parameter confirmation logic, alert clustering, and a CMMS verification loop. This guide walks through each lever in practical detail — Start Free Trial to see the workflow live in oxmaint, or read on for the full playbook.
Are false alarms quietly destroying trust in your predictive maintenance program?
Every unnecessary alert chips away at technician confidence until real warnings get ignored. When your false-positive rate crosses 30 percent, critical signals start disappearing into the noise — and that is exactly when catastrophic failures strike. The fix is not more sensors; it is sharper alarm logic.
A 180-asset plant loses $42K a year to false alarms
False alarms are not a nuisance — they are a measurable drain on reliability budgets, technician hours and program credibility. Consider a typical mid-sized discrete-manufacturing facility running 180 condition-monitored assets at a false-positive rate of 35 percent.
A food-processing plant in the Midwest deployed wireless vibration sensors on 180 motors, pumps and fans. Within six months the system was firing 340 alerts per month — 119 were false positives. Maintenance teams stopped responding within 48 hours. When a real bearing failure triggered on a critical refrigeration compressor, the alert sat in the queue for four days. Result: $86,000 in lost product, $14,000 in emergency repair, and a 22-hour unplanned outage. After implementing the alarm logic overhaul in this guide, false positives dropped to 8 percent and the same team now clears every alert within six hours.
The four-pillar false alarm reduction framework
No single setting eliminates false positives. Plants that reach sub-10 percent false alarm rates combine four interlocking controls, each addressing a different source of noise — from sensor drift to seasonal variance to model staleness.
Baseline Tuning
Establish asset-specific vibration, temperature and current baselines over a 14-to-30-day learning window. Reject generic OEM thresholds — a 200 HP motor and a 5 HP motor do not share the same alarm band. Recalibrate baselines quarterly or after any major maintenance event.
Cuts false positives 35–45%Multi-Parameter Confirmation
Require two independent indicators before escalating to a critical work order — for example, vibration RMS exceeding band AND temperature rising above asset-specific delta. Single-parameter alerts route to a review queue instead of triggering dispatch.
Cuts false positives 25–30%Alert Clustering
Suppress cascading alerts from the same asset family or machine train within a configurable time window. One gearbox failure can fire 40 notifications across six sensors — cluster them into a single actionable work order with a combined diagnostic.
Cuts false positives 15–20%Model Retraining Cycle
Schedule monthly retraining of ML-based prediction models using verified outcome data from your CMMS. Models trained on stale data degrade — a model older than 90 days typically sees false-positive rates climb 3 to 5 percent per month.
Sustains sub-10% long-termHow to set alarm thresholds that actually work
Most plants inherit vendor defaults — ISO 10816 vibration bands, generic temperature limits — and never tune them to their actual operating context. That is the root cause of most false positives. Here is the proven tuning sequence.
Collect clean operating data
Log 14 consecutive days of sensor data under normal load conditions. Exclude startup, shutdown and wash-down cycles. Tag anomalous events so they do not pollute the baseline. For variable-speed assets, segment data by operating speed band.
Calculate statistical baselines
For each asset, compute the mean and standard deviation of key indicators — vibration RMS, peak acceleration, temperature delta, motor current. Set the yellow alert at mean plus three sigma and the red alert at mean plus five sigma, then validate against ISO 10816 boundaries.
Apply multi-parameter logic
Define confirmation rules: a red-level vibration event only triggers a critical work order if temperature delta also exceeds two sigma within the same 60-minute window. Single-parameter reds route to a review queue for analyst confirmation before any technician is dispatched.
Run shadow mode and validate
Operate the new logic in parallel with the old for two weeks. Compare alert volumes, false-positive counts and — critically — confirm zero genuine failures were suppressed. Target a 60 percent reduction in total alert volume with no missed events.
Go live and schedule quarterly recalibration
Cut over to the new logic. Put a recurring quarterly review on the calendar to recompute baselines — operating conditions drift, bearings wear into new patterns, and seasonal temperature shifts invalidate summer thresholds by winter.
The CMMS verification loop that separates signal from noise
Every PdM alert should pass through a structured CMMS confirmation workflow before it reaches a technician's wrench. This five-step loop, modeled on TPM and ISO 55000 asset-management principles, is what separates plants with 8 percent false-positive rates from those stuck at 40 percent.
Auto-Triage
Sensor alert hits the CMMS. System checks multi-parameter confirmation rules and assigns a confidence score from 0 to 100.
Cluster & Deduplicate
Related alerts from the same machine train within the time window are merged into a single work order with combined diagnostics.
Analyst Review
Alerts below 70 percent confidence route to a reliability analyst for 15-minute waveform review before any field dispatch.
Technician Dispatch
Confirmed work orders carry the diagnostic evidence packet — vibration spectrum, trend chart, comparable failure signatures.
Outcome Feedback
Technician logs what was actually found. That verified outcome feeds back into model retraining and threshold recalibration.
The feedback loop is the entire game. Without step five, your model is learning from its own guesses — and that is how false-positive rates silently creep back up month after month. Plants that close the loop see sustained sub-10 percent false alarm rates within two retraining cycles.
Where you stand against industry benchmarks
Use this matrix to gauge your current false alarm performance and identify which lever will deliver the biggest improvement. Numbers reflect aggregated data across discrete and process manufacturing plants running PdM programs for 12-plus months.
| Maturity Level | False Positive Rate | Avg. Alert-to-Action Time | Missed Failures / Quarter | Primary Gap |
|---|---|---|---|---|
| Reactive | 45–55% | 72+ hours | 3–5 | No baseline tuning; OEM defaults |
| Developing | 25–35% | 24–48 hours | 1–2 | Single-parameter logic; no clustering |
| Optimized | 10–18% | 6–12 hours | 0–1 | Infrequent model retraining |
| Best-in-Class | < 10% | < 4 hours | 0 | None — continuous improvement loop |
Ready to cut your false alarm rate below 10 percent?
Deploy the full PdM alarm management workflow — baseline tuning, multi-parameter confirmation, alert clustering and CMMS feedback — in oxmaint. Most plants see measurable false-positive reduction within the first retraining cycle.
PdM false alarm management, answered
What is an acceptable false positive rate for a predictive maintenance program?
Best-in-class plants operate below 10 percent false positives. Anything above 20 percent begins eroding technician trust, and above 35 percent you enter alarm fatigue territory where genuine failures get missed. The target depends on asset criticality — for safety-critical equipment, aim for under 5 percent; for run-of-the-mill pumps and motors, 10 to 15 percent is defensible. Start Free Trial to benchmark your current rate against industry data.
How often should PdM alarm thresholds be recalibrated?
Quarterly recalibration is the minimum for most manufacturing environments. High-variability processes — batch chemical, seasonal food production, assets with frequent load changes — benefit from monthly reviews. Always recalibrate immediately after a major maintenance event, motor replacement, or process modification, because the baseline operating signature has fundamentally changed.
Does multi-parameter confirmation risk missing real failures?
When configured correctly, no. The key is that single-parameter anomalies still generate a review-queue alert — they simply do not auto-dispatch a technician until a second indicator confirms. In benchmarking studies, plants using two-parameter confirmation saw missed-failure rates drop to near zero because analysts caught borderline cases during review instead of burying them in a flood of false dispatches.
How long does it take to reduce false alarms from 40 percent to under 10 percent?
A disciplined plant can make the journey in 10 to 12 weeks. Weeks 1 through 4 cover baseline data collection and statistical threshold calculation. Weeks 5 through 8 implement multi-parameter logic and run shadow-mode validation. Weeks 9 through 12 go live, tune, and complete the first model retraining cycle. Plants with mature CMMS data and existing reliability teams move faster. Book a Demo to map a timeline for your facility.
What is the single biggest mistake plants make with PdM alarms?
Leaving OEM default thresholds in place and never tuning them to actual operating context. A vibration sensor shipped with ISO 10816 generic bands will fire constantly on a production-floor motor because those bands were designed for test-stand conditions. The second-biggest mistake is failing to close the feedback loop — if technician findings never feed back into model retraining, false-positive rates silently climb back up within three to four months.
Stop chasing ghost alerts and start catching real failures
Build your false alarm reduction workflow in oxmaint — baseline tuning, multi-parameter confirmation, alert clustering and closed-loop CMMS feedback in one platform. Your technicians deserve alerts they can trust.
Free 14-day trial · No credit card