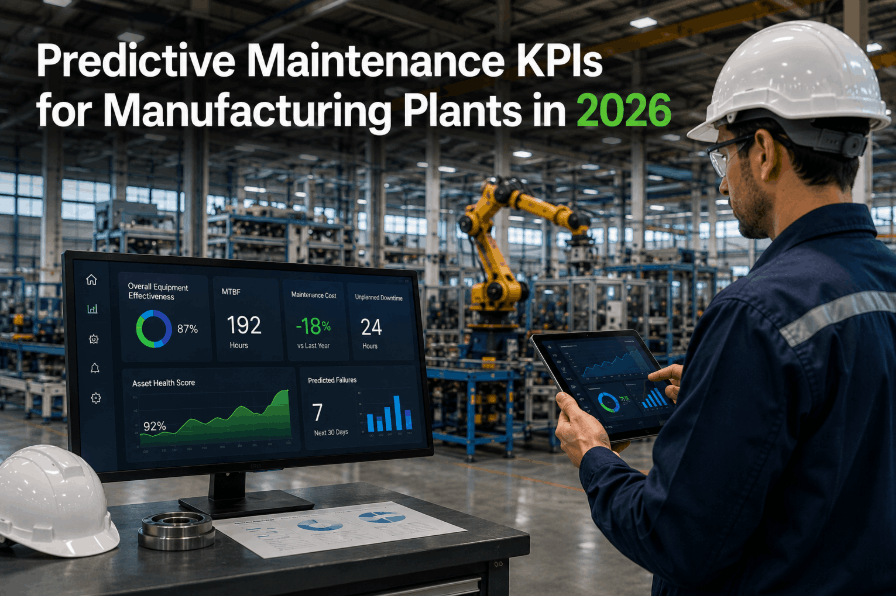
Predictive maintenance KPIs separate manufacturing plants that run reliably from those that face constant equipment failures and production losses. Most facilities still rely on reactive maintenance — responding to breakdowns after they happen — when data-driven KPI tracking could prevent 70–80% of unplanned downtime before it occurs. Predictive maintenance KPIs measure what's working in your asset care strategy: failure prediction accuracy, condition monitoring coverage, mean time between failures, and the ROI of switching from calendar-based PM to condition-based intervention. Whether you're benchmarking against industry standards or building a predictive maintenance program from scratch, understanding which KPIs matter most — and how to track them continuously — determines whether your maintenance program becomes a competitive advantage or remains a cost center. Sign Up Free to start collecting real-time predictive maintenance KPIs from your asset and work order data today.
What Are Predictive Maintenance KPIs?
The Metrics That Transform Equipment Care Into Failure Prevention
Predictive maintenance KPIs are the measurable indicators that tell you whether your maintenance program is successfully predicting and preventing failures before they shut down production. Unlike preventive maintenance KPIs — which measure whether scheduled tasks happen on time — predictive KPIs measure whether the data you're collecting about asset condition actually leads to earlier intervention, longer intervals between failures, and reduced emergency repairs. The core predictive maintenance KPIs include: mean time between failures (MTBF), time to failure prediction accuracy, condition monitoring sensor coverage, the percentage of maintenance driven by condition alerts versus calendar schedules, and the ratio of planned maintenance tasks triggered by early warning signals to total planned work. Every one of these metrics sits inside your CMMS data — but only if you're actively collecting condition data, linking failures to root causes, and tracking whether your predictions came true.
Critical Predictive Maintenance KPIs Every Plant Should Track
The Seven KPIs That Predict Maintenance Success and Equipment Reliability
Predictive Maintenance KPI Benchmarks by Industry
How Your Plant Compares Against Manufacturing Standards
| KPI | Automotive | Pharmaceuticals | Food & Beverage | Discrete Manufacturing |
|---|---|---|---|---|
| MTBF (hours) | 2,000–4,000 | 4,000–8,000 | 1,200–2,500 | 1,800–3,500 |
| Prediction Accuracy | 75–85% | 82–92% | 70–78% | 72–80% |
| Planned/Unplanned Ratio | 75/25 | 85/15 | 65/35 | 70/30 |
| Condition Monitoring Coverage | 65–75% | 80–95% | 45–60% | 55–70% |
| False Alarm Rate | 18–25% | 8–12% | 22–30% | 20–28% |
Your facility's predictive maintenance KPIs should align with these benchmarks within your industry — but the most important comparison is trending. If your MTBF is rising, prediction accuracy is improving, and planned maintenance is increasing as a percentage of total work, your predictive maintenance program is working. Book a Demo to see how OxMaint benchmarks your KPIs against industry standards and highlights improvement opportunities.
How to Implement Predictive Maintenance KPI Tracking
A Practical Four-Step Path to Data-Driven Asset Care
Frequently Asked Questions: Predictive Maintenance KPIs
What's the difference between MTBF and MTTR in predictive maintenance?
MTBF (Mean Time Between Failures) measures how long equipment runs between failures — a higher MTBF is the goal. MTTR (Mean Time To Repair) measures how quickly you fix breakdowns that do occur. Predictive maintenance increases MTBF by preventing failures; it reduces MTTR by catching issues before emergencies happen.
How long does it take to see improvement in predictive maintenance KPIs?
Most facilities see measurable improvement in MTBF and planned/unplanned ratio within 3–6 months of implementing condition monitoring. Prediction accuracy typically stabilizes after 9–12 months as your model learns asset-specific failure patterns. Early wins appear immediately — reduced emergency repairs and better maintenance scheduling.
What condition monitoring technology is needed for predictive maintenance?
Options range from simple thermometers and vibration meters to advanced IoT sensors. Start with highest-risk assets — rotating equipment like motors, pumps, bearings. Vibration sensors, thermal imaging, oil analysis, and ultrasound detection are proven technologies. OxMaint integrates data from all these sources into one KPI dashboard.
Can I implement predictive maintenance KPIs with my existing CMMS?
Most legacy CMMS platforms support basic KPI calculation but lack real-time condition data integration and automated alert logic. OxMaint natively connects condition sensors, calculates predictive KPIs, and triggers work orders automatically — without manual reporting.
What's a realistic prediction accuracy rate for manufacturing plants?
Industry baseline is 70–80% for mature predictive programs. Rates below 60% signal insufficient condition data, poor threshold calibration, or unmonitored failure modes. Rates above 85% are achievable with continuous model refinement and comprehensive sensor coverage.
How do predictive maintenance KPIs impact ROI and operational costs?
Plants reducing unplanned downtime by 50–70% typically see 20–35% reduction in total maintenance spend, plus improved production output. Predictive maintenance prevents catastrophic failures that cost 5–10× more than planned interventions. ROI payback is typically 12–18 months.

.png)


.png)
.png)