Aging Power Plant Asset Management: Reliability & Maintenance Roadmap

By Willam Jerry on October 7, 2026

aging-power-plant-asset-management-roadmap

A fleet of generating assets past the midpoint of its design life forces the same hard question on every turbine, boiler, generator and transformer: keep running it, overhaul it, or replace it. Answer by gut and you either pour capital into a unit near the end of its life or run a critical asset to a forced outage. Answer by data and aging becomes a managed, budgeted roadmap. This guide lays out a reliability and maintenance roadmap for aging power-plant assets — condition scoring, criticality, risk-based strategy and the repair-or-replace decision — and shows how OXMAINT AI, the AI-powered power-plant CMMS, turns asset history into the decisions behind it.

Power Generation · Availability & Reliability · Aging Asset Management · 2026

Aging Power Plant Asset Management: Reliability & Maintenance Roadmap

A thirty-year-old unit with climbing repair bills, no clear view of which assets to overhaul first, and a capital plan built on calendar age instead of condition — that's how aging fleets drift into forced outages. OXMAINT AI, the AI-powered CMMS and maintenance management software, scores each asset's health from its own data, ranks the fleet by condition, matches a maintenance strategy to lifecycle position, and frames every repair-or-replace decision on the record behind it.

1Assess → 2Rank → 3Strategize → 4Decide
ASSET HEALTH SCORE


0255075100
58Watch — raise inspection cadence
Recalculated on every sensor read, closed work order & inspection
0–100
health score, continuously recalculated per asset
4
lifecycle bands from healthy to critical
RUL
remaining useful life as a confidence range, not a guess
1–10 yr
rolling horizon for maintenance & replacement planning

Step 1 — Score Each Asset on Its Own Condition

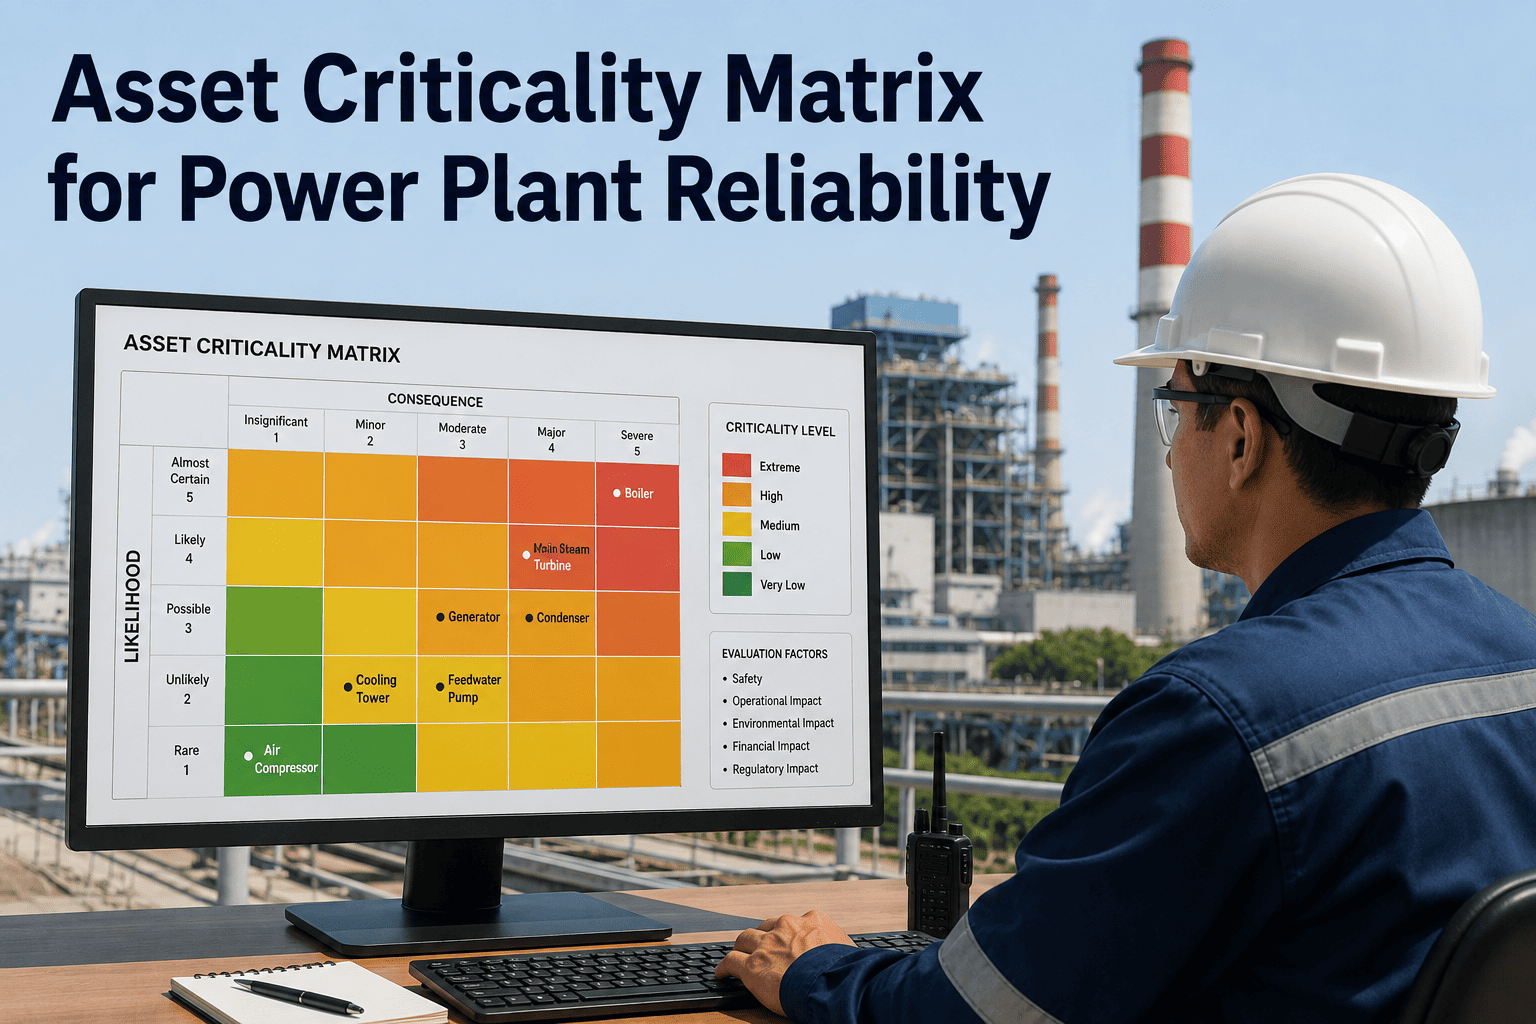
Calendar age is a weak proxy for health — two identical units with different duty histories age at different rates. A condition score built from real data replaces the guess, and it updates every time new evidence arrives. OXMAINT AI pulls four streams into one 0–100 health score per asset. Book a demo to see health scoring in OXMAINT AI.

Sensor degradation
Vibration trends, temperature profiles and efficiency-loss curves — the live evidence of wear.
Maintenance history
Work-order completion rates and overhaul quality — how well the asset has actually been cared for.
Operational stress
Fired hours, thermal cycles and load-factor history — how hard the asset has been run.
Inspection results
Each closed inspection recalculates the score, so it reflects the latest known state.

What gets measured differs by asset, and OXMAINT AI tracks the condition indicators that actually predict each type's failure. Start free and map your asset indicators in OXMAINT AI.

AssetCondition indicators tracked
Gas & steam turbines Fired hours, thermal-barrier coating degradation, compressor efficiency loss
Boilers & HRSGs Tube wall thickness, pressure-cycling fatigue, heat-transfer efficiency decline
Generators Winding insulation-resistance trends, vibration history, partial-discharge activity
Transformers Dissolved-gas analysis (DGA) trends, thermal aging factor, oil quality, tap-changer wear

Step 2 — Rank the Fleet by Lifecycle Band

A score is only useful when it drives an action. Each asset's health places it in one of four bands, and each band carries a defined response — so the fleet sorts itself worst-first and attention follows condition, not habit. OXMAINT AI keeps every asset in its band in real time. Book a demo to see fleet ranking in OXMAINT AI.

75–100
Healthy
Normal monitoring cadence — the asset is performing to expectation.
50–74
Watch
Increase inspection frequency — early degradation is showing in the data.
25–49
Caution
Plan an intervention within 90 days — the trend is heading the wrong way.
0–24
Critical
Immediate action required — the asset is at or near end of safe service.

Remaining useful life rides alongside the band as a probabilistic confidence range rather than a single date, updating as new data arrives — and trend alerts give weeks of warning before an asset crosses into the next band down.

Aging Isn’t the Problem. Flying Blind Through It Is.

An old asset managed on condition data can run safely for years; a newer one managed on guesswork can surprise you. A health score, a lifecycle band and a remaining-life range per asset turn an aging fleet from a liability into a plan you can budget and defend.

Step 3 — Match Strategy to Lifecycle Position

Not every aging asset deserves the same maintenance dollar. Strategy should shift with where the asset sits on its lifecycle cost curve — what makes sense for a healthy unit wastes money on a critical one, and vice versa. OXMAINT AI matches the strategy to the band. Start free and set risk-based strategy in OXMAINT AI.

HEALTHY
Preventive & condition-based
Hold the standard PM cadence and let condition monitoring catch the first signs of change.
WATCH
Tighten condition monitoring
Raise inspection frequency and watch the trend — intervene on evidence, not on the calendar.
CAUTION
Plan the intervention
Schedule an overhaul or targeted repair in a planned outage, and run the repair-or-replace numbers.
CRITICAL
Decide and act
Replace, rebuild or retire — the asset is no longer a monitoring case but a capital decision.

Step 4 — Repair, Replace, or Keep

The hardest call on an aging asset is the capital one, and it shouldn't rest on instinct. A clear framework sorts every asset into one of three paths on defined criteria drawn from its own history. OXMAINT AI supplies the data behind each. Book a demo to run the decision framework in OXMAINT AI.

KEEP & MONITOR
Fewer than two unplanned events per year
Low repair history relative to replacement value
No active degradation trend in monitoring
PM compliance above 90%
Risk manageable with redundancy
REPAIR
Repair cost under 40% of replacement value
First or second failure of its type
Age less than 60% of designed service life
Identifiable, correctable root cause
PM history current — failure not preventable
REPLACE
Cumulative repair spend over 60% of replacement value
MTBF declining more than 20% year over year
Spare parts obsolete or long lead times
Recurring same-mode failure despite fixes
Compliance or efficiency forces an upgrade

The Three Numbers That Settle It

Behind the three paths sit three calculations, each straight from maintenance records — so the decision is defensible, not an opinion. OXMAINT AI computes all three from the work-order and asset history it already holds. Start free and calculate the decision metrics in OXMAINT AI.

Annual Maintenance Cost Ratio
annual repair spend ÷ replacement value
0–3%keep & monitor
3–6%review PM
6–10%evaluate
10%+replace case
MTBF Trend (12-mo rolling)
operating hours ÷ number of failures
stable / risinghealth maintained
down 10–20%increase PM
down 20%+terminal decline
Replacement Payback
net replacement cost ÷ annual saving
under 3 yrproceed
3–5 yrconditional
5–8 yrimprove PM instead
8 yr+extend life

How OXMAINT AI Runs the Roadmap

An aging-asset program lives or dies on the data behind it — and that data has to come from the system that already tracks the work. OXMAINT AI carries the roadmap from condition scoring to the capital plan. Book a demo to see the full roadmap in OXMAINT AI.

◉
Continuous Health Scoring
A 0–100 score per asset, recalculated on every sensor read, closed work order and inspection result.
◉
Fleet Worst-First Ranking
Benchmark each asset against fleet averages and sort by condition, so attention goes where risk is highest.
◉
Probabilistic RUL
Remaining useful life as a confidence range that updates continuously, with age-adjusted models for sparse records.
◉
Early Trend Alerts
Advance warning of weeks before a health score crosses into a lower band, so intervention is planned, not forced.
◉
Decision Metrics From History
Cost ratio, MTBF trend and payback computed from the work-order and asset records already in the system.
◉
Rolling CapEx Horizon
Maintenance and replacement spend projected on a rolling one-to-ten-year horizon for structured budgeting.
“

Half our fleet is past its original design life, and for years the capital plan was really just a list of the oldest nameplate dates. Scoring every major asset on its actual condition changed the conversation with finance entirely — we could show which thirty-year-old units were genuinely healthy and which newer ones were trending down, and put the repair-or-replace case on real numbers instead of age. The overhauls now land where the data says, and the budget finally matches the plant.

Plant Asset Management & Reliability Director · Power Generation Fleet

Frequently Asked Questions

How is an aging asset's health scored?
From four data streams combined into a 0–100 score: sensor degradation (vibration, temperature, efficiency loss), maintenance-history quality, operational stress (fired hours, thermal cycles, load factor) and inspection results. The score recalculates whenever new data arrives. Book a demo to see scoring in OXMAINT AI.
What do the lifecycle bands mean?
Four bands drive the response: Healthy (75–100) stays on normal cadence, Watch (50–74) gets more inspection, Caution (25–49) needs an intervention planned within 90 days, and Critical (0–24) requires immediate action. The fleet sorts worst-first automatically.
When should an aging asset be replaced rather than repaired?
The replace case strengthens when cumulative repair spend passes about 60% of replacement value, MTBF is declining more than 20% year over year, spare parts are obsolete or slow to source, the same failure recurs despite fixes, or compliance and efficiency force an upgrade. Repair fits when cost is under 40% and age is under 60% of service life.
What is remaining useful life, and how is it used?
RUL is an estimate of how long an asset can safely serve, expressed as a probabilistic confidence range rather than a single date, that updates as new data arrives. It rides alongside the health band to inform intervention timing and the capital plan.
Which numbers decide repair versus replace?
Three, all from maintenance records: the annual maintenance cost ratio (repair spend over replacement value), the 12-month MTBF trend, and the replacement payback period. Together they turn a judgment call into a defensible, data-backed decision. Start free and run the numbers in OXMAINT AI.

Turn an Aging Fleet Into a Managed Roadmap.

Run aging-asset management on the OXMAINT AI maintenance management software — continuous 0–100 health scoring, four-band lifecycle ranking, probabilistic remaining-life estimates, risk-based strategy, and a repair-or-replace framework computed from your own history. Manage the fleet by condition, and budget the next decade with confidence.



Share This Story, Choose Your Platform!