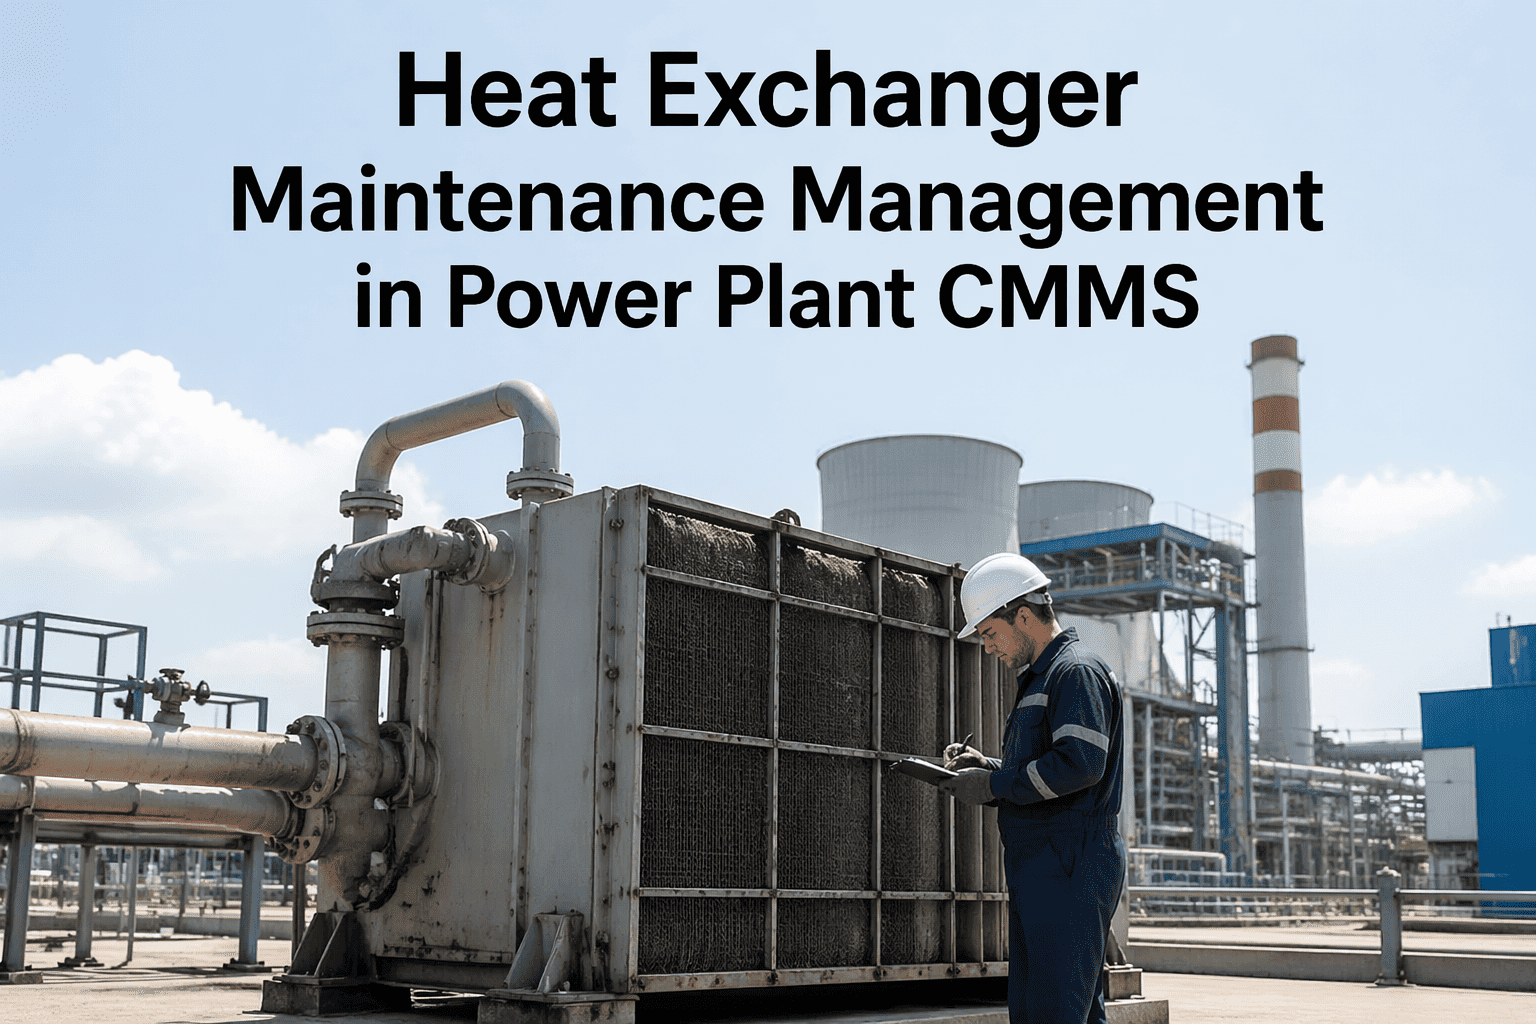
A single fouled shell-and-tube condenser at a 250 MW unit lost 6.2°C of approach temperature over four months because nobody was tracking the trend. The plant kept running it at the same load until heat rate crept up by 1.8%, costing roughly ₹3.1 crore in extra fuel before anyone scheduled a tube cleaning. Heat exchangers fail this way constantly — not suddenly, but gradually, invisibly, until the fuel bill or the trip alarm forces the issue. Sign up for OxMaint to track fouling trends, tube health, and inspection history on every exchanger from one dashboard.
Digital Heat Exchanger Inspection and Maintenance Platform
Track fouling rate, tube wall loss, and cleaning cycles across every shell-and-tube, plate, and air-cooled exchanger in your plant — with inspection data and predictive alerts in one CMMS, not scattered across log sheets and gut instinct.
How Fouling Quietly Erodes Heat Exchanger Performance Between Inspections
Fouling does not announce itself. It builds up gradually inside tubes and on plates, and without a structured way to track the trend, plants only notice once performance has already degraded significantly.
Five Data Points That Tell You an Exchanger Needs Attention Before It Costs You
Every inspection logs inlet and outlet temperatures on both sides. OxMaint plots the approach temperature trend automatically, so a slow climb toward your fouling threshold is visible weeks before it becomes a heat rate problem.
Rising differential pressure across tube or plate bundles is one of the earliest fouling indicators. Field technicians log readings on mobile, and OxMaint flags deviation beyond your configured threshold automatically.
Ultrasonic thickness readings from periodic tube inspections are stored against each tube bundle's permanent record, so wear rate over years — not just the latest reading — drives the retirement-for-cause decision.
Every mechanical cleaning, chemical descaling, and biocide dose is logged against the asset, building a treatment history that shows which interventions actually extend the fouling cycle on that specific exchanger.
Tube-by-tube eddy current test results, including plugged tube counts and defect classifications, attach directly to the exchanger record — giving the next overhaul team a complete defect map instead of a loose PDF report.
Map Every Condenser, Cooler, and Heater Into One Reliability Dashboard
OxMaint's onboarding team configures fouling thresholds, inspection checklists, and cleaning schedules around your existing exchanger data sheets — typically completed within a week, with no disruption to ongoing operations.
Inspection and Monitoring Parameters by Heat Exchanger Type
| Exchanger Type | Primary Fouling Risk | Inspection Frequency | Key Monitored Parameter |
|---|---|---|---|
| Shell-and-Tube Condenser | Biological growth, silt | Monthly | Approach temperature, vacuum |
| Plate Heat Exchanger | Scale, particulate buildup | Quarterly | Pressure drop, plate gap |
| Air-Cooled Heat Exchanger | Dust, fin blockage | Monthly | Fin cleanliness, fan vibration |
| Feedwater Heater | Scale, tube corrosion | Semi-annual | Tube wall thickness, TTD |
| Lube Oil Cooler | Oil varnish, sediment | Quarterly | Oil outlet temperature |
What Actually Causes Fouling — and Why the Same Exchanger Fouls Faster Some Years
Two identical exchangers on the same system can foul at very different rates depending on water chemistry, flow velocity, and seasonal biological activity. Knowing which mechanism is driving the trend changes which intervention actually works.
Mineral deposits, mainly calcium carbonate, precipitate out of hard water onto tube walls as temperature rises, building an insulating layer that responds well to descaling chemicals but poorly to mechanical brushing alone.
Algae, bacteria, and mussel growth thrive in cooling water systems during warmer months, often requiring biocide dosing rather than just a mechanical clean to actually slow the regrowth rate.
Silt, dust, and process-side particulate settle in low-velocity zones of the bundle, usually pointing to an upstream filtration or flow-distribution issue rather than the exchanger itself being at fault.
Corrosion products from upstream piping or the tubes themselves accumulate as a rough oxide layer, both insulating the surface and accelerating further corrosion underneath — the most serious mechanism to catch early.
A Practical Inspection and Cleaning Cadence That Keeps Fouling Under Control
Define the heat transfer coefficient drop that triggers a cleaning recommendation for each exchanger individually, based on its design margin, rather than applying one blanket threshold across dissimilar equipment.
Weekly or bi-weekly temperature and pressure logging, even on running equipment, is what makes the fouling curve visible early — waiting for the next planned outage to inspect misses months of trend data.
Use inspection findings and fouling history to choose chemical descaling, mechanical brushing, or hydroblasting specifically for the dominant fouling type on that exchanger, instead of defaulting to whichever method was used last time.
Compare post-cleaning performance against the previous clean-condition baseline to confirm the cleaning actually restored capacity — a partial recovery often signals a developing mechanical issue rather than just fouling.
What Better Fouling Visibility Is Worth Across a Typical Exchanger Fleet
Across plants running structured fouling monitoring on their major exchangers, the value shows up in three consistent places rather than one single dramatic save.
Catching condenser fouling at month two instead of month six avoids weeks of running at degraded efficiency, which on a large unit translates into meaningful fuel cost avoided per cleaning cycle.
Scheduling cleaning into a planned window instead of an emergency response avoids both the premium labor cost and the unplanned production loss that comes with reactive maintenance.
Catching corrosion fouling early, before it accelerates underlying tube wall loss, extends the interval between retubing campaigns and defers significant capital replacement cost.
Heat Exchanger Maintenance on OxMaint — Common Questions
Yes. Once inlet and outlet temperatures and flow rates are logged for both sides of the exchanger, OxMaint calculates the overall heat transfer coefficient trend and flags when it drops below your configured clean-condition baseline. This removes the need for engineers to manually recalculate fouling factor in a spreadsheet after every inspection round. Sign up to configure fouling thresholds for your exchanger fleet.
Plugged tube locations and defect classifications from eddy current or IRIS testing are recorded against the specific tube bundle, building a cumulative plugging map over successive overhauls. When plugged tube count approaches your retubing threshold, OxMaint raises a planning alert well ahead of the next scheduled outage. Book a demo to see tube mapping in action.
OxMaint maintains a cost and downtime log for every cleaning event, mechanical or chemical, against each exchanger. Over a few cycles, this history shows which method restores performance for longer on that specific asset, helping maintenance planners choose the more economical option rather than defaulting to habit. Sign up to start building that cleaning history today.
Technicians use the OxMaint mobile app to log temperature, pressure, and flow readings directly at the exchanger, even in areas without network coverage. Readings sync automatically once the device reconnects, and any threshold breach immediately generates a work order in the planner's queue. Book a demo to see the mobile inspection flow.
OxMaint can ingest temperature and pressure tags from your DCS or SCADA historian alongside manually logged inspection readings, giving a single combined trend line for each exchanger rather than two disconnected data sources. This is typically configured during onboarding based on your existing tag list. Sign up to discuss your historian integration.
Put Every Heat Exchanger on a Fouling Curve You Can Actually See
OxMaint logs inspection readings, calculates fouling trends, and schedules cleanings before performance loss turns into a forced outage — across every condenser, cooler, and heater in your plant.