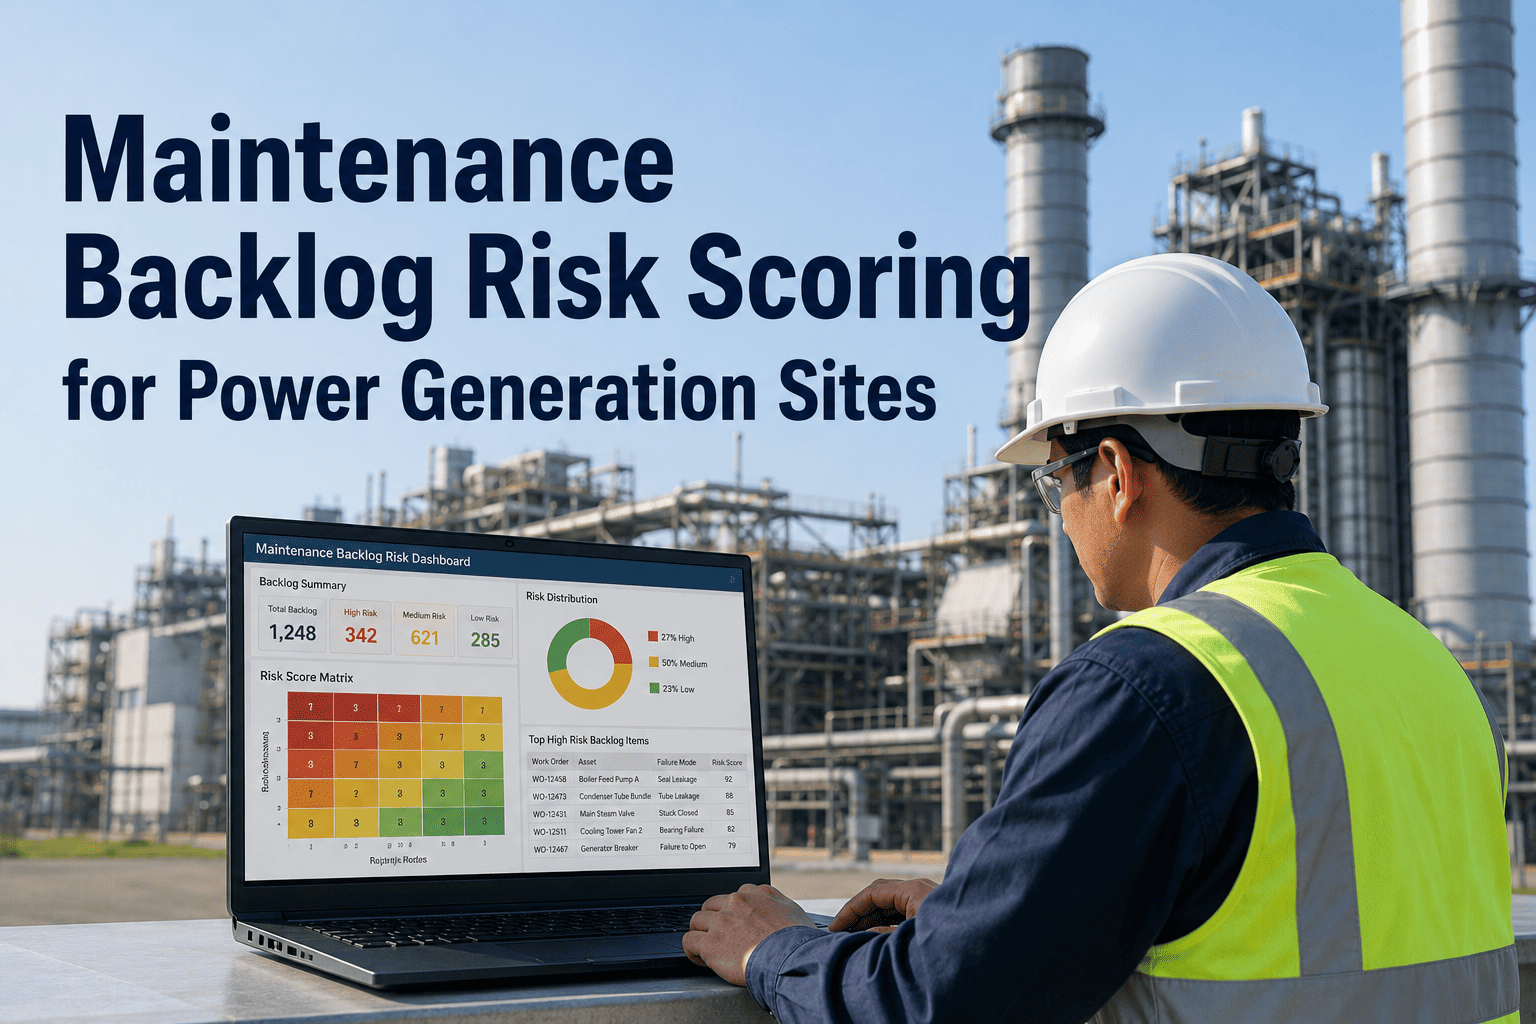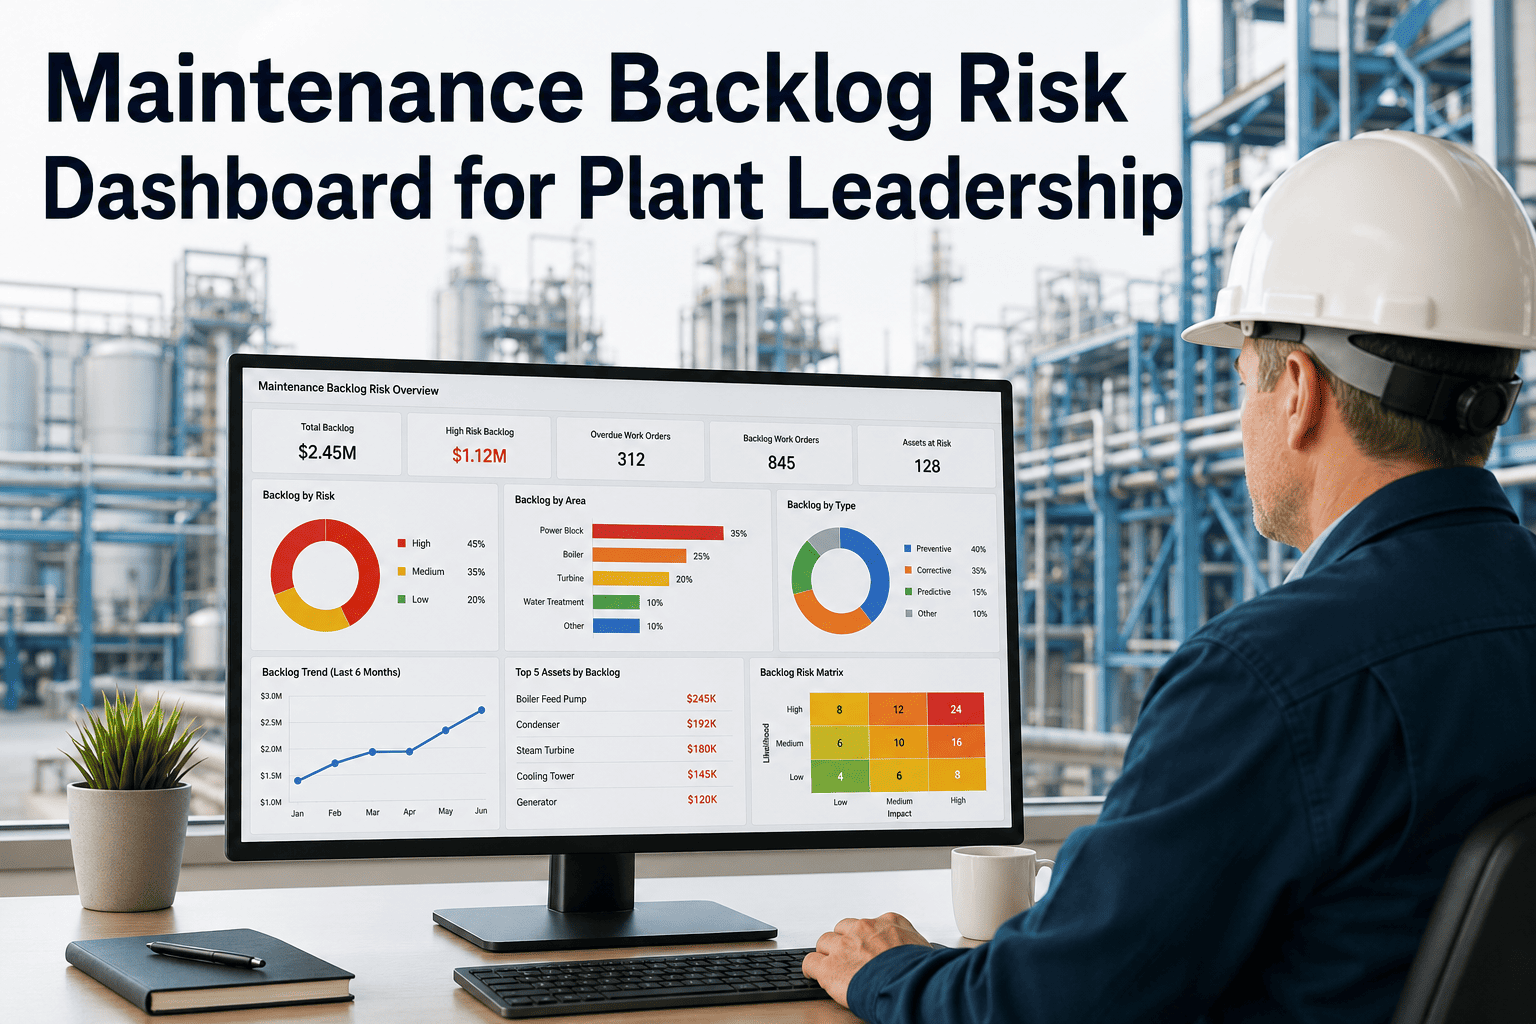
A maintenance backlog is not just an operational inconvenience — it is a forward-looking risk register that tells plant leadership which assets are most likely to fail and when, if current resourcing and scheduling continue unchanged. Most power plants carry a backlog; the question is whether leadership can see it clearly enough to act before the risk materializes. When backlog visibility is limited to a count of open work orders, the plant is navigating blind: a thousand open work orders on non-critical assets is far less dangerous than twenty overdue PMs on primary turbine lubrication systems. OxMaint Analytics and Reporting delivers a maintenance backlog risk dashboard that weights and prioritizes the backlog by asset criticality, failure probability, and operational consequence — giving plant leadership the view they need to make resourcing decisions before a work order becomes a forced outage. See how OxMaint Analytics works, or book a demo with our power generation team.
Maintenance Backlog Risk Dashboard for Plant Leadership
Not all backlog is equal. The dashboard separates high-risk overdue work from routine queue depth — showing plant leadership exactly which deferred tasks represent real reliability and safety risk, and which can wait.
Why Backlog Count Alone Misleads Plant Leadership
The most common backlog metric reported to plant leadership — total open work orders — is the least useful one. It creates a false equivalence between high-risk and low-risk items that consistently leads to misallocated resources.
How the Dashboard Scores Backlog Risk
Each work order in the backlog is scored on three dimensions that are multiplied to produce a composite risk rating, determining its position in the priority view.
The 23 highest-risk work orders in your backlog are costing more in unrealized risk than the 341 low-risk items combined. OxMaint shows you which 23 they are — and makes scheduling them a one-click action.
What Plant Leadership Sees in the Dashboard
Plant Leaders on the Backlog Risk Dashboard
Before this dashboard, I was managing a backlog by its count and age. After deploying OxMaint, I discovered that my five longest-running open work orders were all low-risk administrative tasks, while seventeen high-risk PMs on our Unit 1 turbine cooling system had been sitting in the queue below them. We rescheduled in 24 hours. Two of those seventeen would have been failures inside 45 days.
Plant Director · 900 MW Combined Cycle · Mid-AtlanticThe cost-of-inaction number changed how we talk about maintenance budget in leadership meetings. When I can show that the deferred high-risk backlog represents an estimated $4.2M in potential unplanned outage cost, the conversation about authorizing overtime or additional contractor hours is very different. That number used to be a guess. Now it is a dashboard figure with a methodology behind it.
VP Operations · Multi-Unit Thermal Plant · SoutheastFrequently Asked Questions
How does the dashboard integrate with our existing asset criticality register?
OxMaint imports your existing asset criticality register — whether it is maintained in an EAM system like SAP PM or Oracle EAM, a separate criticality assessment tool, or a spreadsheet — and maps criticality scores directly to the backlog risk calculation. If criticality ratings are not yet formalized, OxMaint provides a built-in criticality assessment template based on standard power generation reliability criteria that plants can complete during onboarding. Once mapped, criticality scoring applies automatically to every new and existing work order without manual intervention. Start free to set up criticality mapping.
Can the dashboard send alerts when the high-risk backlog count exceeds a defined threshold?
Yes — plant managers and maintenance superintendents can configure alert thresholds for the high-risk backlog count, the rate of increase in high-risk items, and the aggregate cost-of-inaction estimate. When any configured threshold is breached, the relevant leader receives a direct alert with the current backlog risk profile and a link to the prioritized work order list, enabling an immediate scheduling response without requiring a dashboard login. Alerts can be set to daily digest or real-time notification depending on the plant's management style. Book a demo to configure your alert thresholds.
How does the resource adequacy view work — does it connect to crew scheduling?
The resource adequacy view compares the estimated labor hours required to close all high-risk backlog work orders within a defined window — typically the current week or a rolling 7-day period — against available maintenance crew hours logged in OxMaint. When the required hours exceed available capacity, the dashboard flags a resource gap and shows which work orders are at risk of remaining unaddressed. Managers can then directly request contractor support, authorize overtime, or reallocate crews from lower-priority tasks — all logged against the backlog event for audit purposes. Start free to see the resource view.
Can the dashboard be used in multi-plant or multi-unit fleet reporting?
Yes — the backlog risk dashboard scales to multi-unit and multi-plant configurations, with a portfolio view that shows risk-stratified backlog counts for each plant or unit side by side. Fleet managers and VP-level leaders can see which facility carries the highest aggregate risk backlog, drill to site level, and compare week-over-week trends across the portfolio. This view is particularly valuable during quarterly leadership reviews and board-level risk reporting, where a single number per site communicates maintenance risk posture without requiring detailed operational knowledge of each facility. Book a demo to see fleet backlog views.
What data is needed to get the backlog risk dashboard running, and how long does setup take?
The minimum data requirement is an active work order list with asset identifiers, and an asset criticality mapping — either imported from an existing register or built using OxMaint's onboarding template. With these two inputs, the risk dashboard is operational within the first week. Failure probability scoring improves progressively as PM completion records and inspection history accumulate. Most plants that complete structured onboarding see a fully operational risk-stratified backlog view within two to three weeks of go-live, including historical backlog import and criticality calibration.
Know Which Work Orders Are a Risk, Not Just Which Are Old
OxMaint scores every backlog item by asset criticality, failure probability, and consequence — giving plant leadership the risk-stratified view they need to act before a deferred task becomes a forced outage.