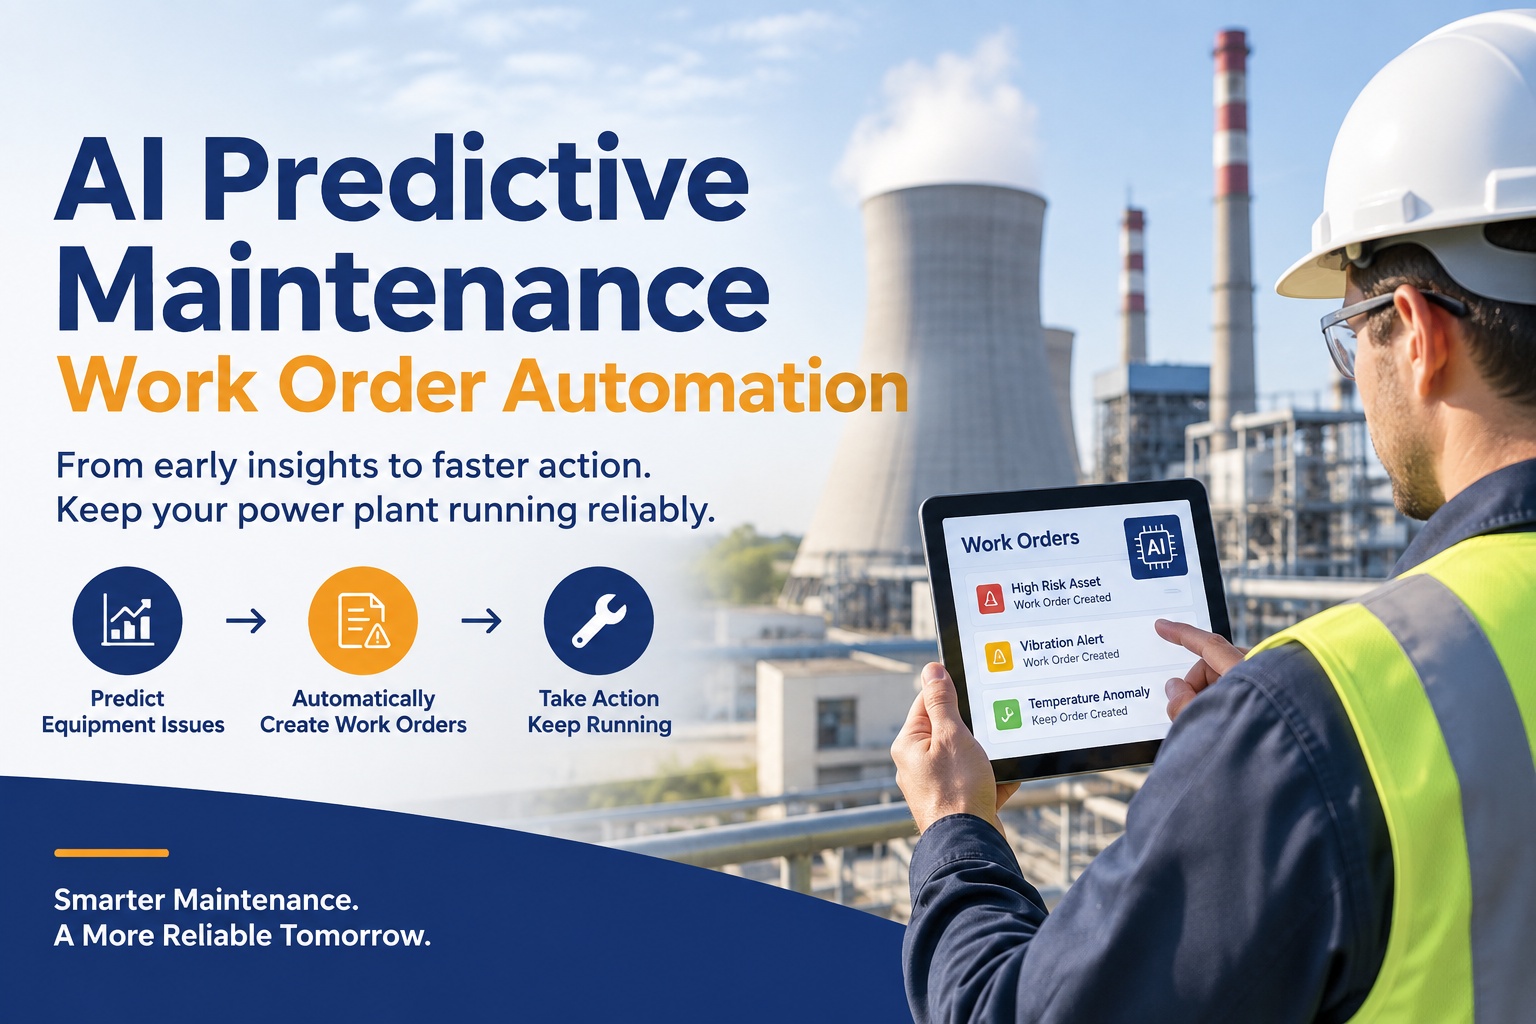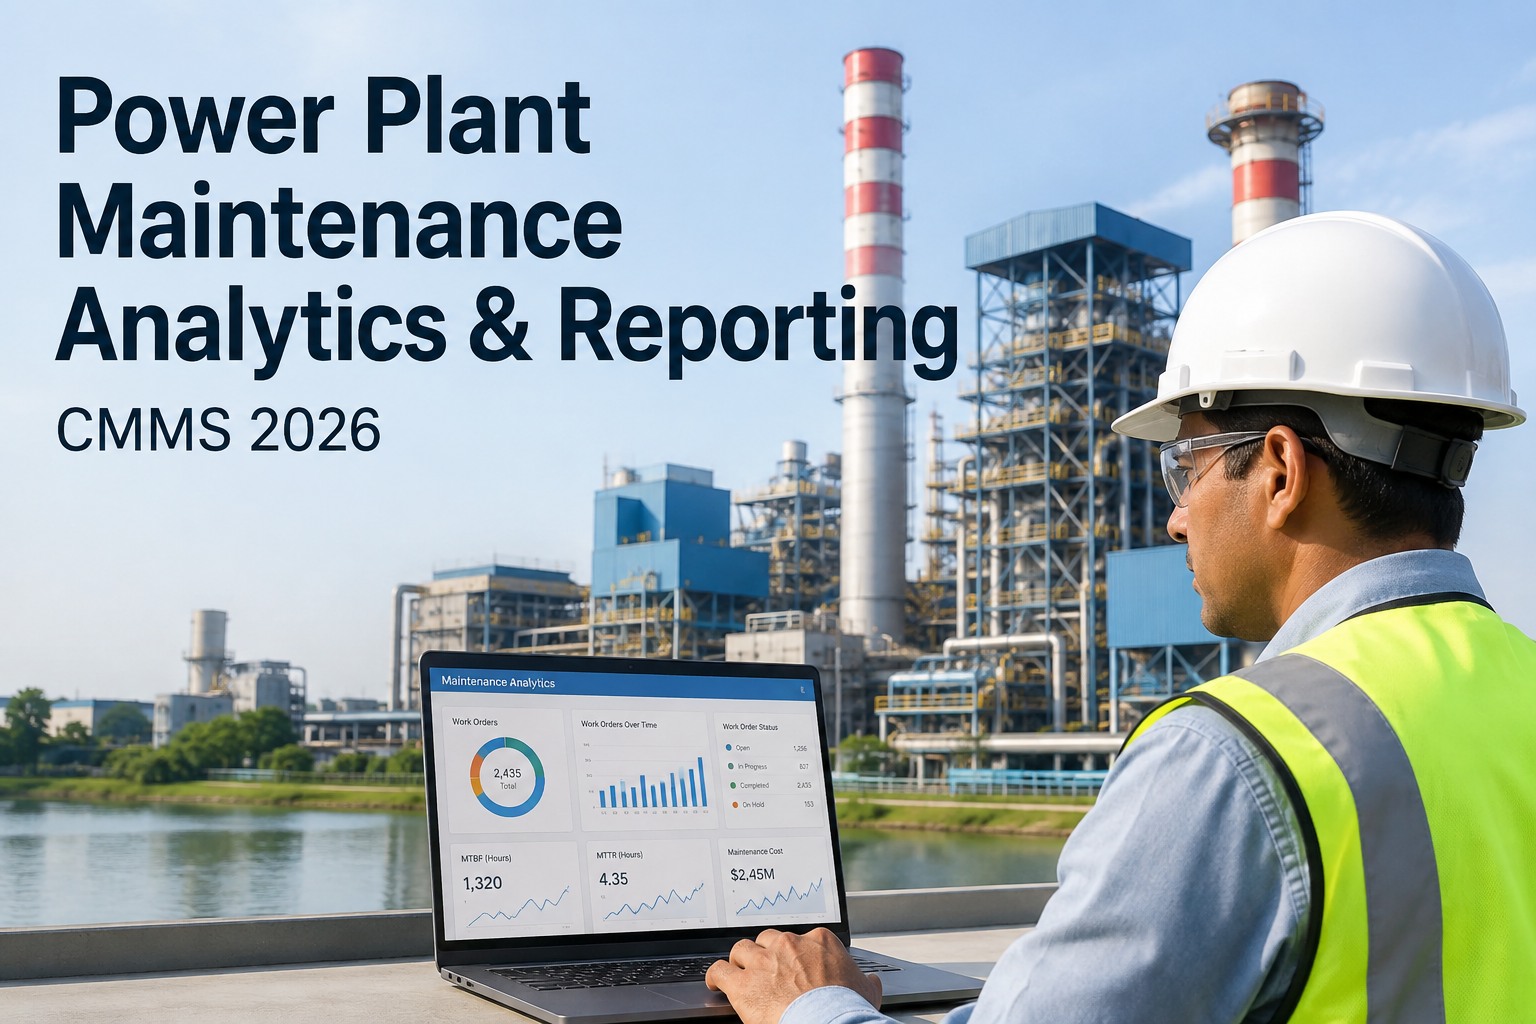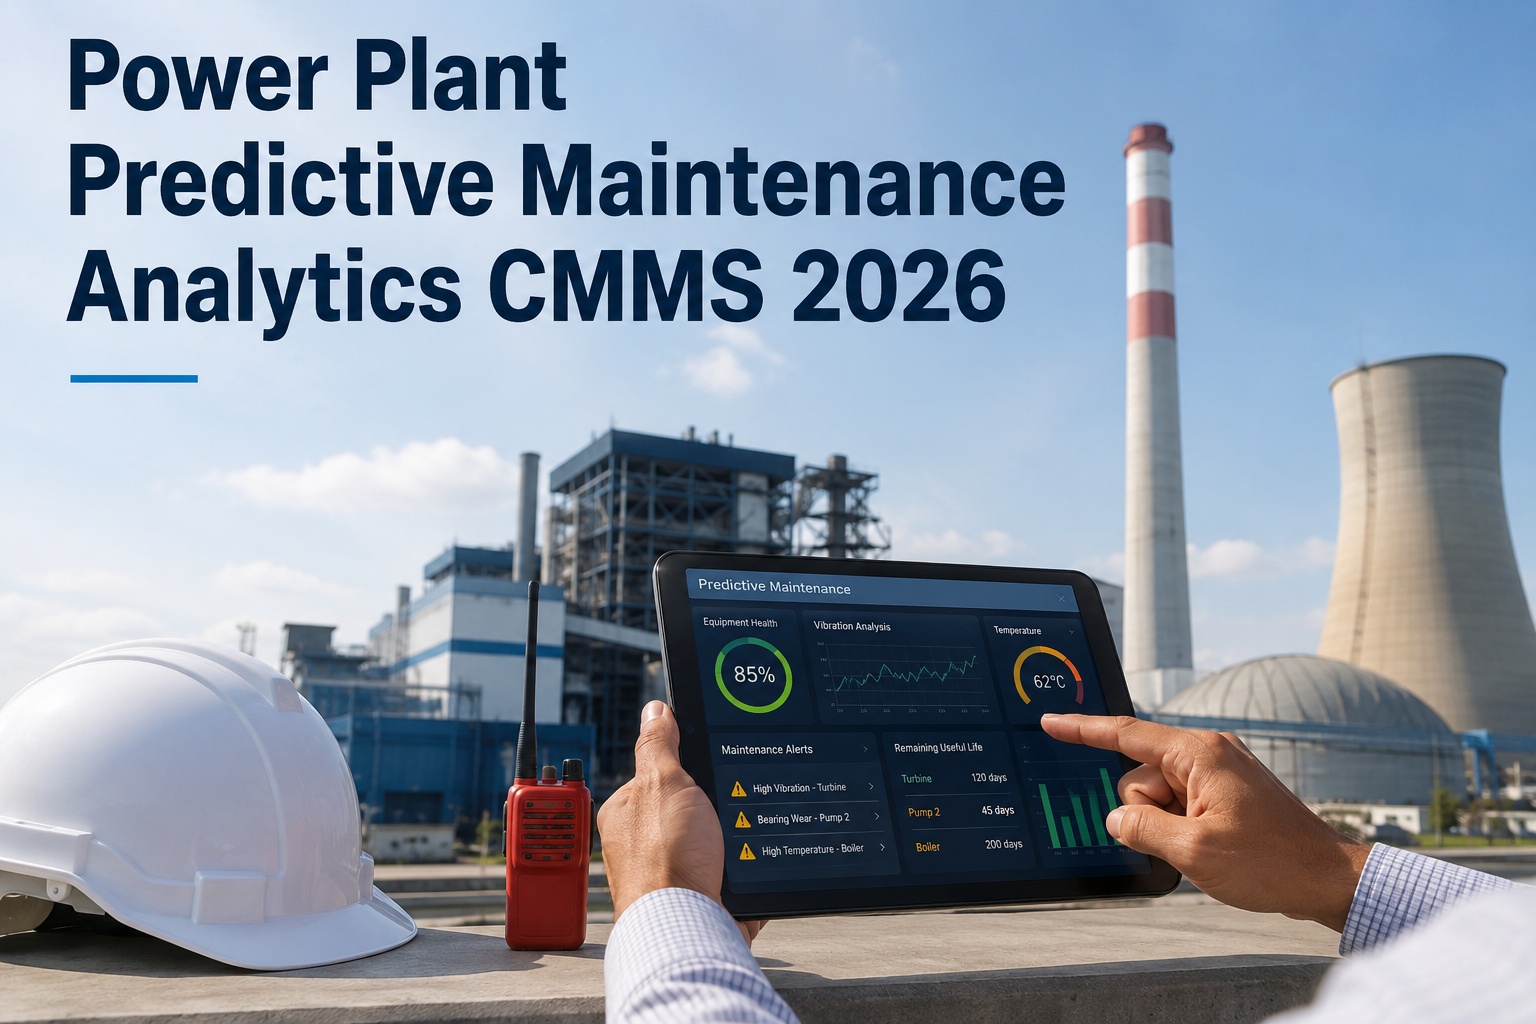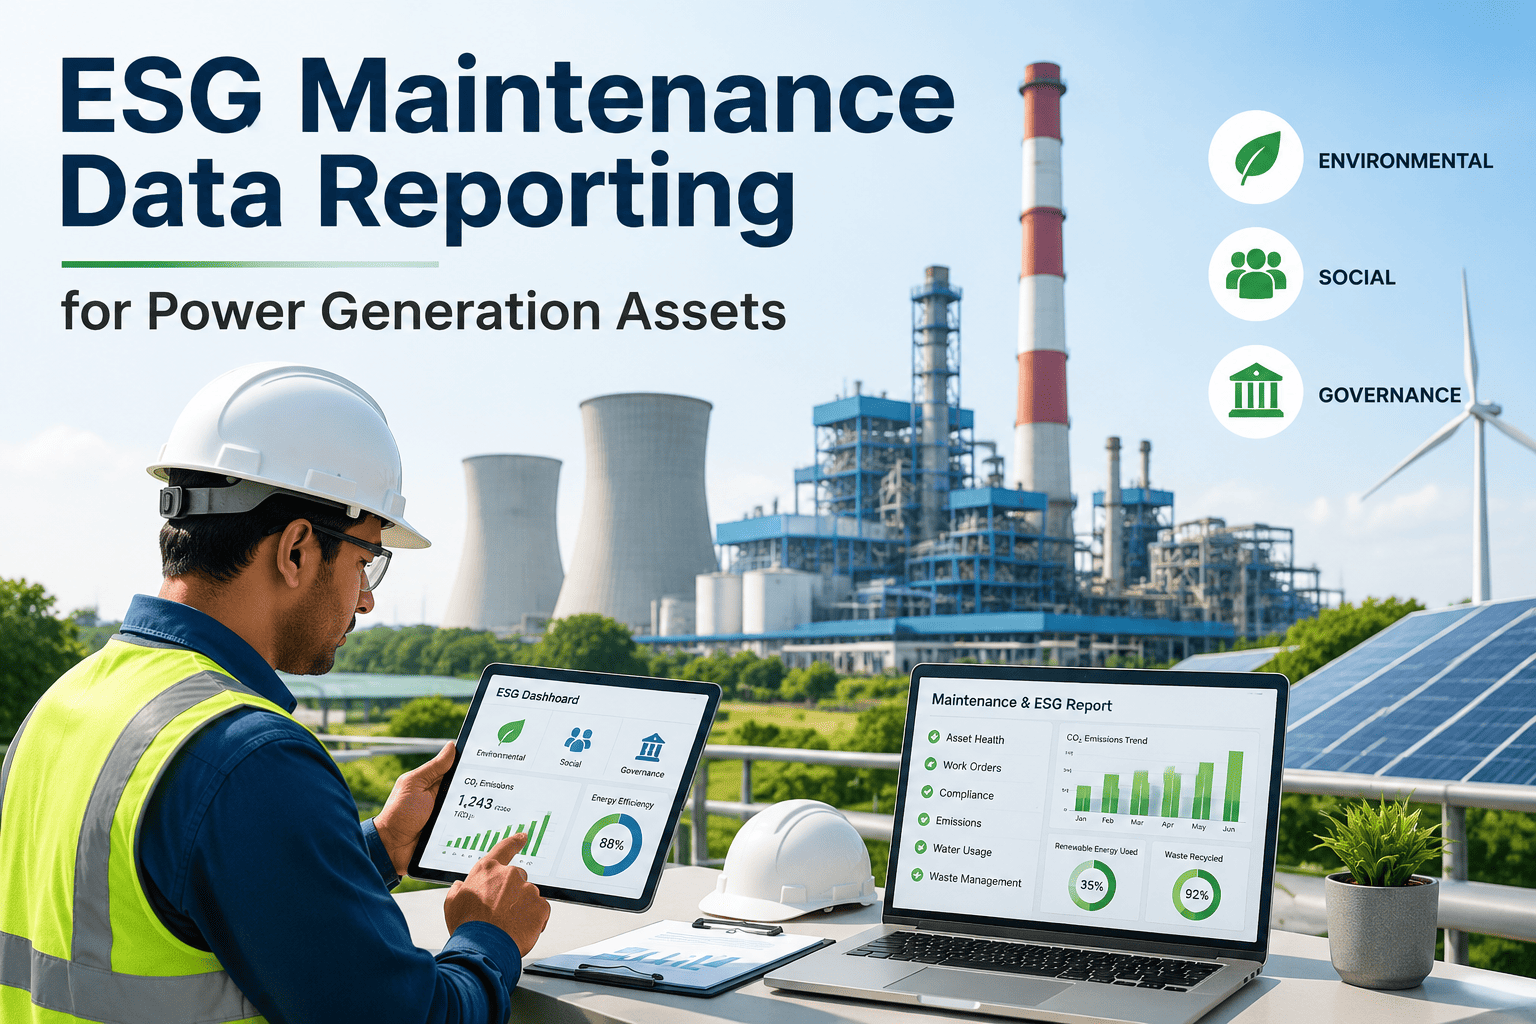
Preventive maintenance compliance is the single most predictive leading indicator available to a power plant manager — more reliable than any lagging metric, more actionable than any incident report. When PM completion rates trend downward across turbines, boilers, or cooling systems, the failure curve follows with a lag that averages weeks to months, not years. Most plants collect this data. The problem is that it lives in work order systems, spreadsheet trackers, and shift logs that no one aggregates in real time, leaving managers to discover a compliance gap at the same time the equipment does. OxMaint Analytics and Reporting delivers a live PM compliance trend dashboard that turns scattered completion data into a single management view — so the trend is visible before it becomes a breakdown. Explore OxMaint Analytics or book a demo with our power generation team.
PM Compliance Trend Dashboard for Power Plant Managers
See the compliance trend before it becomes a failure trend. One live dashboard surfaces PM completion rates across every asset class, crew, and unit — so managers catch the drift weeks before the equipment does.
What Happens Without a Trend View
Compliance data exists in most plants. The issue is that it is not aggregated, not trended, and not acted on until a failure surfaces what the numbers were already showing for weeks.
Four Views Every Plant Manager Needs
From Trend Detection to Manager Action — Automatically
The dashboard is only as useful as the action it drives. OxMaint's alert engine connects the trend view directly to escalation and corrective workflows.
The compliance trend visible in OxMaint today is the failure trend your plant avoids next month. One dashboard, every asset class, live data — and an alert system that acts before the equipment does.
PM Compliance Tracked Across the Entire Plant
Power Plant Managers on the Trend Dashboard
I used to get compliance numbers once a month, assembled by my planner from a spreadsheet. By the time I saw a problem, it had already been a problem for three weeks. Now I see the trend every day, broken down by unit. We caught a consistent drop in cooling tower PM compliance in week two — before anything failed — and the corrective action was in place before week four.
Plant Manager · 500 MW Combined-Cycle · TexasThe compliance-to-failure overlay was eye-opening for our leadership team. We could show, with our own data, that a 10-point drop in turbine PM compliance correlated to three unplanned outage events within six weeks. That quantified the cost of deferred maintenance in a way that changed how we prioritize resource allocation during tight budget periods.
Maintenance Superintendent · Coal Plant · MidwestFrequently Asked Questions
How does the dashboard calculate PM compliance, and what counts as a completed PM?
Compliance is calculated as the percentage of scheduled PMs completed within their defined window — typically the scheduled date plus an allowable grace period that the plant configures, such as plus or minus 10% of the PM interval. A PM is marked complete only when all required checklist steps are finished, readings are entered, and the work order is closed by the technician in OxMaint. Partial completions and tasks closed without required readings do not count as compliant, ensuring the metric reflects actual work quality, not just work order closure. Start free to configure your compliance calculation.
Can we set different compliance targets for different asset classes or criticality tiers?
Yes — compliance thresholds and alert triggers are set independently by asset class, system, or criticality tier. A high-voltage transformer might require 98% compliance with an alert on any single miss, while a secondary cooling pump might allow a threshold of 85% before escalation. This tiered approach ensures alert fatigue does not develop around low-criticality assets while ensuring zero tolerance is maintained where it counts. Plants typically define three to five criticality tiers that map directly to their existing asset criticality register. Book a demo to set up tiered thresholds.
How does the trend dashboard connect to corrective action — does it create work orders automatically?
When the dashboard detects a compliance threshold breach or a sustained downward trend, it surfaces all overdue PMs linked to the underperforming asset class or crew in a prioritized backlog view. From that view, managers can push overdue work orders to the schedule or escalate directly to the maintenance planner with a single action. The system does not reschedule automatically without manager input — it ensures the decision is made by a human with full context, while removing the manual work of identifying what is overdue and what needs to be prioritized first. Start free to see the backlog integration.
Can we use the dashboard for NERC or insurance compliance reporting?
The PM compliance trend dashboard exports structured reports that support NERC reliability standard documentation, insurance underwriting reviews, and internal reliability assurance programs. Reports include compliance rates by asset class, trend history, alert event logs, and corrective action chains for any period, formatted for regulatory review. Plants subject to NERC FAC and MOD standards find that the continuous trend documentation significantly reduces the effort required to respond to audit requests or compliance inquiries. Book a demo to see compliance export formats.
How long does it take to see the first meaningful trend data after going live with OxMaint?
For plants migrating existing PM schedules and work order history into OxMaint, trend data backfilled from historical records becomes available immediately, giving managers a baseline trend view from day one. For plants starting fresh, a meaningful multi-period trend typically develops within four to six weeks as weekly and monthly PMs accumulate completion records. Most plants configure their first alert thresholds during the onboarding session and receive their first automated compliance report within the first week of go-live.
See the Compliance Trend Before the Equipment Does
OxMaint delivers a live PM compliance trend dashboard across every asset class, crew, and unit in your plant — with automated alerts that act when the trend turns, not after the failure arrives.