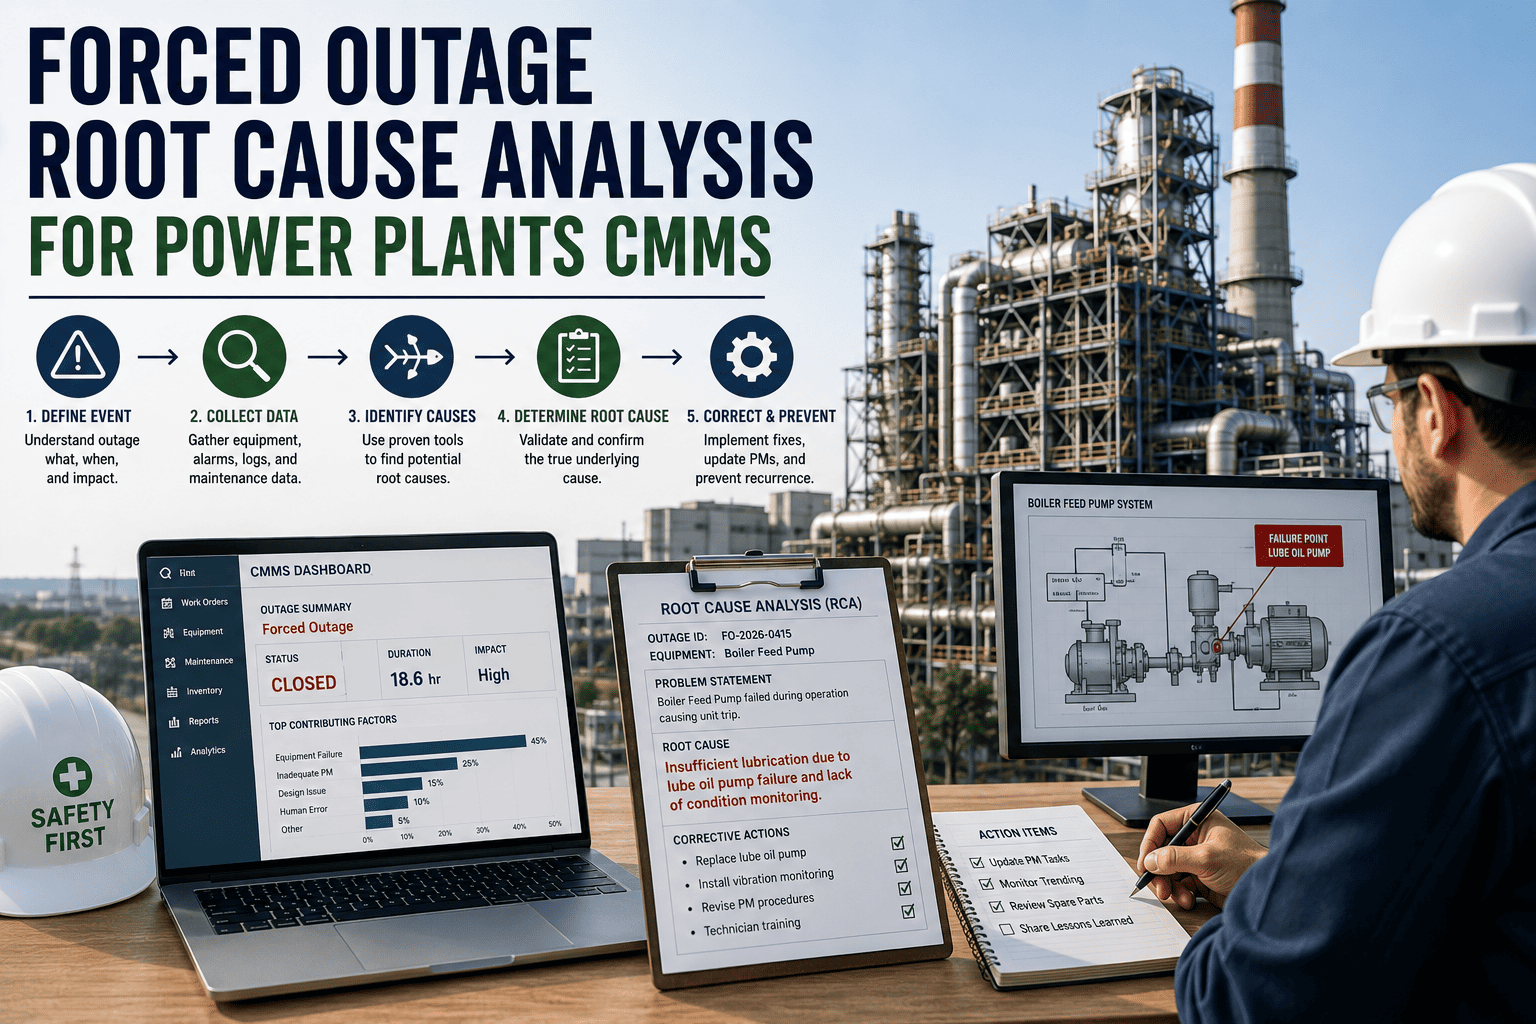
Tracking the right power plant maintenance KPIs in 2026 is the difference betwee catching a bearing failure before a forced outage and explaining a multi-day derate to the board. This benchmark set covers the five metrics regulators and executives actually scrutinize—forced outage rate, turbine MTBF, PM compliance, heat rate deviation, and equivalent availability factor—with realistic industry ranges so you can compare your plant's numbers today. Start a free OxMaint trial to calculate every one of these automatically from your work order history, or book a demo to see the KPI dashboards live.
Power Plant Maintenance KPIs & Benchmarks 2026
Five metrics that separate top-quartile generation plants from the rest—forced outage rate, turbine MTBF, PM compliance, heat rate deviation, and EAF—with the 2026 benchmark ranges reliability managers need to hit.
The five KPIs that define a 2026 power plant maintenance program
Each KPI below pairs a definition, a 2026 benchmark range drawn from NERC GADS and industry data, and the specific CMMS data source that feeds it—so you know exactly which work order field or meter reading to pull from instead of rebuilding a spreadsheet every month.
Forced Outage Rate (FOR)
Headline reliability metric · NERC GADS-reportedForced outage rate is the percentage of hours a unit was unavailable due to unplanned emergencies over total available hours. It is the single number regulators, ISO markets, and boards look at first—because every forced outage hour is revenue lost and grid reliability put at risk.
CMMS capture: OxMaint auto-flags any work order closed against an emergency priority on a critical asset and rolls those hours into FOR by unit, with no manual reconciliation against the shift log.
Turbine MTBF (Mean Time Between Failures)
Leading reliability indicator · OEM-interval linkedMTBF measures the average operating hours between unplanned failure events on the turbine string—calculated as total operating hours divided by the count of unplanned corrective work orders that took the unit out of service. A falling MTBF trend is your earliest warning that a major overhaul is overdue.
CMMS capture: OxMaint calculates MTBF directly from closed corrective work orders tagged to the turbine asset ID, filtered by failure code, and normalized against the unit's run-hour meter.
PM Compliance Rate
Leading indicator of program executionPM compliance is the percentage of scheduled preventive maintenance work orders completed on or before their due date. It is the leading indicator that tells you whether your maintenance plan is actually being executed—or just sitting on a planner's desk. Plants below 85% almost always see FOR climb within two quarters.
CMMS capture: OxMaint compares each PM work order's actual close date against its scheduled due date and reports compliance by asset class, craft, and shift—no manual counting.
Heat Rate Deviation
Efficiency-linked maintenance signalHeat rate deviation measures how far actual Btu/kWh drifts from the unit's design heat rate. When it widens, the cause is almost always maintenance-related: fouled compressor blades, degraded seals, valve packing leaks, or condenser tube fouling. It turns efficiency loss into a maintenance work order trigger.
CMMS capture: OxMaint ingests the DCS heat-rate tag every 15 minutes, compares it to the OEM design curve, and auto-generates an inspection work order when deviation exceeds a configurable threshold.
Equivalent Availability Factor (EAF)
Composite metric · NERC GADS-reportedEAF is the percentage of hours a unit was available to generate at maximum capacity, accounting for planned outages, unplanned outages, and all derates—forced and economic. It is the composite score that ties every other KPI on this page together: if FOR rises, PM slips, or heat rate forces a derate, EAF falls.
CMMS capture: OxMaint pulls outage event hours and derate magnitudes from work order close-out data, classifies them per NERC GADS cause codes, and calculates EAF by unit and fleet automatically.
2026 benchmark summary at a glance
Use this table to benchmark your plant's last 12 months against the ranges top-quartile generation operators are targeting in 2026.
| KPI | What it measures | Top quartile | Median | Bottom quartile | Primary data source |
|---|---|---|---|---|---|
| Forced Outage Rate | Unplanned unavailability hours / available hours | < 2.0% | 3.0 – 5.0% | > 7.0% | Emergency work order hours |
| Turbine MTBF | Operating hours / unplanned failure events | 10,000+ h | 8,000 h | < 6,000 h | Corrective WO + run-hour meter |
| PM Compliance | PMs closed on time / PMs scheduled | ≥ 95% | 85 – 94% | < 85% | PM WO due vs. close date |
| Heat Rate Deviation | Actual Btu/kWh vs. design curve | ±1.5% | 2.0 – 3.5% | > 4.0% | DCS heat-rate tag |
| Equivalent Availability (EAF) | Available hours incl. derates / period hours | ≥ 92% | 85 – 89% | < 80% | Outage + derate event log |
How OxMaint captures every KPI out of the box
No spreadsheet exports, no end-of-month reconciliation. Each KPI below is calculated from data your team already enters into the CMMS during normal work execution.
Auto-classified outage events
Every emergency-priority work order on a critical asset is tagged, timed, and rolled into the forced outage rate calculation by unit—NERC GADS cause codes assigned at close-out.
Failure-code trend engine
Corrective work orders tagged to the turbine asset ID feed a live MTBF trend, filtered by failure code and normalized against the unit's run-hour meter reading.
Compliance dashboard by craft
PM work orders are compared against their scheduled due date automatically, with compliance reported by asset class, craft, and shift—drill down to the overdue WO in one click.
DCS-linked deviation alerts
The heat-rate tag is ingested every 15 minutes and compared to the OEM design curve; when deviation breaches your threshold, an inspection work order generates automatically.
GADS-ready availability calc
Outage hours and derate magnitudes from work order close-out data are classified per NERC GADS codes and compiled into EAF by unit and fleet—exportable for regulatory filing.
Trend + target tracking
Set your 2026 target for each KPI and OxMaint plots actual vs. target on a rolling 12-month trend, with variance flags emailed to the reliability team weekly.
From spreadsheet to dashboard in one outage cycle
Import your asset hierarchy
Load turbines, boilers, BOP equipment, and criticality ratings from your existing spreadsheet or legacy CMMS. OxMaint maps them to NERC GADS unit IDs.
Connect the DCS and meters
Stream run-hour meters and the heat-rate tag so MTBF, heat rate deviation, and EAF calculate from live operational data—not manual entry.
Set your 2026 targets
Enter the benchmark ranges from this page as your targets. OxMaint flags any KPI trending outside the top-quartile band on the reliability dashboard.
Run one outage cycle
After a single planned or forced outage, all five KPIs populate with real data—and your monthly reliability report builds itself.
Frequently asked questions
What is a good forced outage rate for a power plant in 2026?
A top-quartile forced outage rate is below 2.0% of available hours. The industry median sits between 3.0% and 5.0%, and anything above 7.0% puts a plant in the bottom quartile and invites scrutiny from regulators and ISO market monitors. OxMaint calculates FOR automatically from emergency-priority work order hours.
How do you calculate turbine MTBF from CMMS data?
Divide the turbine's total operating hours by the count of unplanned corrective work orders that took the unit out of service during that period. In OxMaint, you filter corrective work orders by the turbine asset ID and a failure code, then the system normalizes against the run-hour meter—no manual spreadsheet math required.
Why is PM compliance considered a leading indicator?
Because it measures whether your maintenance plan is actually being executed on schedule, not whether failures have already happened. Plants with PM compliance below 85% almost always see forced outage rate climb within two quarters. Tracking it weekly lets you intervene before the lagging metrics move.
What heat rate deviation should trigger a maintenance work order?
A deviation greater than 4.0% from the OEM design curve is the standard action threshold. Top-quartile plants hold deviation within ±1.5%. In OxMaint, you set the threshold and the system auto-generates an inspection work order—typically targeting compressor fouling, seal degradation, or condenser tube fouling—when it is breached.
Does OxMaint generate reports in NERC GADS format?
Yes. Outage events and derates captured in OxMaint are classified per NERC GADS cause codes at work order close-out, and the system compiles them into the equivalent availability factor (EAF) calculation by unit and fleet. The output is exportable in a GADS-ready structure for regulatory filing.
Stop calculating KPIs by hand. Start managing from them.
OxMaint tracks all five 2026 power plant maintenance KPIs out of the box—forced outage rate, turbine MTBF, PM compliance, heat rate deviation, and EAF—with live dashboards your reliability team can act on today.