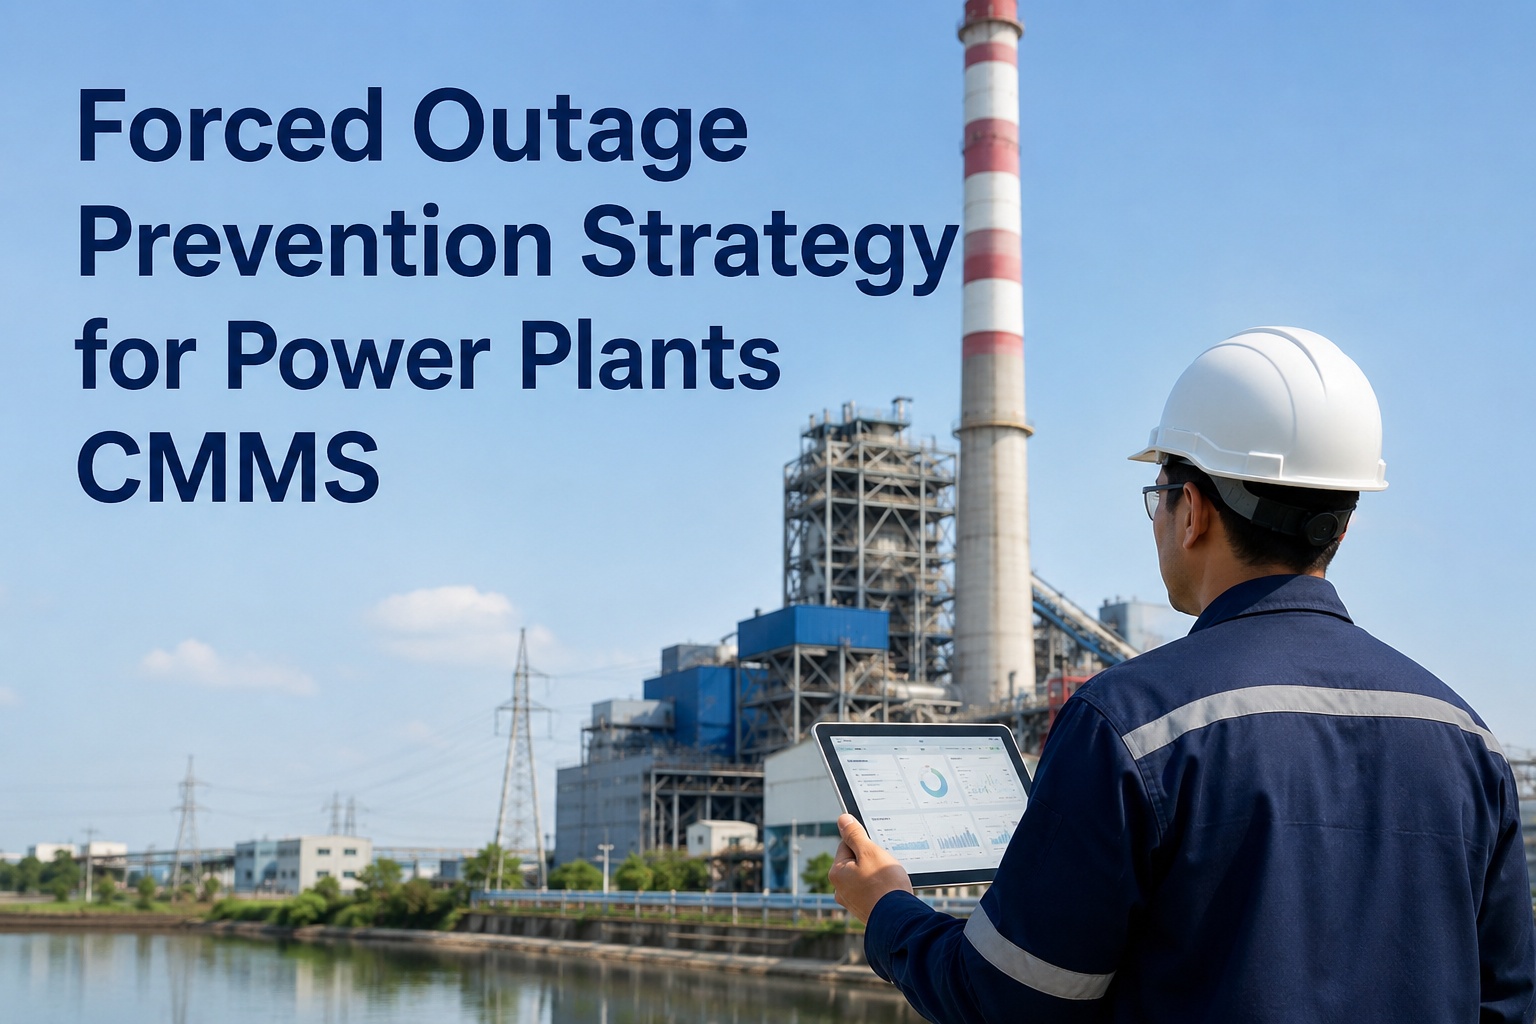
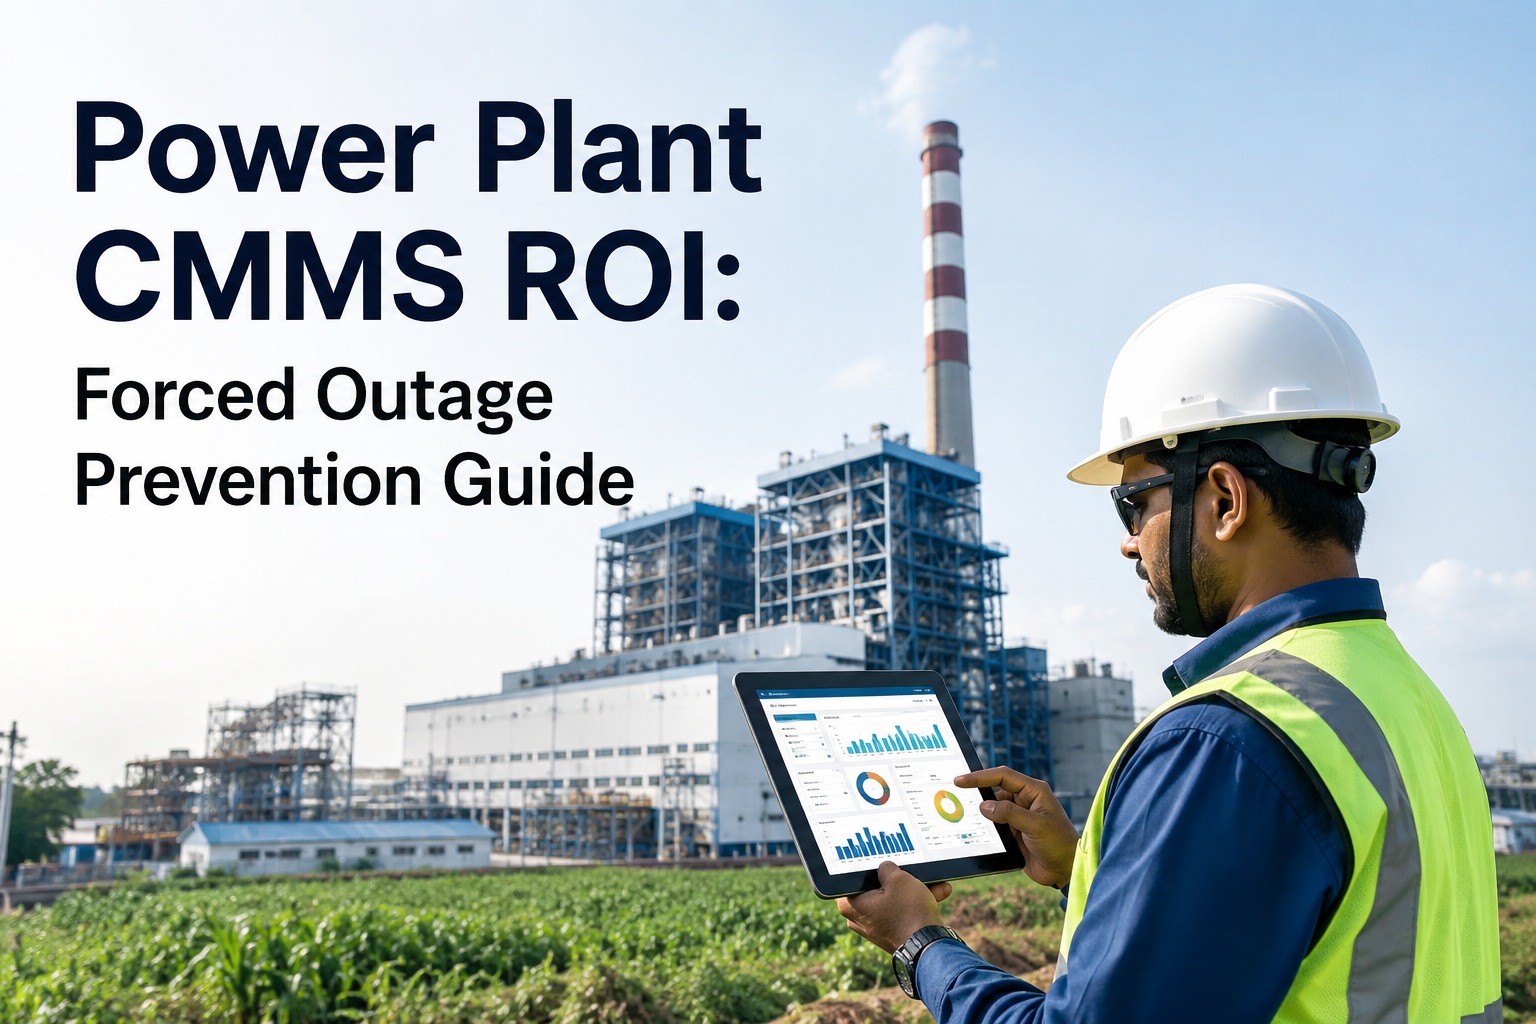
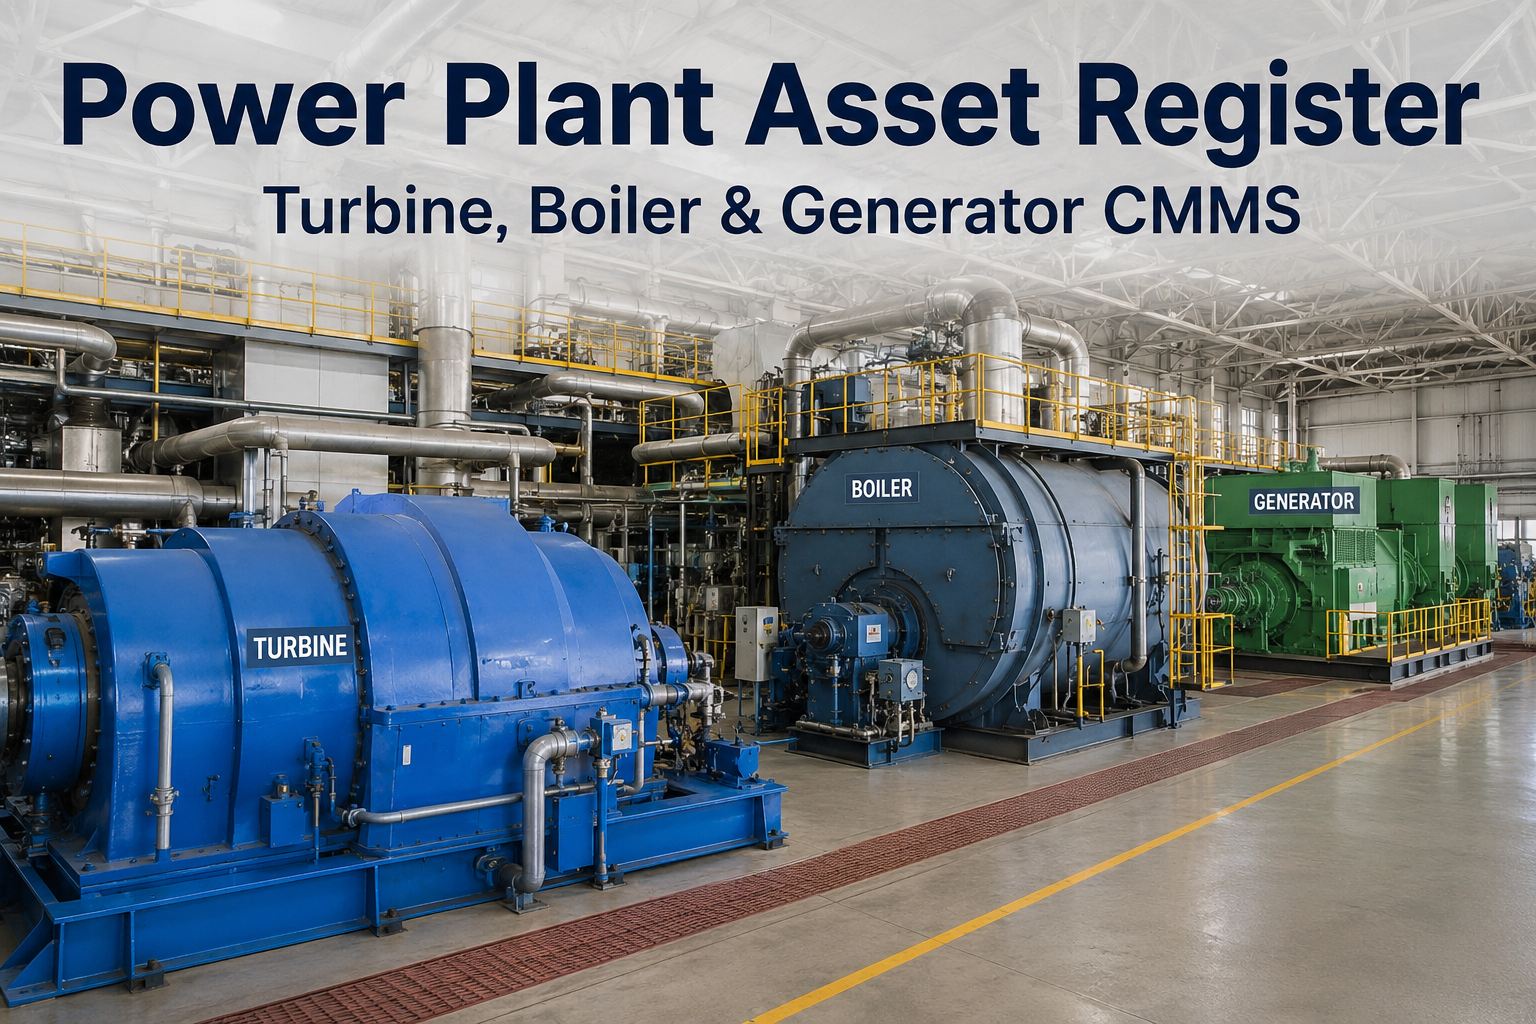
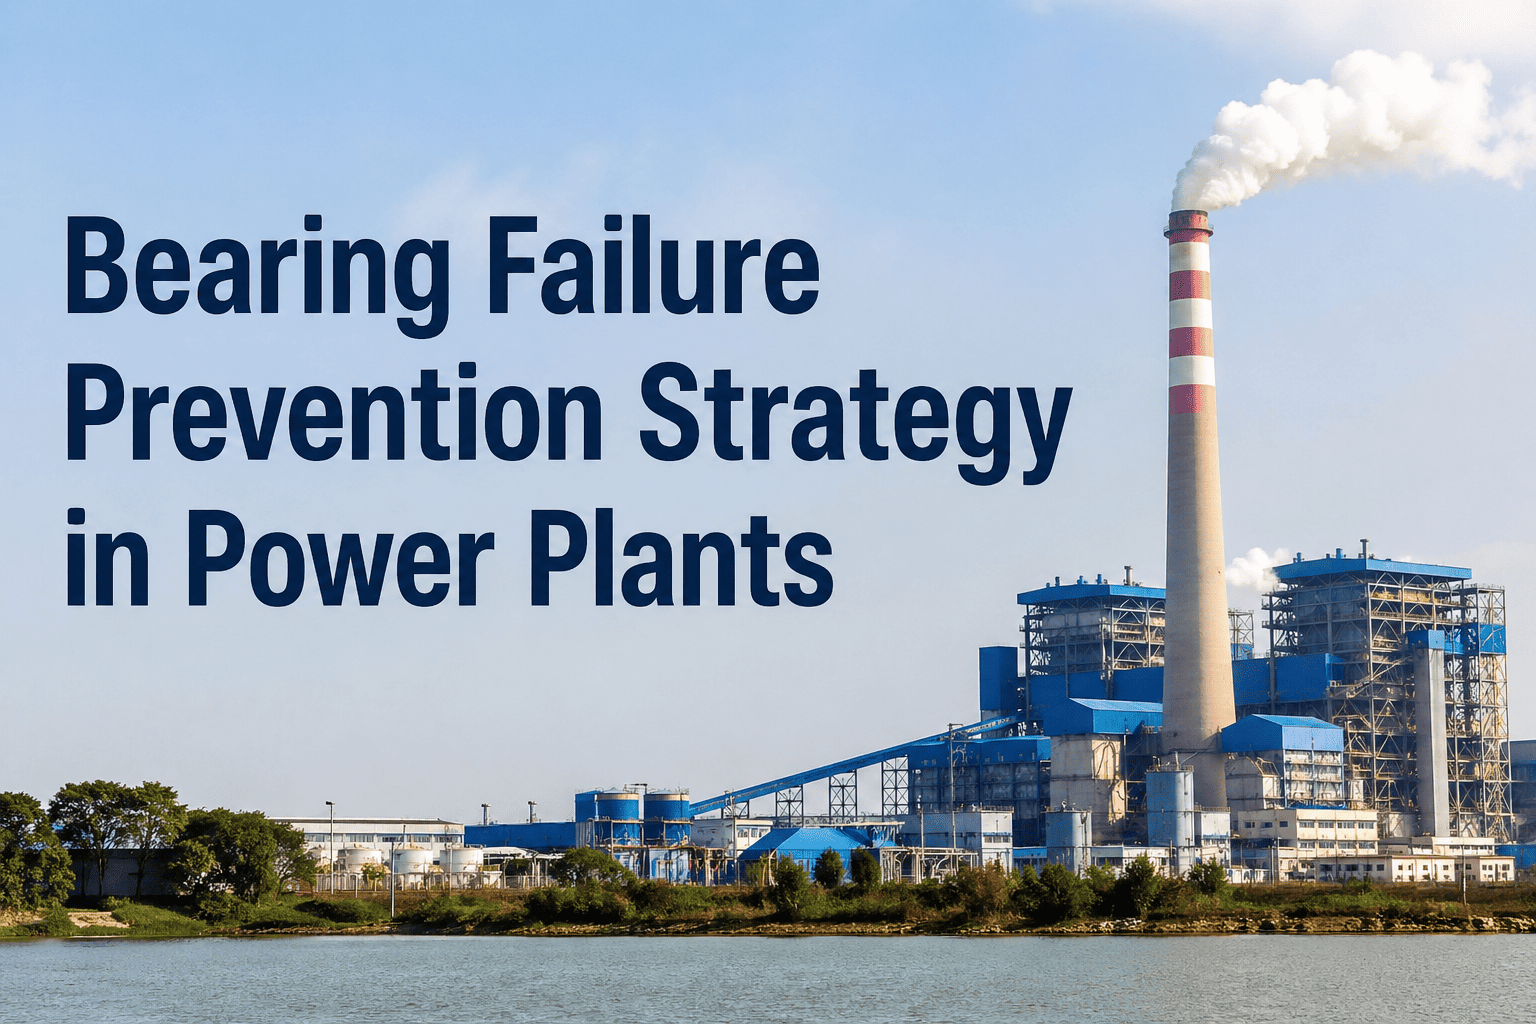
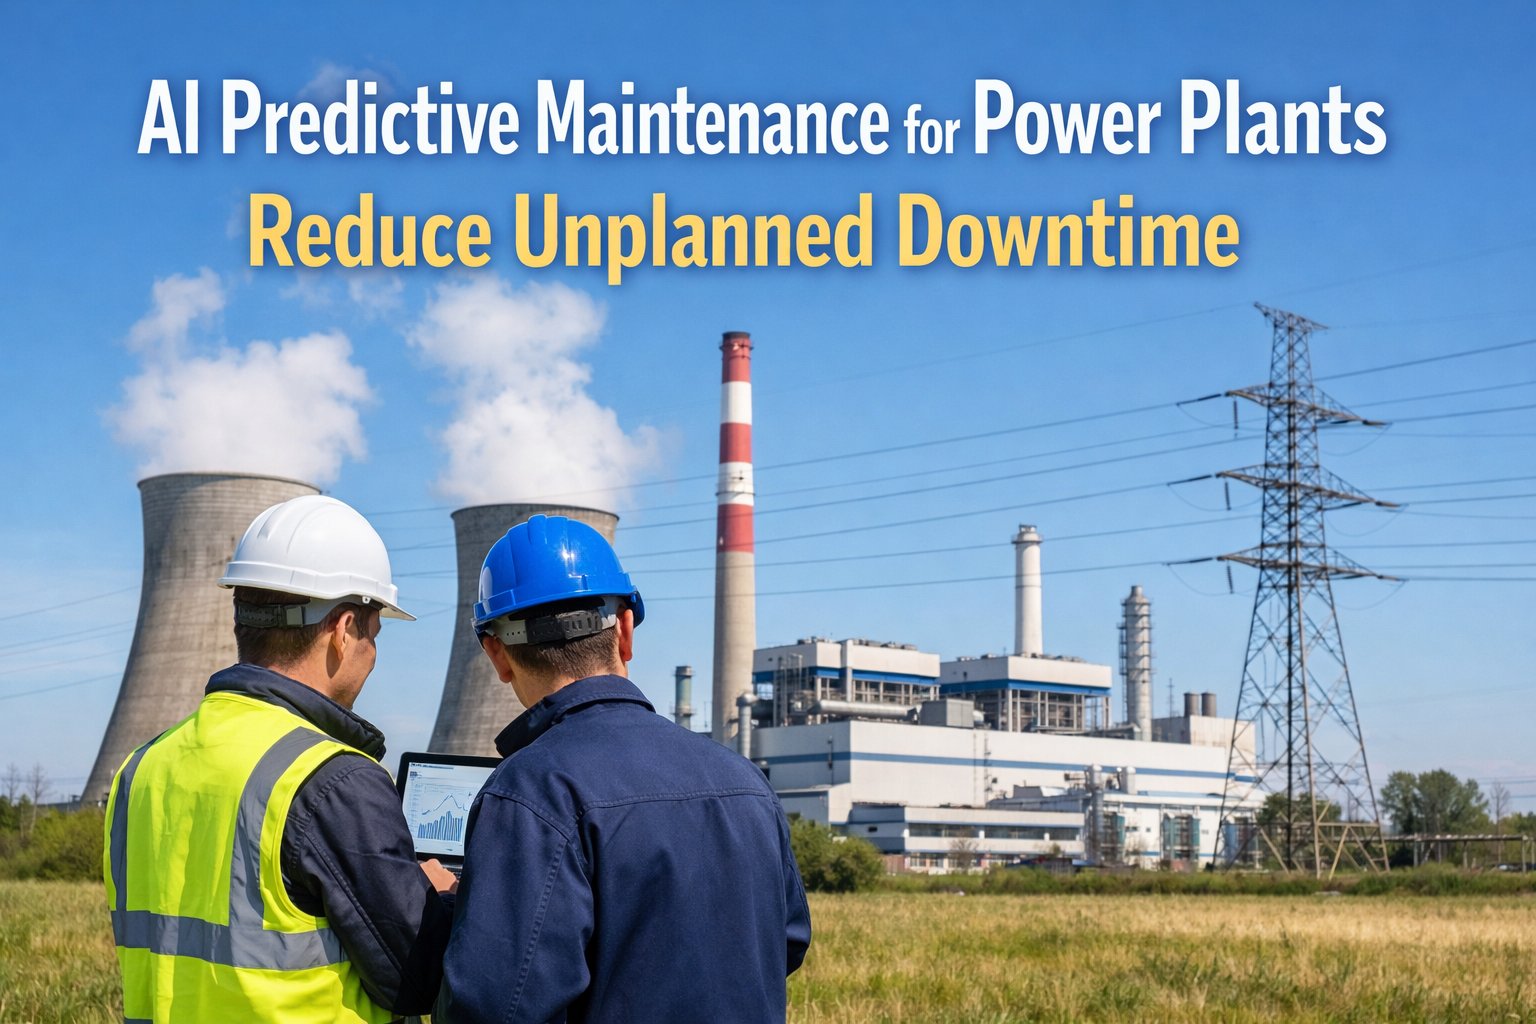
Most forced outages do not arrive without warning. A bearing runs warmer for weeks, a vibration reading creeps upward, a transformer gas level drifts, a leak is noted on a round sheet and forgotten. The signal exists, but it sits in a logbook, a historian or someone's memory, and the first time it becomes a work order is when the unit trips. Preventing forced outages is mostly about shortening the path from early signal to scheduled action. OxMaint AI maintenance management software connects inspections, condition findings, work orders and preventive plans in one platform for power generation assets.
Power Plant Reliability · Forced Outage Prevention · Maintenance Strategy
Power Plant Forced Outage Prevention: Maintenance Strategies.
Forced outages are costly because the first sign of trouble is not acted on in time. OxMaint AI links inspection and condition findings to prioritised work orders and recurring PM across your boilers, turbines, pumps and electrical assets, so developing faults get scheduled while there is still time to plan.
1Inspect & monitor
rounds, readings, condition checks
→
2Flag the defect
asset, severity, photos
→
3Work order
prioritised and assigned
→
4Planned PM
fixed into the next window
FOR
forced outage rate: forced outage hours ÷ (forced outage hours + service hours)
5 levels
of maintenance strategy, from reactive to reliability-centred
6 systems
where forced outages commonly originate
90 days
to a working prevention plan
The Warning Window: Where Failures Can Still Be Planned
Every failure develops over time. The earlier you detect it, the more choice you have about when and how to fix it. Condition monitoring and routine inspection are about widening this window. Start free and capture findings at the first sign.
Normal
Detectable
Noticeable
Failure
HealthyRoutine PM keeps it here
Vibration, oil, thermal, thickness data show changeBest time to plan the fix
Noise, heat, leaksFix soon, with less choice
Trip or forced outageUnplanned, costly
Know the Number: Forced Outage Rate
Maintenance Strategy Ladder
Plants rarely use one strategy everywhere. The right level depends on how critical the asset is and how it fails. Book a demo to assign a strategy to each asset.
1 · ReactiveRun to failure. Only for low-criticality, easily replaced items.
2 · PreventiveTime or usage-based tasks: lubrication, inspections, calibration.
3 · Condition-basedAct when inspection or readings cross a limit.
4 · PredictiveTrend data to forecast remaining life and plan the repair.
5 · Reliability-centredChoose the strategy per failure mode, based on consequence.
Where Forced Outages Commonly Start
Each system has early indicators worth watching and a technique to catch them. Start free and set inspection routes per system.
Boilers & HRSGs
Watch: tube leaks, deposits, metal temperatures.
Tools: thickness trending, water chemistry, visual outage inspection.
Turbines & Generators
Watch: vibration, bearing temperature, lube oil condition.
Tools: vibration analysis, oil analysis, borescope.
Pumps & Fans
Watch: seal leaks, bearing wear, flow and pressure drift.
Tools: vibration, thermography, performance trending.
Electrical & Transformers
Watch: hot connections, insulation condition, gas in oil.
Tools: thermography, insulation tests, dissolved gas analysis.
Controls & Instruments
Watch: drifting sensors, failed trips, spurious alarms.
Tools: calibration schedules, loop checks, alarm review.
Cooling Water & Condenser
Watch: fouling, leaks, vacuum loss.
Tools: cleanliness checks, chemistry, eddy current testing.
If the Warning Lives in a Logbook, It Is Not a Warning Yet.
A finding only prevents an outage when it becomes an owned, scheduled task. OxMaint AI turns inspection results into work orders with priority and due dates, and keeps the full history on each asset.
A 90-Day Plan to Reduce Forced Outage Risk
You do not need a plant-wide overhaul to start. Work in three stages. Book a demo and map this plan to your units.
Days 1–30
Know your risks
- List critical assets per unit
- Review past forced outage causes
- Load assets and history into the system
Days 31–60
Build the routine
- Set PM and inspection routes
- Create condition check templates
- Assign owners and due dates
Days 61–90
Close the loop
- Set alert limits and triggers
- Convert findings to work orders
- Review KPIs and adjust strategy
Reliability KPIs Worth Tracking
Forced outage rate
Trend per unit and by cause.
MTBF
Mean time between failures for critical assets.
PM compliance
Share of planned tasks completed on time.
Planned vs unplanned work
A rising planned share signals control.
Backlog age
How long identified defects wait.
How OxMaint AI Supports Plant Reliability
Asset Hierarchy
Plant, unit, system and component with full history.
Inspection Rounds
Mobile checklists with readings and photos.
Defect to Work Order
Prioritised, assigned and tracked to closure.
Recurring PM
Time, runtime and condition-based schedules.
Outage Planning
Collect deferred work for the next window.
Failure History
Causes and repairs stored per asset.
Frequently Asked Questions
How do you prevent forced outages in a power plant?
Find developing faults early through inspection and condition monitoring, turn findings into prioritised work orders, and keep PM current on critical assets.
Start free and build your plan.
What is forced outage rate?
Forced outage hours divided by the sum of forced outage hours and service hours, expressed as a percentage. Check your reporting standard for the exact definition.
Book a demo of reliability tracking.
What is the difference between preventive and predictive maintenance?
Preventive tasks run on a schedule. Predictive maintenance uses condition data to forecast when work is needed. Most plants use both.
Start free and combine them.
Which equipment causes the most forced outages?
It varies by plant, but boilers, turbines, pumps, electrical systems and controls are common sources. Your own outage history is the best guide.
Book a demo of failure history.
How does a CMMS help reduce unplanned downtime?
OxMaint AI keeps inspections, defects, work orders and PM linked on each asset, so warning signs become scheduled work.
Start free and see it work.
Act on the Warning While It Is Still a Choice.
Capture the finding, assign the work, schedule the fix and keep the history on the asset. Start with one unit and see how much earlier problems surface.