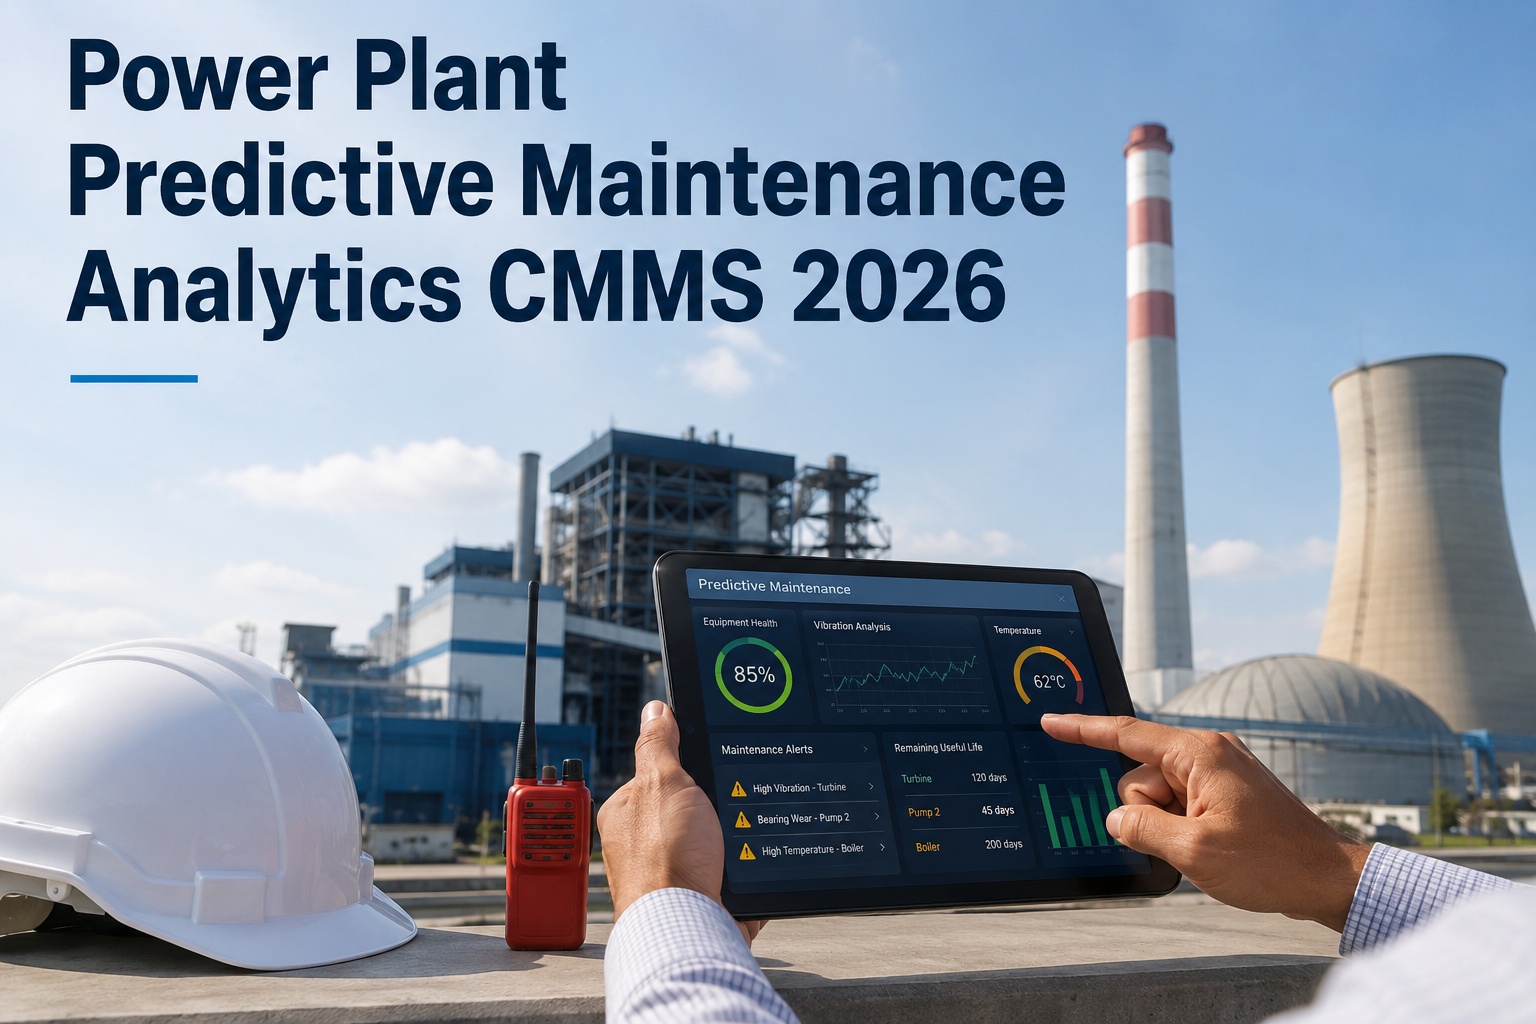
The power plants running at 95%+ availability in 2026 did not get there by working harder — they got there by working systematically. They mapped every failure mode, prioritized every asset by consequence, matched every maintenance task to the right strategy, and built the data discipline to prove it was working. This guide gives every plant maintenance team — from plants still dominated by reactive work to programs ready to deploy AI-driven condition monitoring — the full strategic roadmap for the shift from firefighting to predictive reliability. The journey has four stages, each with clear milestones, and OxMaint is purpose-built to support every one of them. Start a free OxMaint trial and begin your reliability transformation today, or book a strategy consultation to assess where your plant stands on the maturity model.
Maintenance Strategy · Predictive Maintenance AI
Power Plant Maintenance Strategy 2026: From Reactive to Predictive
Build a modern maintenance program using the right mix of PM, condition-based monitoring, predictive analytics, outage planning, and CMMS dashboards — and move your plant up the reliability maturity curve in 12 months.
The Maintenance Maturity Model: Where Is Your Plant?
Every power plant sits somewhere on the maturity curve. Most know the symptoms of where they are — they just have not seen the pathway to move forward. Identify your stage, then use the roadmap below to advance one level at a time.
Stage 1
Reactive
Run to failure is the dominant strategy. PM exists on paper but compliance is below 60%. Maintenance cost is unpredictable, availability is below 85%, and the planning team spends most of its time expediting emergency parts.
Signal: Planned maintenance below 60% of total work
Stage 2
Preventive
Time-based PMs are in place and compliance is above 80%. Work orders are planned in advance. The maintenance program is stable but still calendar-driven — resources are sometimes over-spent on assets that did not need work.
Signal: PM compliance 80–90%, but some repeat failures still occurring
Stage 3
Condition-Based
Vibration analysis, thermography, and oil analysis are in use for critical assets. Maintenance decisions are informed by condition data, not just elapsed time. PM intervals are optimized for the most critical equipment classes.
Signal: CBM coverage on Tier A assets, MTBF trending upward
Stage 4
Predictive
SCADA and sensor data feeds AI anomaly detection. Failure modes are intercepted 3–6 weeks before occurrence. Outage scope is known before shutdown. The maintenance program is proactive, cost-efficient, and continuously self-improving from failure-code feedback loops.
Signal: Forced outage rate below 3 events/year, availability above 95%
Strategy by Asset Criticality: Not One Size Fits All
Applying predictive maintenance to every asset regardless of consequence wastes resources and creates alert fatigue. The right maintenance strategy depends on what happens when the asset fails — and what condition monitoring can actually detect in advance.
| Asset Class |
Examples |
Correct Strategy |
Key Monitoring Parameters |
Wrong Approach |
| Critical — No Redundancy |
Gas turbine, main generator, HP steam turbine |
CBM + Predictive + Time-based overlay |
Vibration, temperature, EOH, efficiency |
Time-based only — misses condition-driven failures |
| Essential — Limited Redundancy |
Lube oil pumps, cooling water system, fuel gas compression |
Preventive + Condition-based |
Vibration, bearing temp, flow, pressure differential |
Run-to-failure — failure cascades to critical asset |
| General — Standby Available |
Auxiliary pumps, HVAC, lighting, non-critical instrumentation |
Run-to-failure with PM inspection |
Visual inspection on rounds |
Full CBM program — no ROI, overwhelms technicians |
| Regulatory — Safety Critical |
Relief valves, safety instrumented systems, fire suppression |
Mandatory interval testing + documentation |
Functional test results, certification dates |
Condition-based deferral — regulatory compliance is non-negotiable |
The 12-Month Transformation Roadmap
Months 1–3
Foundation: Data and Asset Register
Audit and clean the asset register — every maintainable asset at correct hierarchy level with criticality tier assigned
Standardize failure codes across all equipment classes using ISO 14224-aligned taxonomy
Enforce CMMS as the single system of record — close all parallel Excel trackers and shadow databases
Establish baseline KPIs: MTBF, MTTR, PM compliance, planned maintenance percentage, backlog weeks
Months 4–6
Optimization: PM Program Rationalization
Conduct PM rationalization review — eliminate tasks with no failure consequence, extend intervals on low-risk assets, add inspections on high-consequence equipment
Launch vibration monitoring program on Tier A rotating equipment — gas turbines, major pumps, compressors
Implement HRSG tube thickness trending and chemistry monitoring workflows
Target 90%+ PM compliance and 75%+ planned maintenance percentage by end of this phase
Months 7–9
Intelligence: Condition-Based Maintenance Rollout
Connect SCADA historian data feed to CMMS — map sensor parameters to asset records in OxMaint
Establish operating baselines for all Tier A assets — build alert thresholds for advisory, warning, and alarm levels
Launch condition-based work order workflow — sensor alert generates work order routed to correct crew automatically
Train technicians to record failure codes on every corrective work order — this is the data that trains the AI model
Months 10–12
Predictive: AI Analytics and Continuous Improvement
Enable OxMaint AI anomaly detection — model trains on 6 months of operational and failure data from your specific fleet
Publish live KPI dashboards to executive, plant manager, and reliability engineer audiences in Power BI
Conduct first annual PM optimization review using failure frequency data — adjust intervals based on actual failure evidence, not OEM defaults
Benchmark your plant's KPIs against fleet and industry — identify the top two to three improvement levers for the next 12-month cycle
Where is your plant on the maturity curve — and what does the next level require?
OxMaint supports every stage of the transformation — from asset register cleanup to AI anomaly detection. Start with what your program needs now, and scale as your data matures.
KPIs That Show Your Strategy Is Working
Planned Maintenance %
Target: 85%+
The clearest indicator of program maturity. Below 60% means firefighting. Above 85% means the program is in control and driving work rather than reacting to it.
PM Compliance
Target: 95%+
PMs not completed become failures 3–6 months later. Sustained compliance above 95% is what separates plants that prevent failures from plants that manage them.
MTBF by Asset Class
Target: Rising trend
Mean time between failures trending upward over 12 months is the proof that your PM and CBM investments are reducing the underlying failure rate. A flat or declining MTBF means the strategy is not working.
Forced Outage Rate
Target: Below 3 events/year
World-class CCGT plants experience fewer than 3 forced outage events per year. Every event above that number is a measurable revenue loss that a stronger predictive program would have prevented.
Maintenance Cost % RAV
Target: Under 2%
Maintenance cost as a percentage of replacement asset value is the CFO's benchmark. Above 3% signals systemic maintenance failure or asset end-of-life requiring a capital decision.
Work Order Backlog
Target: 3–6 weeks
Healthy backlog is 3–6 weeks of work. Below 3 means the planning team is not generating enough proactive work. Above 6 means the team is structurally under-resourced for the program scope.
Frequently Asked Questions
How long does it take to move from reactive to condition-based maintenance?
Most power plants can reach condition-based maintenance maturity in 9–12 months with a structured program. The critical prerequisite is a clean asset register with criticality rankings in the CMMS — without that foundation, CBM alert routing and work order assignment cannot function correctly.
Start your OxMaint trial to begin the asset register cleanup as step one.
What is the ROI of moving from PM-only to predictive maintenance?
Industry benchmarks show that plants transitioning from pure time-based PM to a predictive program achieve 14–25% reduction in maintenance cost per MWh, 20%+ improvement in MTBF, and 30–50% reduction in forced outage events over a 24-month period. The ROI is driven primarily by avoided forced outage losses — which for a typical CCGT unit run $50,000–$150,000 per hour.
How does OxMaint support outage planning as part of the maintenance strategy?
OxMaint automatically compiles planned outage scope from: overdue PMs, assets with condition alerts, inspection intervals falling within the outage window, and regulatory work due. The outage plan is pre-populated 6 weeks before entry — giving the supply chain team time to source parts and the engineering team time to review scope before the unit cools down.
Book a demo to see the outage planning workflow live.
Which part of the maintenance strategy improvement delivers the fastest results?
PM compliance improvement consistently delivers the fastest measurable results — typically visible in MTBF trends within 3–6 months. The reason is simple: most power plant failure events are directly traceable to PMs that were overdue or not completed. Fixing compliance before investing in CBM or predictive analytics ensures the foundation is stable before adding complexity.
The plants setting availability records in 2026 started this transformation in 2024. There is still time to close the gap.
OxMaint gives your plant the CMMS foundation, condition monitoring integration, predictive analytics, and KPI dashboards to execute every stage of the reliability journey — from where you are now to where world-class plants operate.