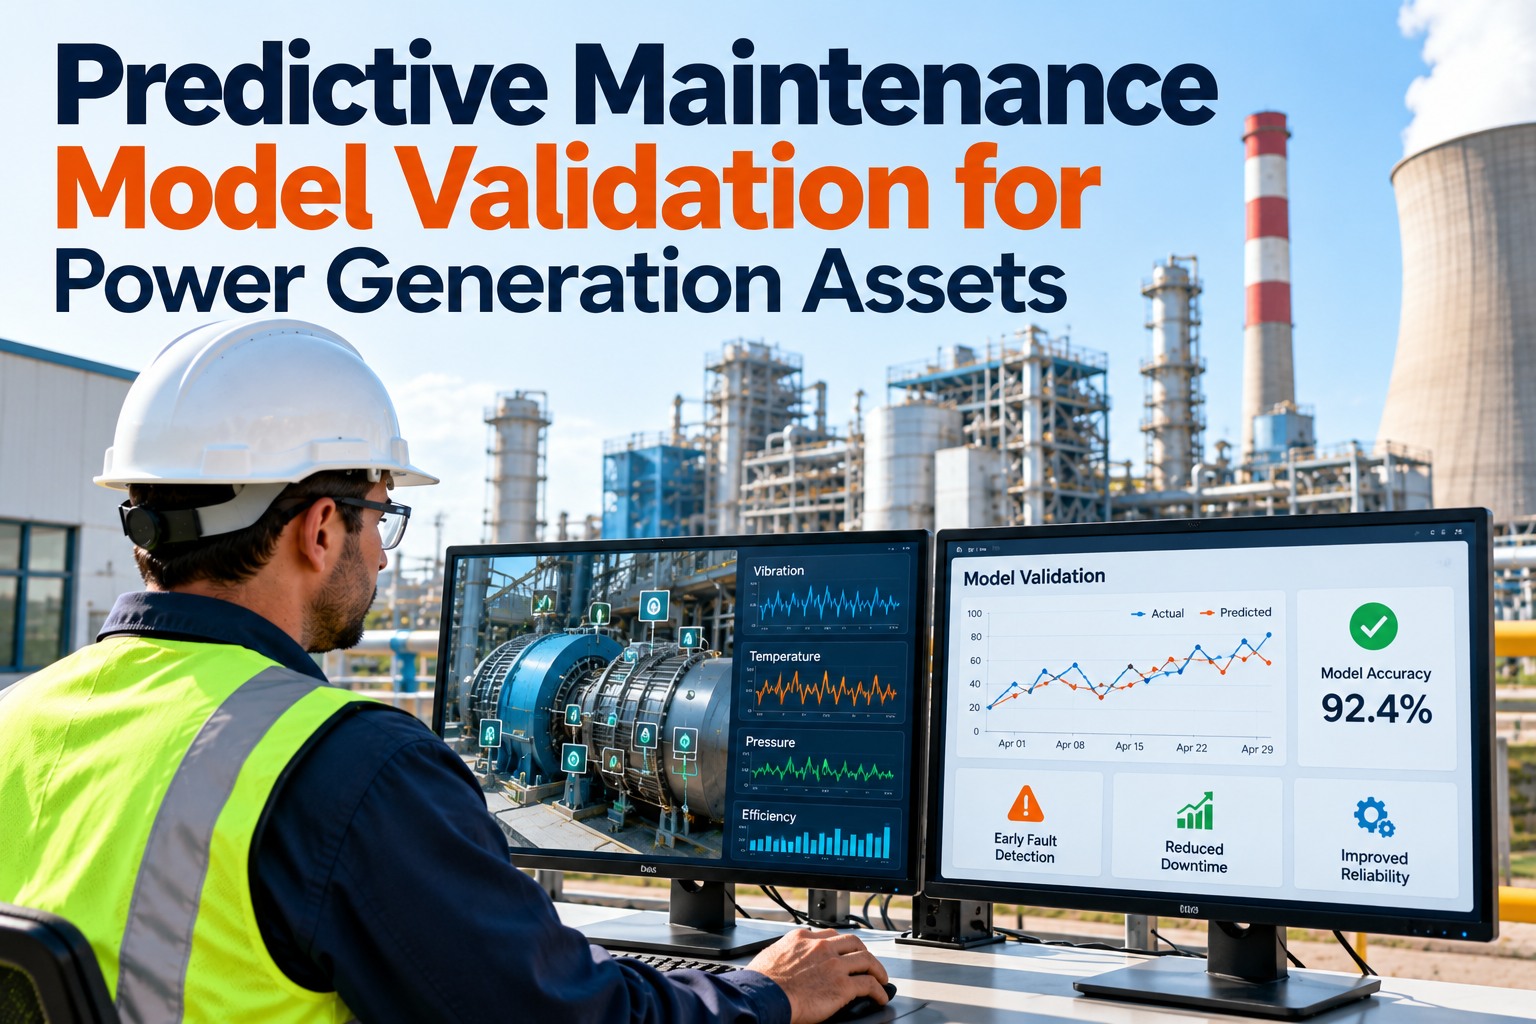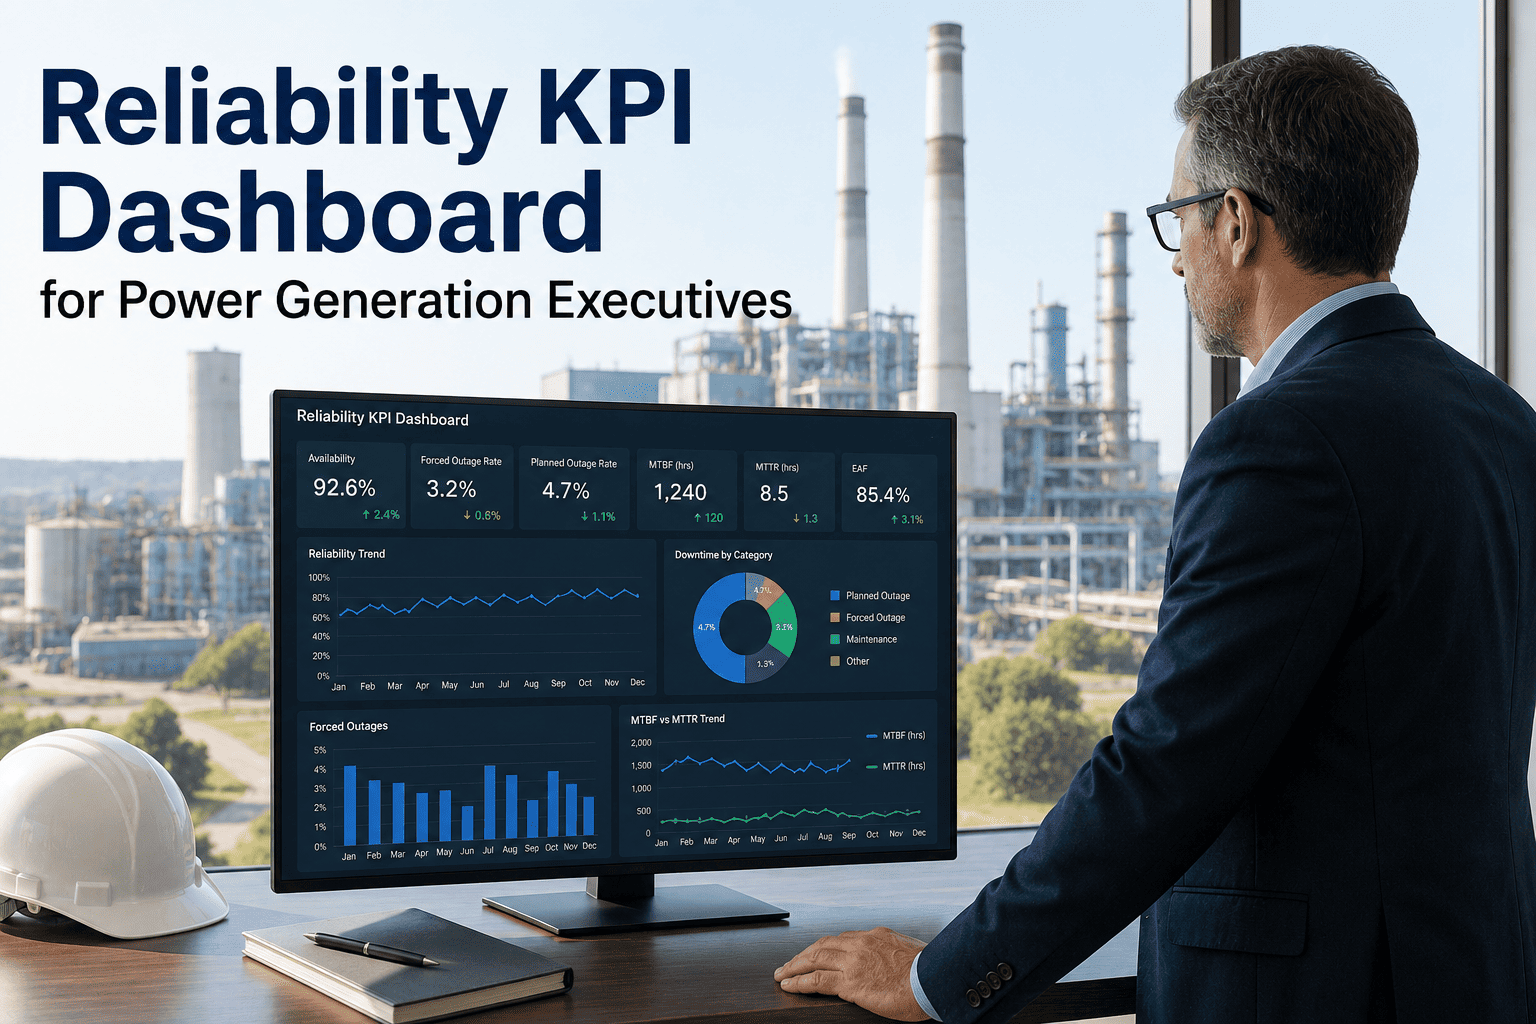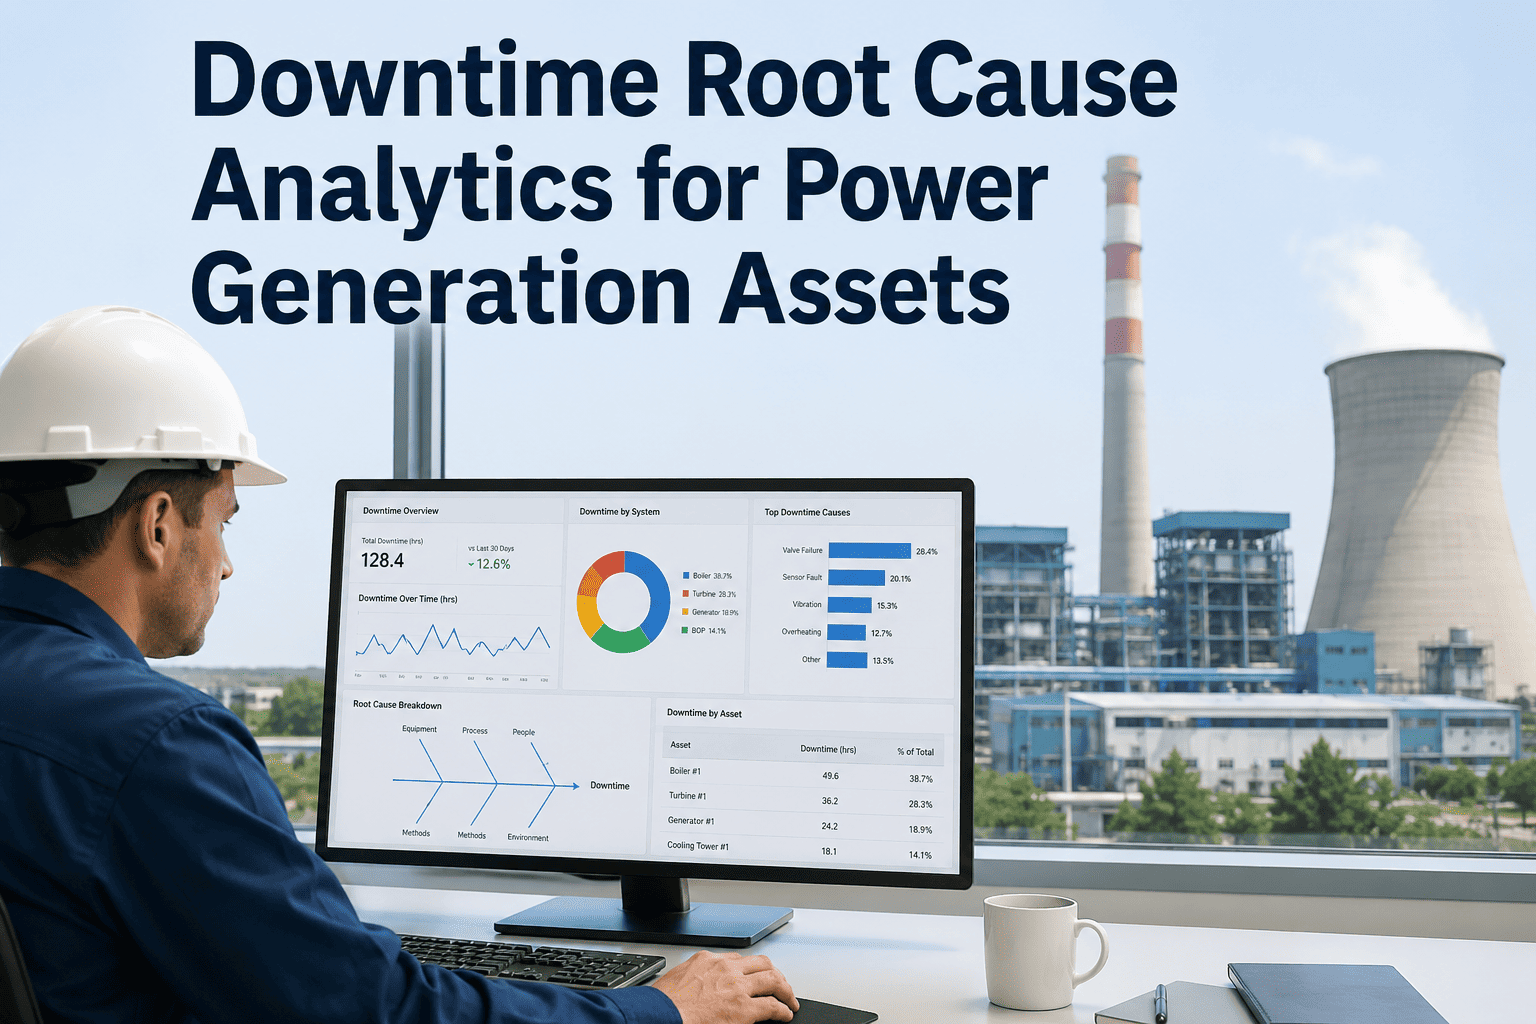
Every reliability team knows predictive maintenance works. Almost none of them can put a defensible number on a finance committee's table. The failures avoided this quarter, the outage hours that didn't happen, the emergency labor and expedited-freight premium that never got spent those savings are real, but they live scattered across a CMMS, a SCADA export, a maintenance spreadsheet and someone's memory of "that one time the bearing would have gone." This guide walks through how to build a predictive maintenance ROI model your finance team will actually accept — avoided failures, outage hours, emergency labor, spare parts and production impact, all as inputs you can defend — using OXMAINT AI, the AI-powered CMMS that captures those inputs as work orders close, not at year-end.
Power Plant Predictive Maintenance ROI: Cost, Downtime & Reliability Model
The hardest part of predictive maintenance isn't catching the failure — it's proving what catching it was worth. OXMAINT AI connects the chain your ROI model actually needs: a condition signal becomes a defect, a defect becomes a work order, and closing that work order captures the labor hours, parts cost and downtime avoided against that specific asset's own failure history. The inputs for your ROI model come from the maintenance work you were already logging — not a spreadsheet built from memory at quarter-end.
Why "It's Working" Isn't Good Enough for Finance
A reliability engineer knows a caught bearing failure was worth avoiding. A finance committee wants to know what it was worth avoiding, in dollars, compared to what the monitoring program cost to run. Those are different questions, and most plants can only answer the first one. Start free and see your first avoided-cost record inside OXMAINT AI.
- Avoided-failure cost estimated after the fact, from memory
- Outage-hour cost pulled from a different system than the work order
- Emergency labor and expedited-parts premiums never separated from routine spend
- No baseline for what the failure would have cost if it had run to completion
- One good save gets generalized into a program-wide claim nobody can audit
- Avoided-failure cost logged against the specific defect that triggered the work
- Downtime hours pulled from the same asset record as the repair
- Emergency vs. planned labor and parts costs tagged separately, every time
- A comparable baseline: what a similar failure cost this asset class historically
- Every save auditable back to its own work order, not folded into a single headline number
The Four Inputs That Actually Move the Number
A predictive maintenance ROI model isn't one formula — it's four cost deltas added together, then weighed against the program's own running cost. OXMAINT AI's job is to make each of these four inputs a real, timestamped field on the work order that generated it, not a number someone reconstructs later. Book a demo to see the four inputs on a real work order.
Where Each Number Comes From
A model is only as strong as the source of its inputs. Here's where each cost figure should actually be pulled from — and where OXMAINT AI keeps it attached to the work order rather than a separate tracker. Sign up free and map your own cost sources in OXMAINT AI.
| Input | Where it should come from | Common mistake |
|---|---|---|
| Avoided failure cost | This asset's own repair history for the same failure mode | Using a generic industry figure instead of your own history |
| Outage hours | Actual planned vs. unplanned repair duration on the work order | Estimating downtime instead of logging start/end times |
| Emergency labor | Overtime and callout rate tagged separately from standard labor | Blending emergency and routine labor into one line item |
| Spare parts premium | Expedited-freight or rush-order cost vs. standard stocked price | Recording only the part price, not the premium paid to get it fast |
The Save Only Counts If You Can Show Your Math.
A reliability win that lives in someone's memory doesn't survive a budget review. OXMAINT AI keeps every avoided-cost input attached to the work order that generated it, so the model holds up when someone asks to see the source.
Illustrative Example: Pricing One Avoided Failure
This is a worked example to show how the four inputs combine — not a claim about any specific plant's results. Swap in your own numbers and the structure holds. Book a demo to build this same worksheet on your own asset.
Spreadsheet Tracking vs. Work-Order-Level Tracking
| What matters | Spreadsheet / manual estimate | OXMAINT AI work-order tracking |
|---|---|---|
| Where the cost input lives | Reconstructed after the fact | Captured on the work order that closed it |
| Emergency vs. planned labor | Often blended together | Tagged separately by work order type |
| Failure-cost baseline | Industry average or guesswork | This asset's own repair history |
| Auditability | Hard to trace a number back to its source | Every input traces to a specific work order |
| Rollup to a fleet number | Manual, usually quarterly | Continuous, asset by asset |
Frequently Asked Questions
Stop Estimating the Save. Start Tracking It.
Build your predictive maintenance ROI model on the work orders you're already closing — avoided failure cost, downtime hours, labor delta and parts delta, all attached to the asset that earned them.