Power plant OEE loses do not announce themselves — they accumulate quietly across three categories until a 500 MW unit is running at 61% effectiveness and nobody can explain exactly why. The Six Big Losses framework was built for manufacturing, but adapted correctly for power generation, it becomes the most powerful diagnostic tool a plant reliability team can use. This page walks through the complete OEE Loss Tree for power generation — showing how every forced outage, every derated operating hour, every extended startup sequence, and every auxiliary micro-trip maps to one of the Six Losses across Boiler, Turbine, and Balance-of-Plant systems. Use this template to categorize your plant's losses, prioritize improvement effort, and build the internal case for condition-based maintenance. Start your free Oxmaint trial to track OEE losses automatically across every asset, or book a 30-minute demo to see the loss tree dashboard built for power generation.
40–55%
of total OEE deficit at underperforming plants comes from forced outages alone
2–5%
OEE loss from untracked micro-stops — auxiliary trips under 10 minutes that compound invisibly
8–16 hrs
average startup loss for a cold steam turbine — the most undertracked loss category in thermal plants
0.5%/wk
capacity loss rate from compressor fouling in gas turbines — invisible until output drop is noticed by operators
What Is an OEE Loss Tree — and Why Power Plants Need One
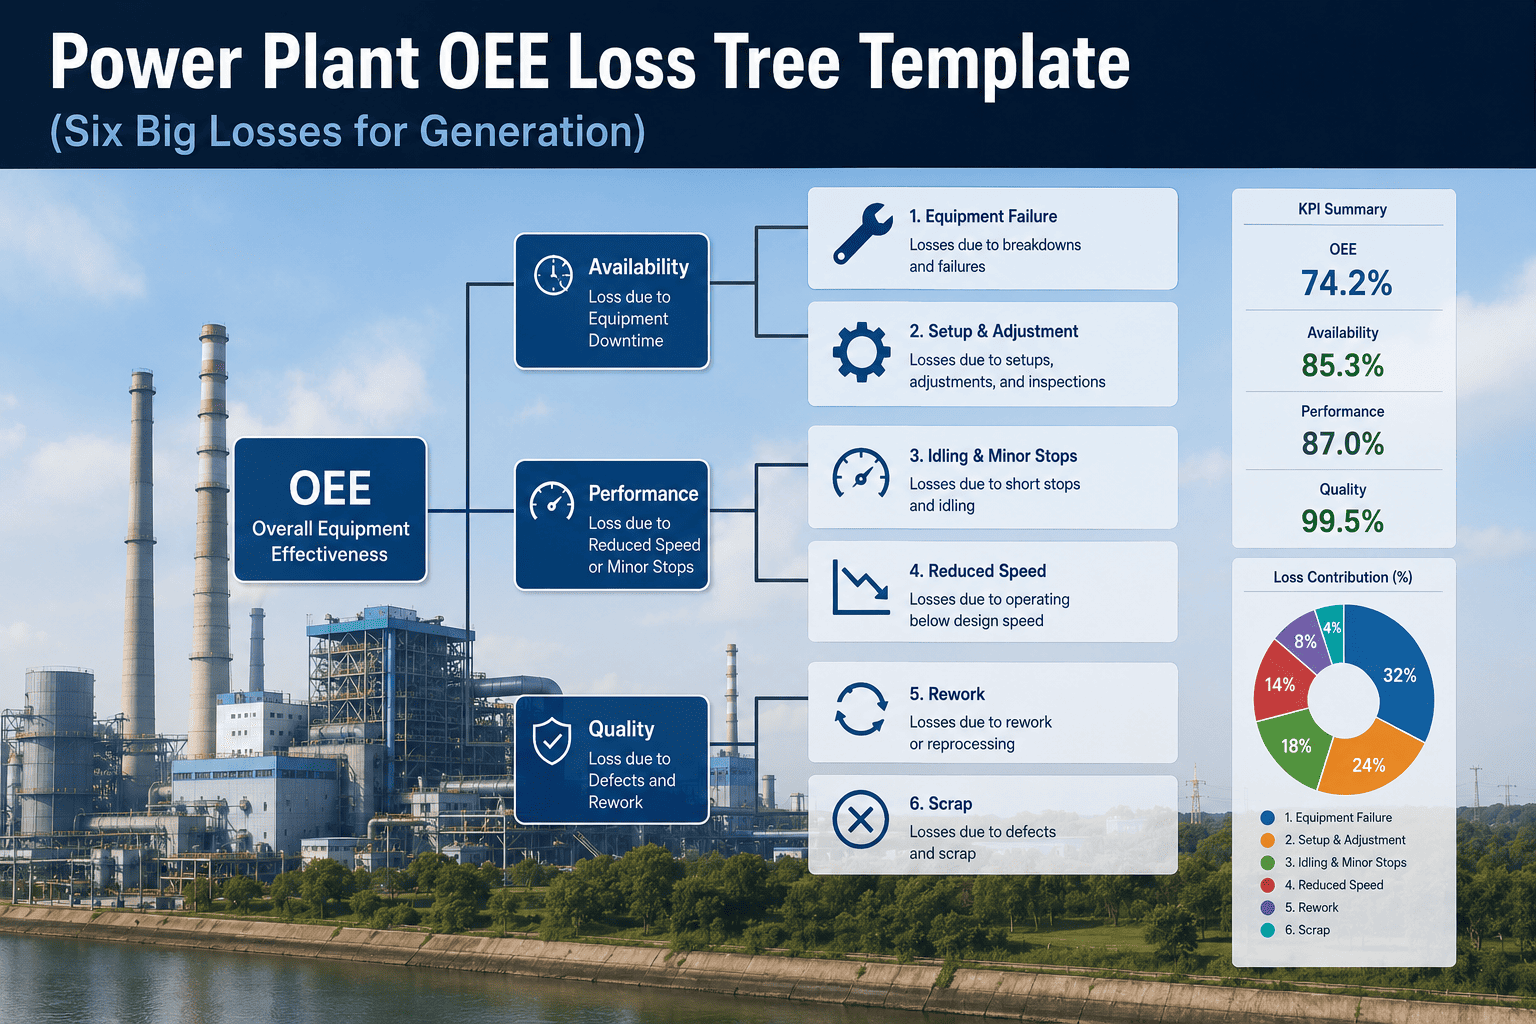
OEE = Availability × Performance × Quality. Every percentage point your plant falls below 85% maps to one of Six specific loss categories. A Loss Tree is the visual structure that connects your OEE score to the exact operations and assets responsible — so you fix the right thing instead of guessing.
Plant OEE
Availability × Performance × Quality
Loss 1
Breakdowns
Forced outages, turbine trips, transformer failures
Loss 2
Setup & Adjustment
Startup sequences, synchronisation delays, load ramp time
Loss 3
Minor Stoppages
Auxiliary trips, condenser backpressure, fuel transients
Loss 4
Reduced Speed
Derating, compressor fouling, degraded heat rate
Loss 5
Startup Rejects
Off-spec generation, voltage excursions, pre-sync output
Loss 6
Production Rejects
Derated MWh below contract, frequency deviations, reactive power shortfall
The Six Big Losses — Power Generation Definitions
The standard TPM definitions apply to discrete manufacturing. Here is how each of the Six Losses translates to the specific failure modes, assets, and events found in power generation facilities.
Breakdown Losses
Any unscheduled stop where the unit fails to generate during planned production time.
Power Generation Examples
Turbine trip from bearing temperature alarm
Generator fault — stator winding failure
Transformer oil contamination outage
Boiler tube leak — emergency shutdown
HV switchgear failure — forced islanding
Typical OEE Impact
40–55% of total deficit
Setup & Adjustment Losses
Time lost between planned shutdown and return to full synchronised output — including all startup, ramp, and commissioning intervals.
Power Generation Examples
Cold steam turbine startup: 8–16 hours
Gas turbine cold start: 4–6 hours
Post-outage return-to-service checks
Load dispatch ramp from minimum to full capacity
Synchronisation delays due to grid frequency mismatch
Typical OEE Impact
8–15% of total deficit
Minor Stoppage Losses
Brief interruptions under 10 minutes — individually small, but compounding to significant OEE losses when untracked across a multi-unit plant over a quarter.
Power Generation Examples
Auxiliary cooling pump trip-and-reset cycle
Condenser backpressure trip — brief autorestart
Fuel gas supply pressure transient
Electrostatic precipitator dropout and recovery
DCS alarm-driven load shedding under 5 minutes
Typical OEE Impact
2–5% of total deficit
Reduced Speed Losses
Unit is running but at less than design capacity — the "silent" OEE loss that never triggers an outage flag but drains megawatt output continuously.
Power Generation Examples
Compressor fouling — gas turbine losing 0.5% capacity/week
Boiler efficiency degradation from tube scaling
Turbine blade erosion — reduced expansion efficiency
Condenser vacuum degradation from biofouling
Generator reactive capability reduction from winding aging
Typical OEE Impact
10–20% of total deficit
Startup Reject Losses
Output produced during the startup window that does not meet grid or contract specifications — off-spec voltage, frequency excursions, or pre-synchronisation generation.
Power Generation Examples
Voltage excursion during black start synchronisation
Frequency deviation above ±0.5 Hz during ramp-up
Steam quality below spec during cold startup purge
Output below contracted minimum during warmup phase
Reactive power outside tolerance during initial load pickup
Typical OEE Impact
3–6% of total deficit
Production Reject Losses
MWh output during steady-state operation that falls below contracted delivery commitments — typically caused by derated operation that is logged but not traced to a root cause asset.
Power Generation Examples
Derated MWh below power purchase agreement floor
Frequency deviation penalties — grid code violation hours
Reactive power shortfall during peak demand period
Capacity payments forfeited due to partial availability
Ancillary service non-delivery — spinning reserve shortfall
Typical OEE Impact
5–10% of total deficit
See Your Plant's OEE Loss Tree in Real Time
Oxmaint automatically categorises every work order event into the correct loss bucket — breakdown, minor stop, derated run, or startup loss — and builds your plant's live OEE loss tree from field data, not spreadsheets.
Loss Tree Template: Asset-Level Mapping
Use this template to assign each loss event in your plant to the correct OEE category and the responsible asset system. Consistent categorisation is what turns a loss log into a Pareto-ranked improvement backlog.
| Asset System |
Loss Category |
Loss Type |
Example Event |
OEE Component |
Tracking Metric |
| Steam Turbine |
Loss 1 |
Breakdown |
Blade erosion trip — forced outage |
Availability |
Forced Outage Hours (FOH) |
| Gas Turbine |
Loss 4 |
Reduced Speed |
Compressor fouling — 8% output reduction |
Performance |
Capacity Factor vs Design |
| Boiler / HRSG |
Loss 1 |
Breakdown |
Tube leak — emergency shutdown |
Availability |
Unplanned Downtime Hours |
| Startup Sequence |
Loss 2 |
Setup Loss |
Cold start: 12 hrs to full sync |
Availability |
Start Duration vs OEM Target |
| Cooling System |
Loss 4 |
Reduced Speed |
Condenser vacuum degradation — 3% heat rate loss |
Performance |
Condenser Back-Pressure (mbar) |
| Auxiliaries (BOP) |
Loss 3 |
Minor Stop |
Feed pump trip — 4 min autorestart |
Performance |
Minor Stop Count and Duration |
| Generator |
Loss 6 |
Production Reject |
Reactive power shortfall — capacity penalty |
Quality |
Derated MWh vs Contract |
| Transformer |
Loss 1 |
Breakdown |
Oil contamination — forced outage 48 hrs |
Availability |
Forced Outage Hours (FOH) |
| Synchronisation |
Loss 5 |
Startup Reject |
Voltage excursion during black start |
Quality |
Grid Code Deviation Events |
OEE Waterfall: Where Generation Plants Lose Effectiveness
A typical underperforming thermal plant at 68% OEE shows a predictable waterfall pattern. Here is how a 100% theoretical maximum erodes to operational reality — and which losses offer the fastest recovery.
After Planned Maintenance
92%
–8% Planned outage / scheduled PM
After Breakdowns (Loss 1)
80%
–12% Forced outages, trips, transformer failures
After Startup Losses (Loss 2)
74%
–6% Cold/warm start sequences, ramp time
After Reduced Speed (Loss 4)
68%
–6% Compressor fouling, derating, heat rate loss
After Minor Stops (Loss 3)
65%
–3% Auxiliary trips, backpressure events
After Quality Losses (5+6)
62% OEE
–3% Derated MWh, startup rejects, grid code penalties
World Class Target
85% OEE — the gap is 23 percentage points of recoverable generation
Pareto Priority: Which Loss to Attack First
The most common mistake in OEE improvement is addressing all six losses simultaneously. High-reliability plants fix their top two loss categories first — that is where 70–80% of the total OEE gap lives.
Fix First
Loss 1: Breakdowns
40–55% of OEE deficit
Deploy condition-based PM triggers for turbines, transformers, and boilers. A single avoided forced outage recovers more OEE than fixing the other five losses combined in the same quarter.
Oxmaint tool: Asset health scoring + automated PM work orders on condition threshold breach
Fix Second
Loss 4: Reduced Speed
10–20% of OEE deficit
Implement heat rate trending and compressor performance curves. Reduced speed losses are silent — they never trigger an outage alarm, so they require proactive performance analytics to surface.
Oxmaint tool: Capacity factor trending + heat rate deviation alerts per unit
Fix Third
Loss 2: Setup / Startup
8–15% of OEE deficit
Track startup duration per event and compare against OEM design curves. Extended startups are usually procedural or condition-related — and consistently trackable once startup time is logged as a formal KPI.
Oxmaint tool: Startup duration logging per unit + deviation flagging vs design target
Turn Your Loss Log Into an Improvement Backlog
Oxmaint assigns every work order event to the correct Six Big Loss category automatically — giving you a live Pareto of where your OEE is going, updated every time a technician closes a job in the field.
Frequently Asked Questions
QHow is the Six Big Losses framework different for power plants vs. manufacturing?
In manufacturing, Quality losses are measured as defective parts. In power generation, Quality losses are derated MWh, grid code deviations, and startup rejects — output that does not meet contract or grid specification. Breakdown losses in power generation also include partial outage events (derated operation) that would not register as a "breakdown" in a parts-based manufacturing context.
Oxmaint's loss categorisation is pre-configured for power generation asset types.
QWhat is the most commonly undertracked OEE loss in power plants?
Loss 3 (Minor Stoppages) and Loss 4 (Reduced Speed) are the most consistently undertracked. Auxiliary trips under 10 minutes often go unlogged in SCADA systems, and compressor fouling or condenser degradation never triggers an alarm — it just silently reduces output. High-resolution event logging in your CMMS is the only way to surface these losses before they compound.
QHow does startup time count as an OEE loss — the unit was not generating anyway?
Startup time (Loss 2) is counted against planned production time — any time the unit was scheduled to be generating but was not. If your dispatch commitment requires full output at 06:00 and you achieve synchronisation at 09:30 due to a cold start sequence, those 3.5 hours are an Availability loss under Setup and Adjustment. Tracking startup duration against OEM targets identifies whether the loss is equipment-related or procedural.
Book a demo to see how startup duration is tracked per unit in Oxmaint.
QCan this loss tree template be used for multi-unit plants with different generation types?
Yes — add a Unit Type column and apply generation-specific loss examples per unit. A combined-cycle unit and a steam-only unit will have different Loss 2 durations and different Loss 4 drivers, but the six category structure applies to both. The key is maintaining consistent event definitions so losses are comparable across units when you roll up to a plant-level OEE Pareto.
QHow does Oxmaint automatically assign loss categories to work orders?
Your Plant's OEE Gap Has a Name — Find It Before It Finds You
Oxmaint deploys the OEE Loss Tree framework across your full asset inventory in under 12 weeks. Every forced outage, every derated run hour, every extended startup sequence gets categorised, tracked, and surfaced in a live dashboard — so your reliability team always knows which loss to fix next.