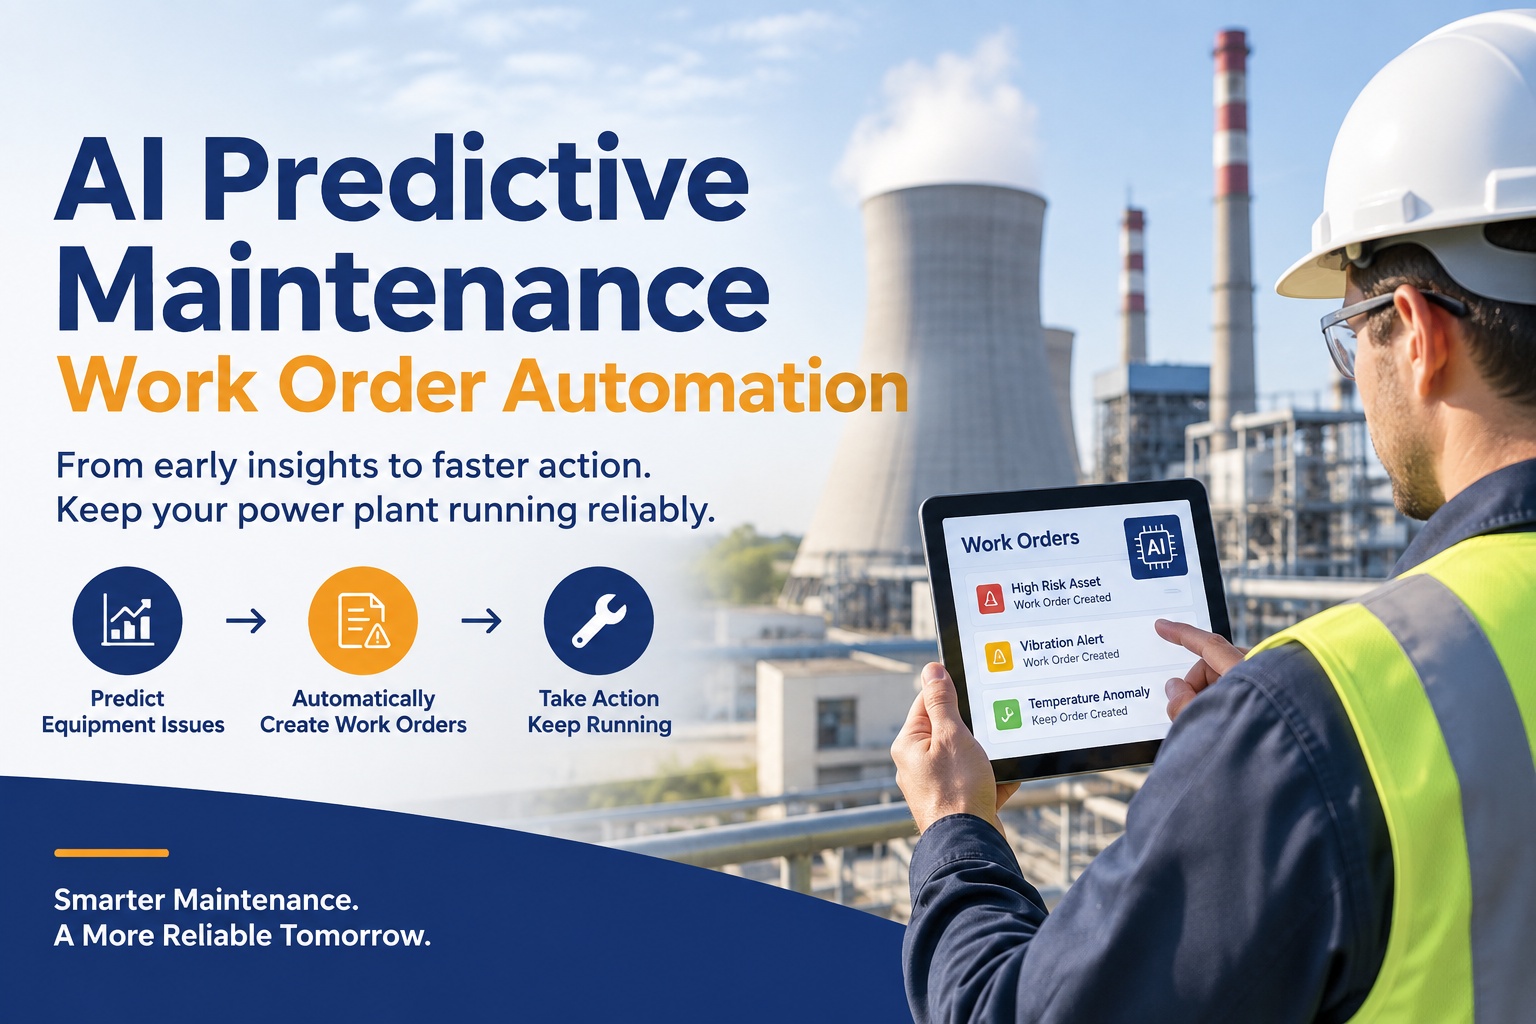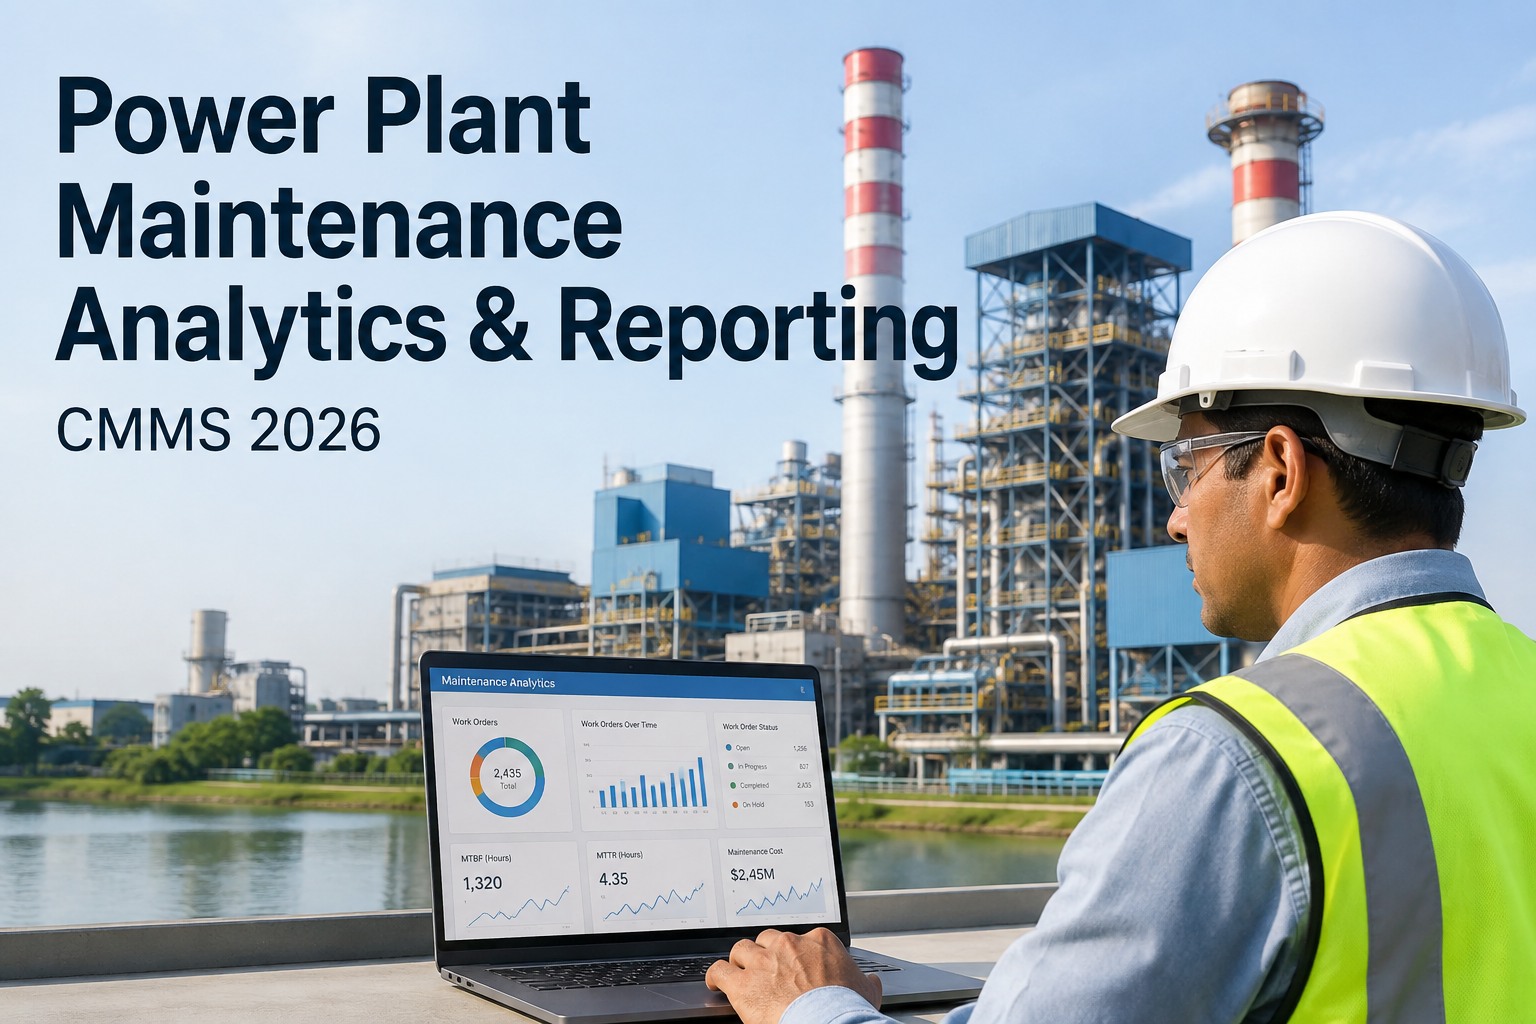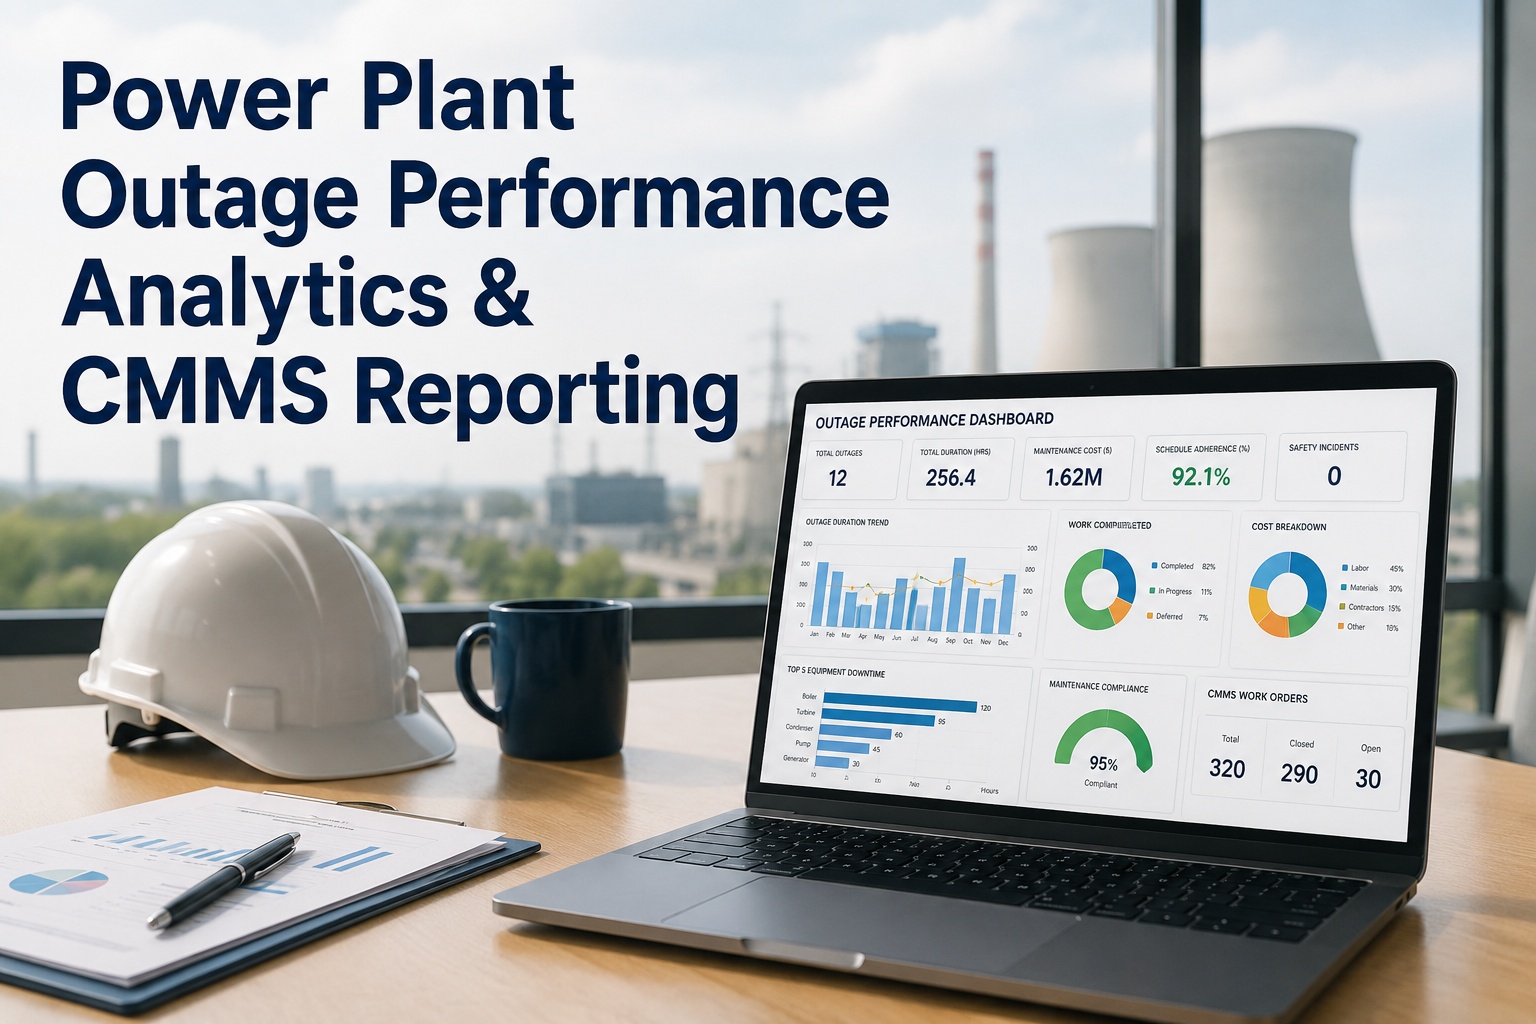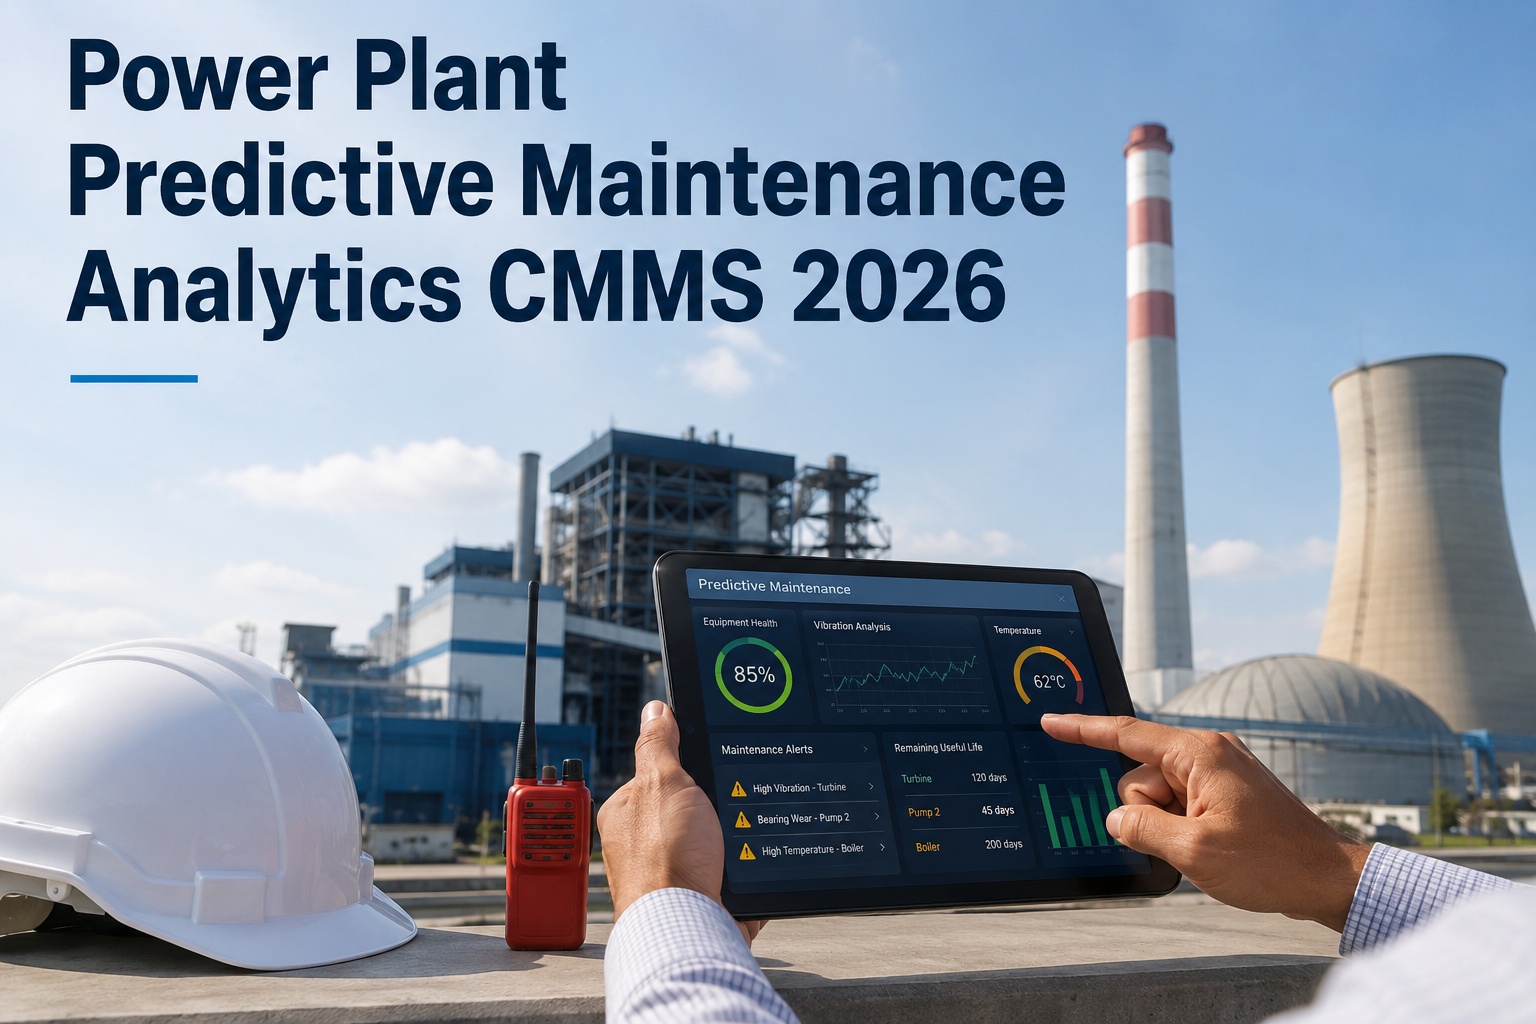
In power generation, a predictive alert that fires too late is indistinguishable from no alert at all — and one that fires too often trains operators to ignore everything. A 600 MW gas-fired station documented 4,300 condition-monitoring alerts over a single quarter: fewer than 12% led to a confirmed work order, and three genuine failure precursors were buried in the noise and missed entirely. The cost was two forced outages totalling 19 days. The root cause was not bad sensor data — it was the absence of a structured predictive alert accuracy dashboard that could separate signal from noise, track model performance over time, and close the loop between alert, action, and outcome. Sign up for Oxmaint to activate AI-powered alert accuracy tracking across your plant's condition monitoring systems, or book a demo to see a live predictive alert accuracy dashboard configured for your asset classes.
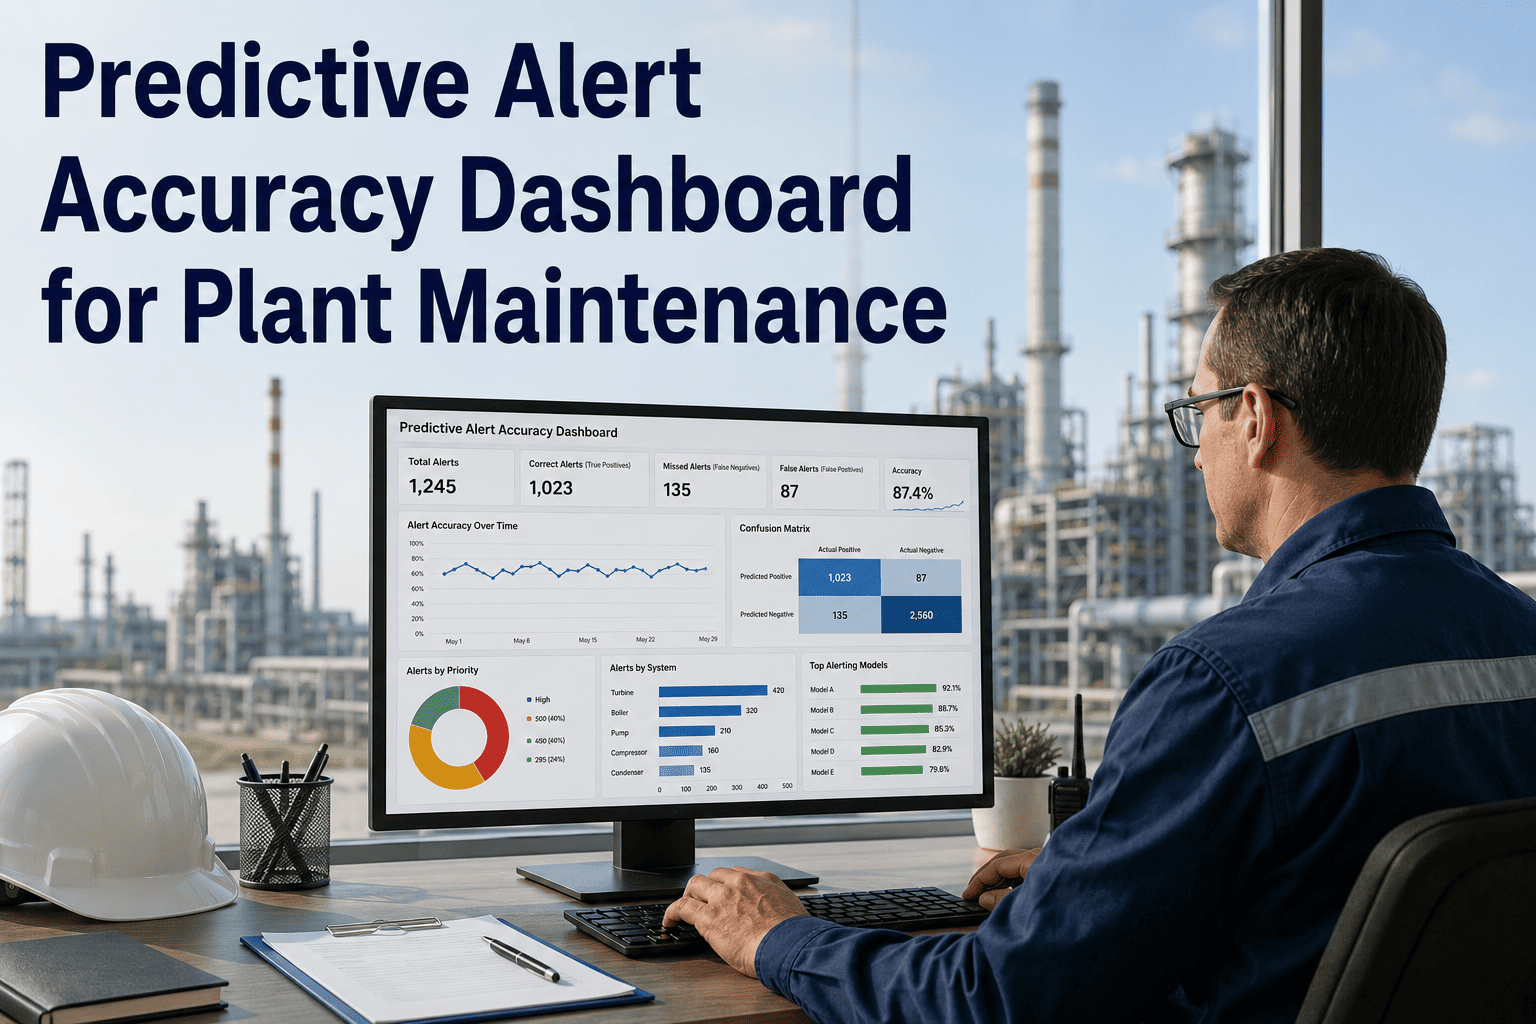
Predictive Alert Accuracy Dashboard for Plant Maintenance
How power plants measure, tune, and continuously improve the precision of AI-generated maintenance alerts — turning raw condition monitoring data into actionable work orders with documented accuracy rates.
Why Most Plants Cannot Measure Whether Their Predictive Alerts Are Working
The majority of power plants deploying condition monitoring technology measure sensor coverage and alert volume — not alert accuracy. Without a closed-loop measurement system, it is structurally impossible to improve AI model performance or justify the investment in predictive maintenance technology.
When false-positive rates exceed 30–40%, operators begin discounting all alerts. High-confidence genuine fault signals are ignored alongside noise. A single missed critical alert can cause a forced outage worth 10–50× the annual cost of the entire monitoring system.
AI and ML models degrade silently as operating conditions shift — seasonal load changes, aging assets, or process modifications alter the signal baseline. Without dashboard visibility into model drift, degrading accuracy goes undetected for months while false confidence in the system grows.
Work orders generated from predictive alerts rarely feed back into the alert system to confirm or refute the original prediction. Without this closed loop, the model cannot learn, analysts cannot calculate precision or recall, and there is no data to support model tuning decisions.
Alerts from vibration monitoring, thermal imaging, oil analysis, and SCADA typically live in separate vendor systems. Maintenance outcomes are recorded in the CMMS. Without integration, connecting an alert to its maintenance resolution requires manual effort most teams never complete.
What a Predictive Alert Accuracy Dashboard Measures — and Why Each Metric Matters
An effective predictive alert accuracy dashboard is not a list of alerts. It is a performance management system for your AI models, your maintenance response process, and your overall predictive maintenance investment.
Of all alerts fired, what percentage identified a real fault? Low precision = alert fatigue. Target: >75% for mature models.
Of all real faults that occurred, what percentage were caught by an alert? Low recall = missed failures. Target: >90% for critical assets.
How many days before failure did the alert fire? Short lead times reduce intervention options. Target: median >14 days for planned repair.
What percentage of alerts generated a work order within the configured response window? Unmeasured alerts are unmaintained assets.
Is model accuracy stable or degrading over time? Rolling 30-day precision tracked against 90-day baseline detects silent model degradation.
Time from alert fire to work order creation. Delays erode the lead time advantage. Target: <4 hours for high-priority alerts.
See Your Plant's Predictive Alert Accuracy Metrics in a Single Live Dashboard
Oxmaint's analytics engine connects condition monitoring alerts to CMMS work order outcomes automatically — calculating precision, recall, lead time, and model drift across every asset class and every monitoring technology in your plant. Most plants see their first accuracy report within 30 days of go-live.
Predictive Alert Performance by Asset Class — What the Dashboard Shows
Different asset classes have fundamentally different failure modes, monitoring technologies, and acceptable precision thresholds. A single plant-wide accuracy number hides the performance of individual models. The Oxmaint dashboard segments accuracy by asset class, monitoring technology, and alert severity.
| Asset Class | Primary Monitoring Method | Typical Raw Precision | Target Precision (Tuned) | Critical Recall Threshold | Avg Lead Time Goal |
|---|---|---|---|---|---|
| Gas Turbine / Compressor | Vibration + SCADA process params | 42–55% | 80–88% | 95% | 21 days |
| Boiler Feed Pumps | Vibration + bearing temp | 48–62% | 82–90% | 92% | 14 days |
| Generator Windings | Partial discharge + thermal | 28–40% | 70–80% | 98% | 45 days |
| Cooling Towers | Water quality + vibration | 55–68% | 85–92% | 88% | 10 days |
| Transformers | DGA oil analysis + thermal | 60–72% | 88–94% | 99% | 60 days |
| Steam Turbine | Vibration + rotor eccentricity | 44–58% | 78–86% | 96% | 28 days |
How Oxmaint Closes the Loop Between Alert, Work Order, and Model Performance
Vibration, thermal, oil analysis, or process parameter anomaly detected. Alert is timestamped, classified by severity, and linked to the specific asset in the Oxmaint asset registry.
Oxmaint automatically creates a work order linked to the alert — with asset history, previous alert record, recommended inspection steps, and required parts list pre-populated based on the alert type and asset class.
On completing the inspection, the technician records whether the alert identified a genuine fault. This outcome — confirmed, not confirmed, or inconclusive — is captured in a structured field, not a free-text note.
The outcome feeds back into the accuracy dashboard in real time. Precision, recall, and lead time metrics update automatically. Model drift is tracked on a rolling 30-day window. Analysts see exactly which asset classes and alert types are underperforming.
Dashboard-identified underperforming models have alert thresholds adjusted in Oxmaint — raising sensitivity on high-miss-rate assets and reducing noise on high-false-positive types. Each tuning cycle is logged with before-and-after accuracy data.
Predictive Alert Accuracy Dashboard — Questions from Plant Analytics and Maintenance Teams
Oxmaint integrates with vibration monitoring platforms (SKF, Emerson CSI, Bently Nevada), oil analysis laboratory systems, SCADA historians (OSIsoft PI, Wonderware, GE Historian), thermal imaging outputs, and partial discharge monitoring systems via API or flat-file import. Alert data from any connected system is timestamped, linked to the Oxmaint asset registry, and tracked through the closed-loop accuracy workflow. Work order outcomes recorded in Oxmaint — whether created manually or auto-generated from alerts — automatically feed back into accuracy calculations. Book a demo to see a live integration configured for your specific monitoring systems.
For assets with high alert frequency — rotating equipment such as pumps and fans — the accuracy dashboard typically accumulates sufficient data for statistically meaningful precision and recall calculations within 30–45 days of go-live. For lower-frequency assets such as transformers or generator windings, where genuine fault events are rare, meaningful recall data may take 90–180 days to accumulate. Oxmaint handles this by flagging sample-size confidence intervals directly on the dashboard — preventing decisions based on statistically insufficient data. Rolling baselines update continuously as new confirmed outcomes are recorded. Sign up to begin building your accuracy baseline from day one.
Yes. The Oxmaint accuracy dashboard segments performance by asset class, monitoring technology (vibration, thermal, oil analysis, process parameters), alert severity level, and specific model or rule set. This means a plant can determine, for example, that their vibration-based bearing fault alerts have 84% precision while their temperature threshold alerts on the same asset have 43% precision — enabling targeted model improvement rather than blanket threshold adjustments. Individual analysts can create custom views filtering by unit, system, or asset type. Book a demo to see multi-dimensional accuracy segmentation for your asset library.
The accuracy dashboard produces auditable, documented evidence that predictive alerts are identifying real faults, with quantified lead times and confirmed repair cost avoidance. This data directly supports capital budget justification for expanded sensor coverage, plant reliability reports to senior leadership, insurance premium negotiations with machinery underwriters, and regulatory evidence for reliability standard compliance. Plants using Oxmaint's accuracy reporting have reduced machinery insurance premiums by documenting confirmed predictive maintenance outcomes over 12-month periods. Sign up to start generating auditable predictive maintenance ROI documentation.
The dashboard surfaces underperforming models with recommended threshold adjustment ranges based on historical outcome data. Adjustments can be made by the plant's reliability engineer directly in Oxmaint — with each change logged against the before-and-after accuracy data for accountability. For plants using third-party monitoring vendor models, the accuracy data exported from Oxmaint provides the evidence needed to request threshold recalibration from the vendor. Oxmaint does not override proprietary vendor model logic — it measures outcomes and provides the data to drive improvement conversations. Book a demo to walk through the threshold review workflow.
Your Predictive Maintenance Investment Deserves a Dashboard That Proves It Is Working
Oxmaint closes the loop between condition monitoring alerts and maintenance outcomes — automatically tracking precision, recall, lead time, and model drift across every asset class in your plant. Configure your accuracy dashboard in under 30 days with no IT project required.