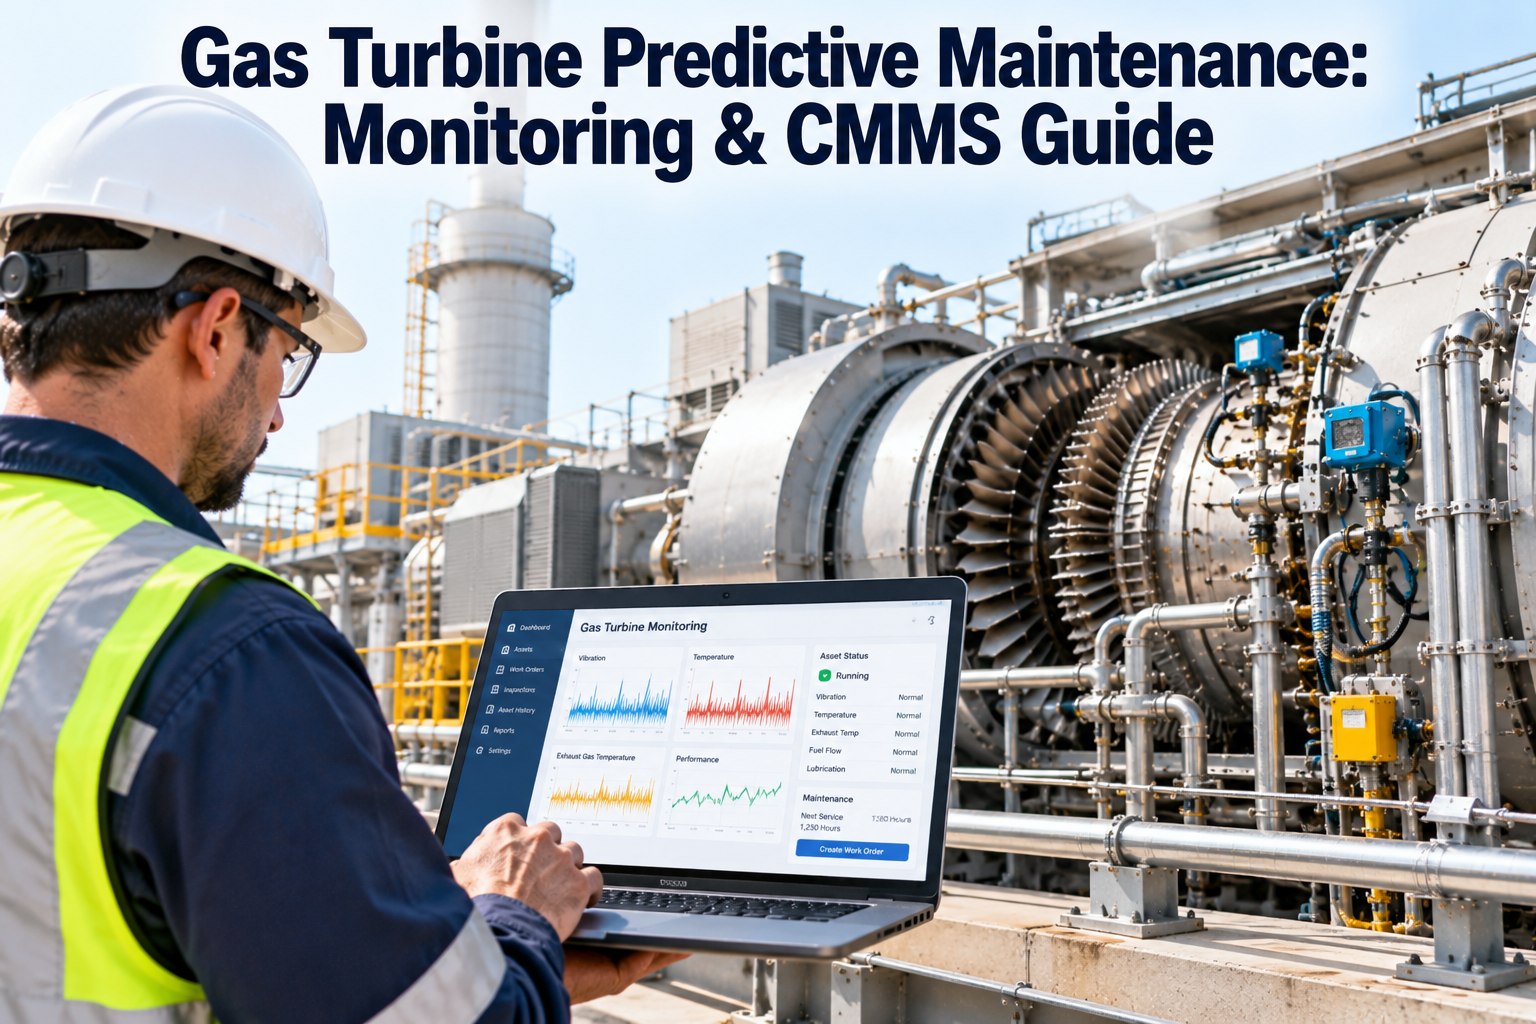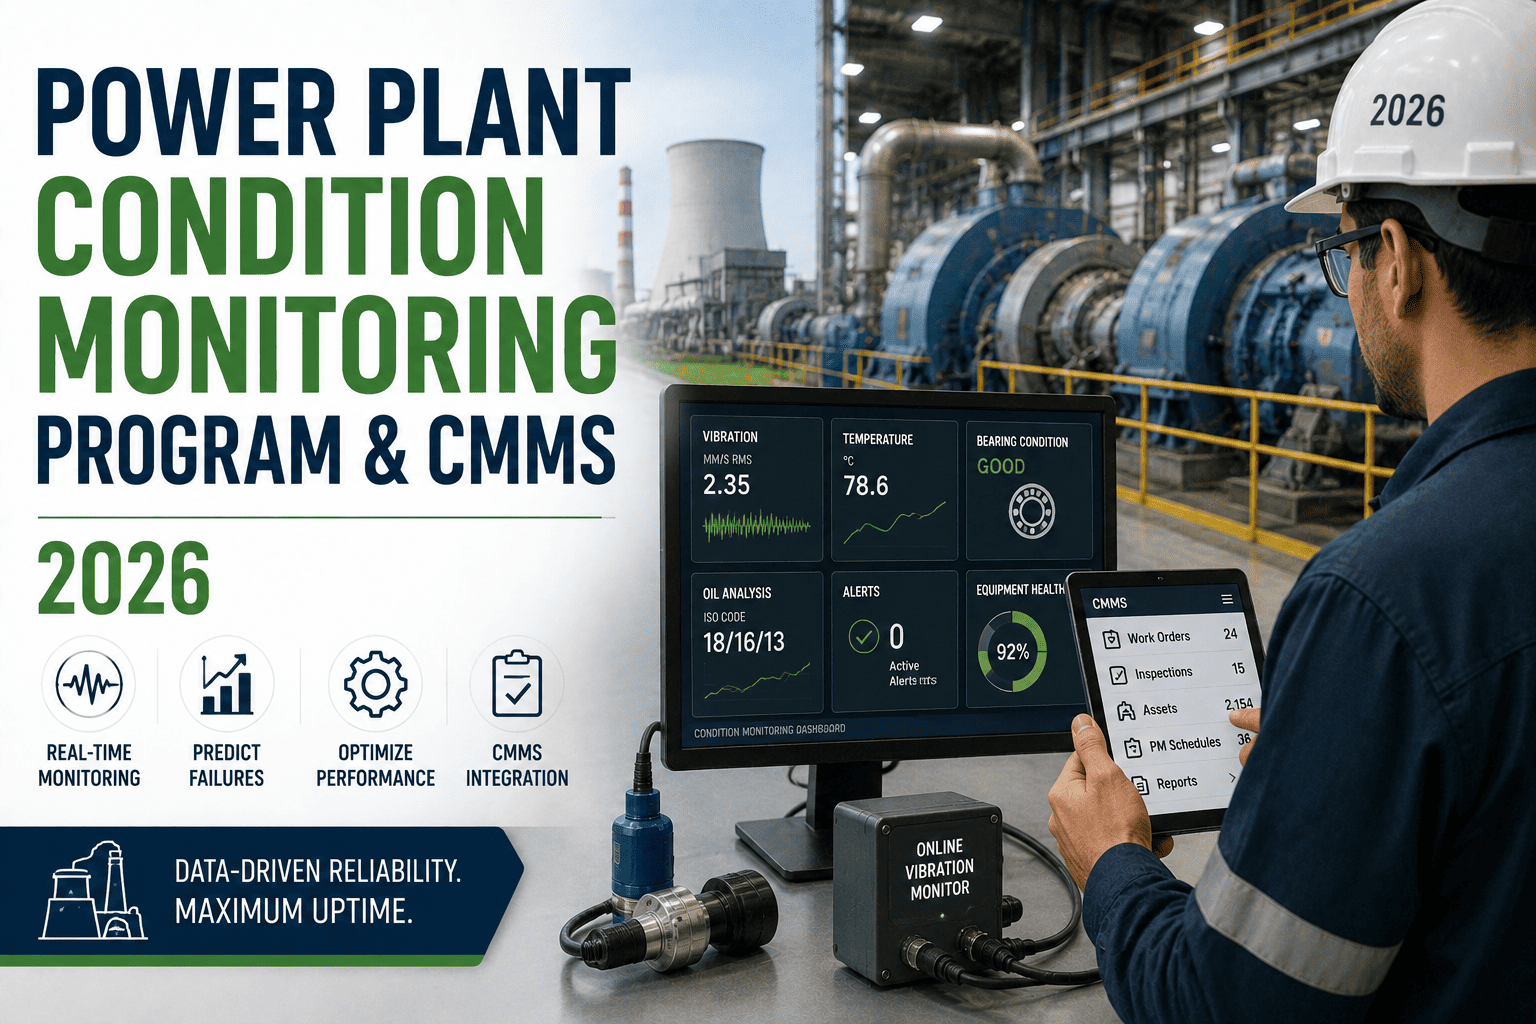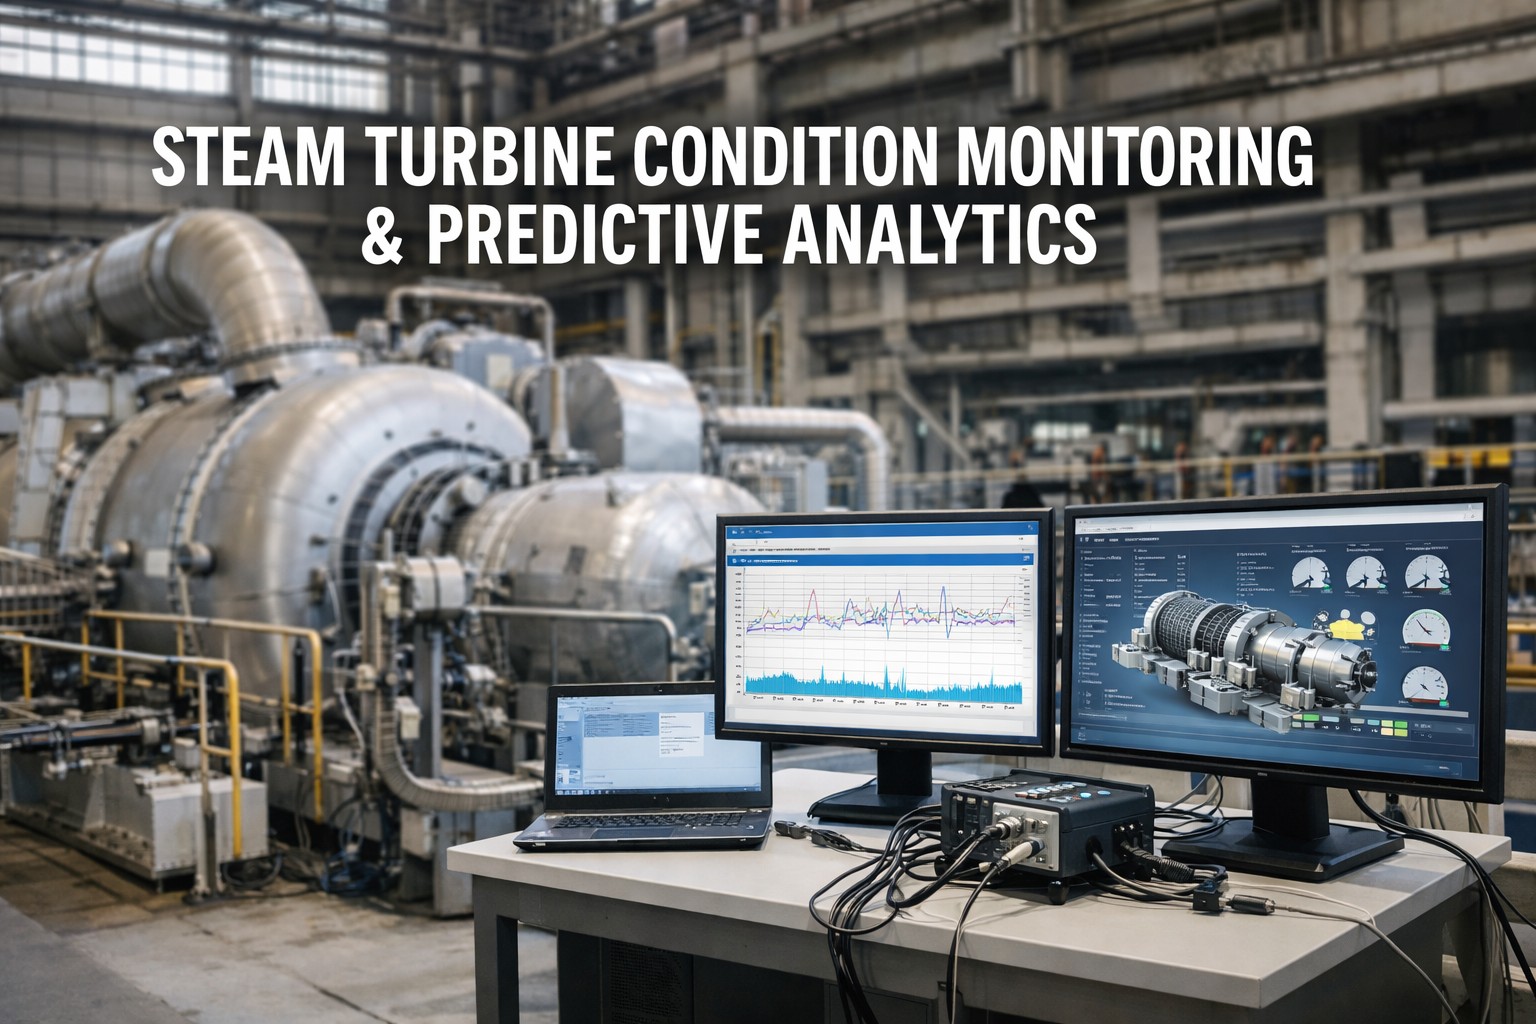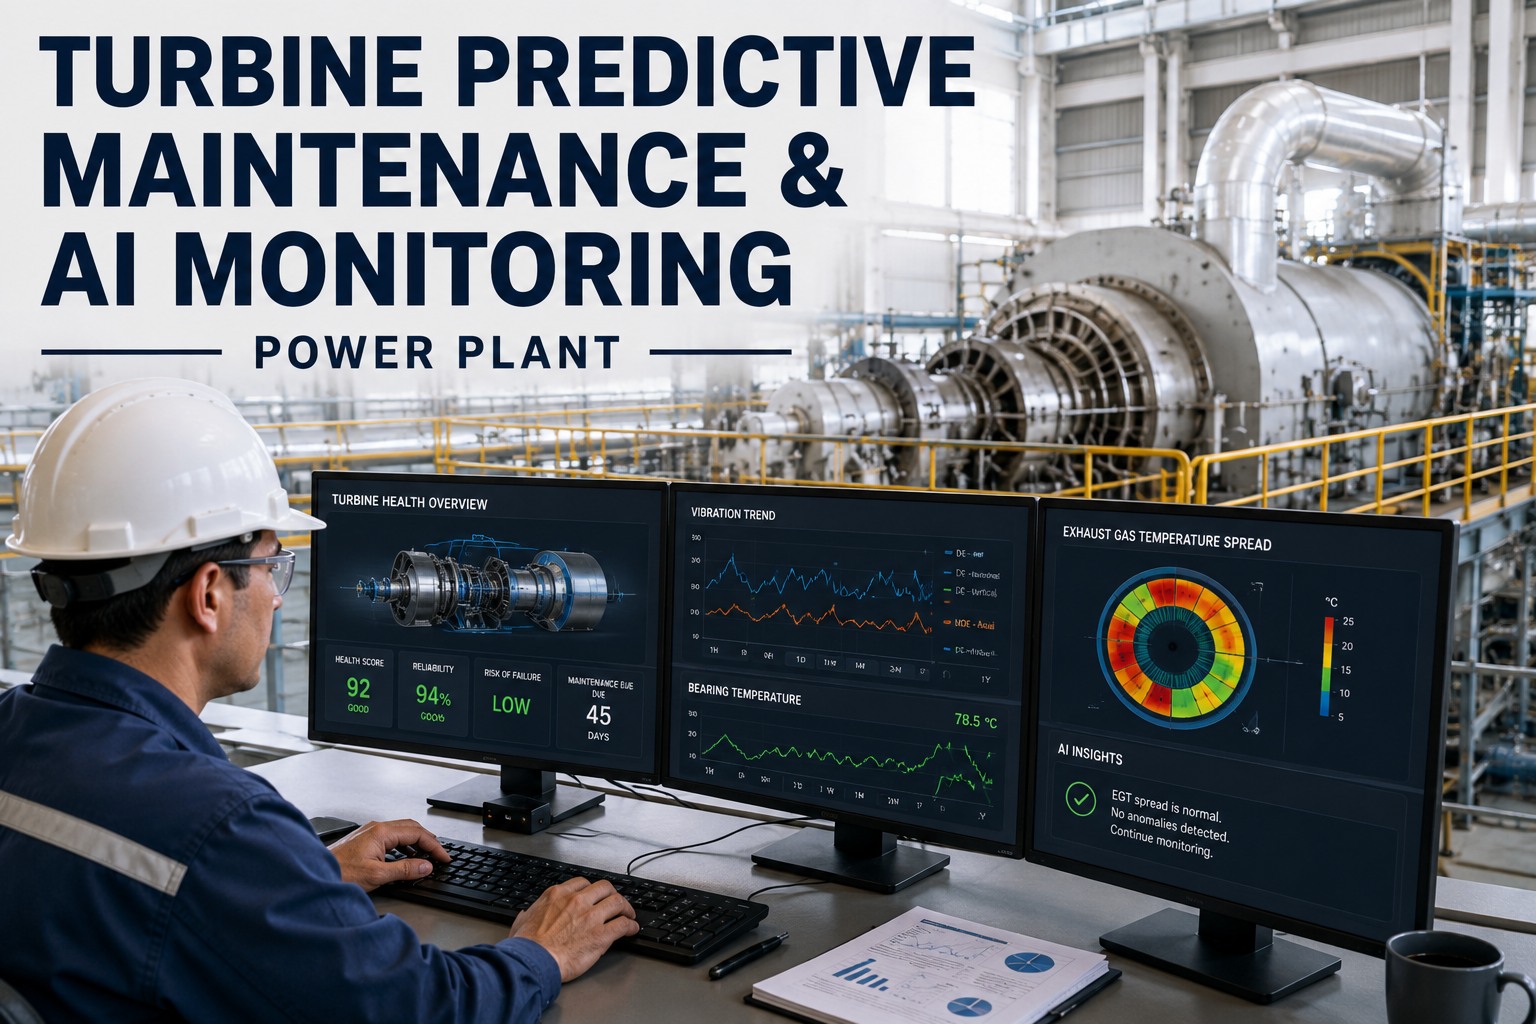
Power plant turbines fail on their own schedule, not yours — and a single unscheduled 9FA gas turbine outage routinely costs $480K–$1.2M in lost generation, parts, and ramp-down penalties. Predictive maintenance flips that math by turning exhaust gas temperature (EGT) spread, shaft vibration, and bearing-temperature telemetry into early-warning signals that flag developing faults 14–90 days before trip. OxMaint's AI turbine monitoring layer fuses SCADA, CMMS work orders, and vibration spectra so reliability engineers can move from calendar-based overhauls to condition-based interventions. Start your Start Free Trial to ingest a year of historian data and see the baseline fault signatures within 48 hours.
Predict the next turbine trip 14 to 90 days before it happens.
Modern gas and steam turbines generate 8,000+ sensor points per second across EGT spreads, vibration spectra, bearing temperatures, lube-oil pressure, and rotor displacement. OxMaint's predictive maintenance layer learns each asset's healthy baseline and surfaces the exact anomaly signature — combustion-can fouling, bearing wear, blade-tip rub — before the OEM protection system even twitches.
The five fault classes AI catches before the protection system trips
ISO 10816 vibration limits and OEM EGT-spread alarms are trip-class thresholds — by the time they fire, the damage is already done. These are the five failure signatures where AI monitoring consistently delivers 2–6 weeks of advance warning.
Combustion-can fouling & nozzle coking
A healthy 7FA turbine holds EGT spread under 30°F. The AI tracks per-can delta from baseline and flags a slow asymmetric drift — typically 0.4°F/day on one canary can — 18–35 days before the 50°F OEM alarm fires. Early correction is a $9K online wash; late correction is a $310K hot-gas-path inspection.
Bearing wear & journal instability
1X vibration amplitude creeping 0.15 mils/week on bearing #1, paired with a 0.5°C/hr bearing-temperature rise, is the textbook signature of babbitt fatigue. The model flags it at 2.1 mils — well under the 3.5 mil trip — giving planners a 21-day window to schedule a lift during the next low-demand weekend.
Rotor-to-stator clearance loss
Sub-synchronous vibration components at 0.65X–0.85X, combined with a 4% efficiency droop, indicate tip-rub onset. OxMaint isolates the spectral signature from gearbox noise and posts an alert 14–28 days before stage efficiency drops the 2% that triggers a performance penalty review.
Bearing temperature AI & oil-quality fusion
When bearing #2 metal temperature rises 6°C over baseline and a parallel ISO 4406 cleanliness trend degrades from 18/16/13 to 21/19/15, the model fuses both signals and recommends an oil change — catching varnish precursors that would otherwise shorten bearing life by 4,000 operating hours.
Thermal-stress accumulation in peaking duty
Every hot start costs a GT roughly 8 equivalent operating hours. The AI tracks actual ramp-rate vs. OEM curves, exhaust-temperature overshoot, and the cumulative low-cycle-fatigue count — predicting when creep life consumption will hit 75% of design, the threshold most OEMs use for planned major inspection.
A 180-MW combined-cycle plant, $42K/yr in CMMS spend
A Midwest U.S. peaking plant running two 7FAs and one SST-600 spent $42,000/year on vibration analyst contractors, fixed-interval borescope inspections, and three unscheduled trips in 2023. Here's how the math changes when AI monitoring replaces calendar-based intervals.
3 trips avoided × $310K + $1.8M overhaul deferred 9 months + $42K analyst fees replaced = $2.78M first-year value against a $54K platform subscription.
$54,000 ÷ ($2,782,000 ÷ 12) = 0.23 months, or roughly the first avoided trip event. Most sites see full ROI inside 90 days of historian ingestion.
| METRIC | BEFORE (2023, CALENDAR-BASED) | AFTER (AI PREDICTIVE) | DELTA |
|---|---|---|---|
| Unplanned trips / year | 3 | 0 | −100% |
| Forced outage factor | 4.2% | 0.6% | −3.6 pts |
| Borescope inspections / year | 6 (fixed interval) | 2 (condition-driven) | −67% |
| Mean time to detect (MTTD) | 11 days post-onset | 18 days pre-alarm | +29 days lead |
| Vibration analyst fees | $42,000 / yr | $0 (in-platform) | −$42K |
| EGT spread alarm lead | 0 hrs (trip-level) | 18–35 days | +$310K risk avoided |
| OEE | 91.4% | 96.8% | +5.4 pts |
From SCADA tag to work order in under 90 seconds
The closed loop below shows how a single EGT-spread anomaly becomes a prioritized CMMS work order — no analyst triage, no spreadsheet handoff, no 48-hour lag between detection and action.
Ingest
OPC-UA / Modbus / PI-Historian connectors pull 8,000+ tags at 1 Hz. Baseline auto-tunes on 30 days of data per ISO 13379-1 reference patterns.
Detect
LSTM + spectral-residual models flag deviation >2.5σ from asset-specific baseline, filtering out load-swing and ambient-temp false positives.
Diagnose
Fault classifier maps the signature to one of 47 ISO 13373 pattern classes — unbalance, misalignment, looseness, rub, resonance — with confidence %.
Prioritize
Risk score = probability × consequence ($/hr downtime). Top-5 risks surface on the reliability dashboard every Monday at 06:00.
Dispatch
Auto-generates a CMMS work order with fault class, recommended action (per OEM service manual), parts list, and target window — routed to the planner queue.
Built to align with ISO 13374, ISO 17359, and your existing CMMS
ISO 13374 data processing
Six-block architecture — data acquisition, manipulation, state detection, health assessment, prognostic assessment, advisory generation — maps 1:1 to the standard, so auditors see a familiar structure.
CMMS two-way sync
Native connectors for Maximo, SAP PM, eMaint, and Fiix. Work orders round-trip status, labor hours, and failure codes — closing the ISO 14224 failure-data loop automatically.
ISO 17359 coverage
General guidelines for condition monitoring & diagnostics of machines — OxMaint's asset hierarchy, alarm tiers, and review cadence inherit the standard's structure out of the box.
Vibration FFT & order analysis
Ingests raw accelerometer waveforms at up to 25.6 kHz, runs order tracking against shaft RPM, and surfaces 1X/2X/3X/sub-sync components per ISO 10816 severity bands.
Stop tripping on data you already collect.
Your historian already holds the 14-day warning. OxMaint turns it into a work order.
Turbine predictive maintenance — what reliability teams ask first
How much historian data does OxMaint need to start producing useful alerts?
A minimum of 30 days of 1 Hz SCADA data is enough to build a baseline for a steady-state asset; 90 days is recommended for peaking units with variable duty cycles. Most sites see their first high-confidence anomaly alert within 48 hours of ingestion, and full prognostic coverage (creep life, RUL estimates) after 6 months of accumulated data. You can Start Free Trial with a CSV export from your PI historian — no live connector required for the first pass.
Can the AI distinguish a real bearing fault from a load-swing false positive?
Yes. The model fuses vibration spectra with megawatt output, ambient temperature, and valve position, then masks any deviation that correlates >0.85 with a known operating-mode transition. This typically eliminates 80–92% of the false alarms that plague threshold-only systems, leaving analysts with 3–7 genuine alerts per week instead of 40+.
Does it work with both gas and steam turbines, or only one frame size?
OxMaint is frame-agnostic and currently monitors aeroderivative LM6000s, heavy-duty 7FAs/9FAs, SST-600/900 steam turbines, and older Westinghouse/Westinghouse-license units. The baseline auto-tunes per asset, so the same platform covers a 25-MW FT8 and a 280-MW 9FA without custom configuration.
How does it integrate with our existing Maximo or SAP PM work-order flow?
Native two-way connectors push auto-generated work orders (with fault class, OEM manual reference, parts list, and target window) into Maximo or SAP PM, then pull completion status, labor hours, and failure codes back for closed-loop ISO 14224 reporting. Setup is typically a half-day exercise. Book a Demo and we'll map your asset hierarchy live.
What's the typical payback period, and is there a minimum contract term?
Most 100-MW+ sites reach full payback inside 90 days — typically the first avoided trip or deferred overhaul. There is no minimum contract term on the trial tier; you can run a single turbine for 14 days, ingest a year of historian data, and validate the alerts against your own outage log before committing to a fleet rollout.
Your next turbine trip is already in the data. Find it today.
Ingest 30 days of historian data, get your first anomaly alerts in 48 hours, and benchmark against 14-day lead times.
Free 14-day trial · No credit card