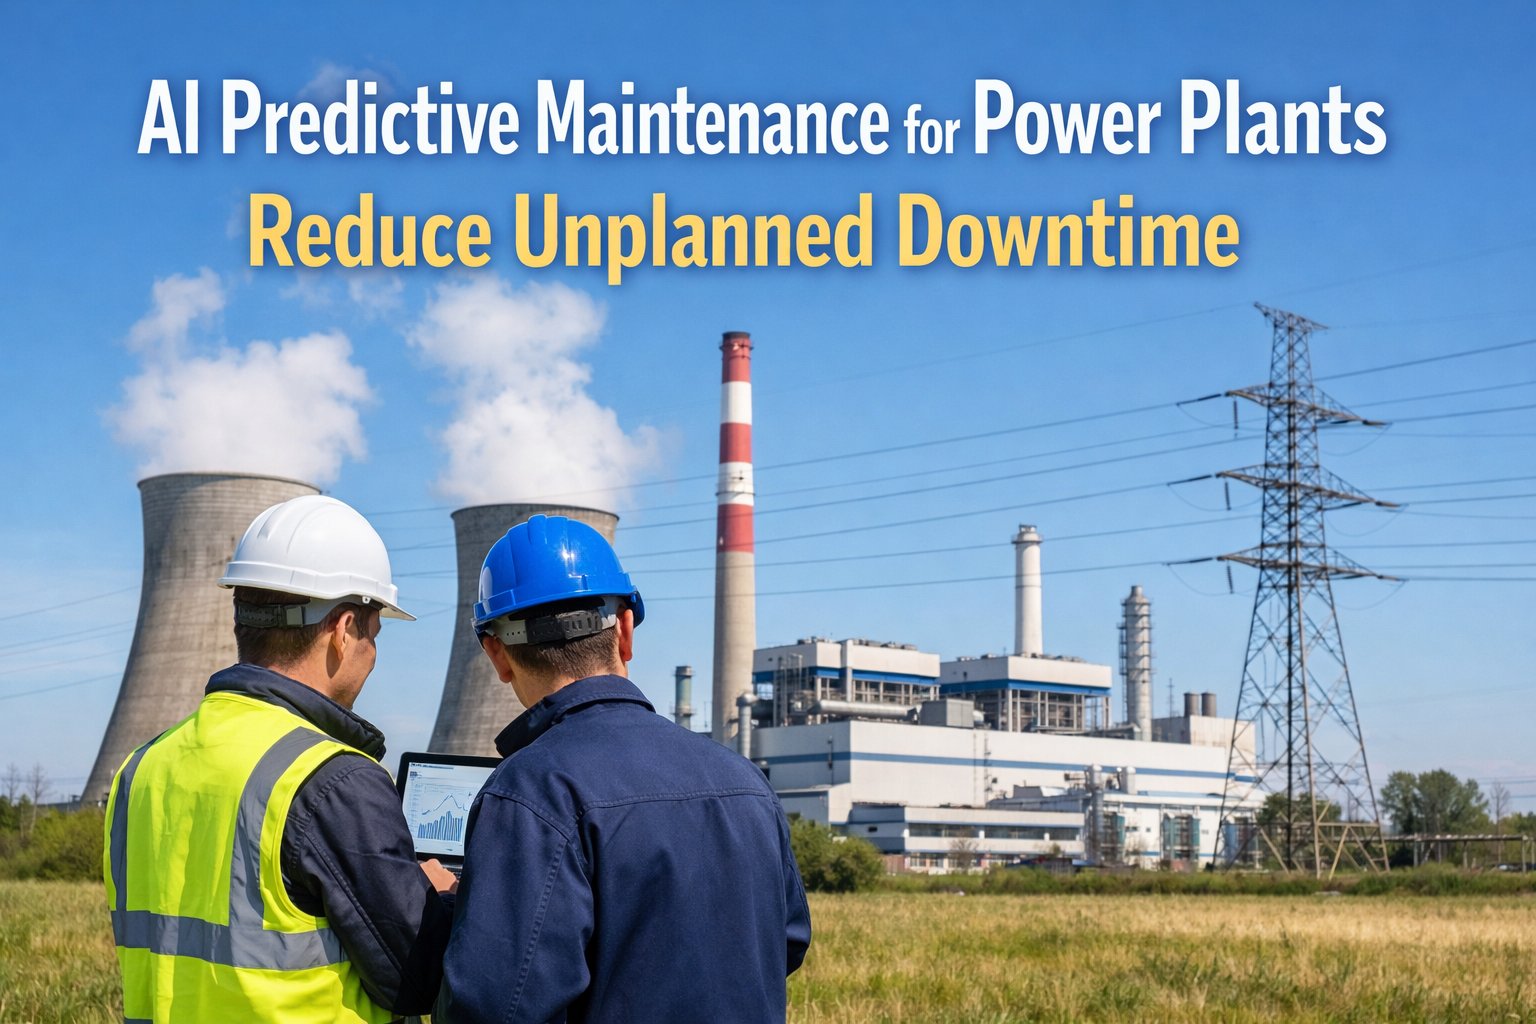
Zero unplanned outages is a target, not a promise — no fleet reaches it by chance, and NERC's own data shows the industry moving in the wrong direction on this metric, with weighted forced outage rates climbing to 9.2% in 2025 against a historical norm rarely above 8%. Coal and combined-cycle units are driving most of that increase, and aging generation reaching 40-plus years of service compounds the problem further. But plants that consistently outperform their peers on forced outage rate aren't running newer equipment — they're running a tighter framework across five specific disciplines. This page lays out that framework in full, drawing on how the strongest-performing fleets structure their reliability programs.
Reliability · Pillar Page
Zero-Unplanned-Outage Framework for Modern Power Plants
A five-pillar operating framework — condition monitoring, risk-ranked PM, digital inspections, root-cause discipline, and predictive analytics — that the highest-reliability fleets run every single day.
9.2%
2025 weighted equivalent forced outage rate, up from a historical norm under 8% (NERC)
39.8 TWh
increase in unavailable coal-fleet energy in a single year, largely condition-driven
40+ yrs
typical age of large coal units still carrying baseload, per NERC's 2026 reliability report
5 pillars
disciplines this framework organizes reliability work around, detailed below
The Five Pillars of Outage Prevention
Zero-unplanned-outage performance isn't a single initiative — it's the compounding effect of five disciplines running together, consistently, across the full asset base.
01
Condition Monitoring
Continuous tracking of vibration, temperature, and electrical signatures across critical rotating and static equipment, replacing point-in-time inspection with ongoing visibility.
02
Risk-Ranked Preventive Maintenance
PM backlog worked by failure probability and consequence, not ticket age — so the assets most likely to cause a forced outage get attention first.
03
Digital Inspections
Mobile, structured inspection checklists that replace paper rounds — closing the gap between what's observed on the floor and what's recorded in the system.
04
Root-Cause Discipline
Every unplanned event investigated to root cause and fed back into the PM plan — turning each failure into a permanent reduction in future risk, not a one-time repair.
05
Predictive Analytics
AI models trained on failure history and live condition data, flagging degrading assets days to weeks ahead of a trip — the layer that ties the other four pillars together.
Five Pillars Are Only a Framework Until They're Running in One System.
OxMaint connects condition monitoring, PM ranking, digital inspections, root-cause records, and predictive alerts into one platform — so the framework runs as a system, not five separate spreadsheets.
The Outage Prevention Loop
Each pillar feeds the next in a continuous loop — condition data informs PM ranking, inspections validate what the sensors report, root-cause findings sharpen the predictive model, and the model tightens condition monitoring thresholds.
Condition Monitoring
Risk-Ranked PM
Digital Inspections
Root-Cause Discipline
Predictive Analytics
What Breaks the Loop — Five Common Failure Points
Most plants have some version of these five pillars in place already. What separates a high-reliability fleet from an average one is usually one of these specific breakdowns.
| Break Point | What Goes Wrong | Framework Fix |
| Data Silos |
Condition data lives in one system, PM in another, inspections on paper |
Single CMMS record per asset, feeding every pillar |
| Static PM Ranking |
Backlog worked in ticket order regardless of actual risk |
Automated re-ranking against live condition and failure data |
| Inspection Drift |
Rounds completed inconsistently, findings undocumented |
Structured mobile checklists with mandatory field capture |
| Root Cause Skipped |
Repairs made, but cause never formally investigated |
Root-cause record required to close any unplanned work order |
| No Feedback Loop |
Findings don't change future PM intervals or thresholds |
Predictive model retrained on every closed root-cause record |
Building the Framework — A Realistic Rollout Order
Plants that succeed with this framework rarely implement all five pillars at once. A phased build, in this order, tends to compound fastest.
Phase 1
Digitize Inspections & PM Records
Move rounds and PM history off paper and into a single CMMS record per asset — the foundation every other pillar depends on.
Phase 2
Add Condition Monitoring on Critical Assets
Prioritize the equipment classes with the highest historical failure consequence, not the full fleet at once.
Phase 3
Formalize Root-Cause Investigation
Require a documented root-cause record before any unplanned work order can close — this builds the dataset the predictive model needs.
Phase 4
Introduce Risk-Ranked PM Sequencing
Once condition and root-cause data are flowing, re-rank the PM backlog against actual failure risk instead of calendar order.
Phase 5
Turn On Predictive Analytics
With historical data now structured across all four prior pillars, the predictive layer has enough signal to flag degrading assets accurately.
High-Reliability Fleets vs. the Industry Average
The gap between top-quartile and average-performing fleets isn't small — and it tracks closely with how consistently the five pillars are actually running together, not just documented on paper.
| Metric | Industry Average | High-Reliability Fleet |
| Weighted Forced Outage Rate |
9.2% (2025 NERC figure) |
Typically well under 6% |
| Root-Cause Completion Rate |
Inconsistent, often below 60% |
Consistently above 90% |
| PM Backlog Trend |
Growing faster than it clears |
Stable or declining, risk-ranked |
| Repeat Failure Rate |
Same asset classes recur year over year |
Sharply reduced after root-cause feedback loop matures |
Who Owns Each Pillar on the Plant Floor
The framework only holds together when ownership for each pillar is explicit — ambiguity about who's responsible for closing the loop is one of the most common reasons it breaks down in practice.
Pillar 1–2
Reliability Engineer
Owns condition monitoring thresholds and the logic behind risk-ranked PM sequencing, working from live asset data.
Pillar 3
Maintenance Technicians
Execute and document digital inspections in the field, closing the gap between what's observed and what's recorded.
Pillar 4
Maintenance Supervisor
Enforces the mandatory root-cause record requirement before any unplanned work order is allowed to close.
Pillar 5
Plant Manager / Reliability Lead
Reviews predictive analytics output against real outcomes and adjusts thresholds as the model matures.
Frequently Asked Questions
Is "zero unplanned outages" a realistic target, or just a slogan?
No plant realistically eliminates every unplanned event, but the term describes a direction, not a literal guarantee — fleets running this framework consistently outperform their peers on forced outage rate, even as the industry average has climbed to 9.2% per NERC's latest report. The goal is compounding reduction over time, not a one-time fix.
Which pillar should a plant with limited resources start with first?
Digitizing inspections and PM records first, since every other pillar depends on having structured, centralized data to work from.
Starting in OxMaint with this phase alone typically surfaces enough backlog visibility to justify the next investment.
How does this framework relate to seasonal maintenance planning?
The framework runs year-round, but it gets stress-tested most during high-demand periods.
Seasonal readiness planning is essentially this framework's risk-ranked PM pillar applied against a specific calendar window.
Does root-cause discipline really need to be mandatory to close a work order?
Making it mandatory is what prevents the most common failure point in reliability programs — repairs happening without the underlying cause ever being formally captured. Without that discipline, the predictive analytics pillar has no reliable dataset to learn from, and the same failure mode tends to recur.
How long does a full five-pillar rollout typically take?
Most plants see meaningful results within the first two phases, usually inside two to three months, with the full five-pillar loop maturing over 12 to 18 months as enough historical data accumulates for the predictive layer.
Book a demo to walk through a realistic timeline for your current maintenance maturity.
Every Forced Outage Traces Back to a Broken Loop, Not a Broken Part.
OxMaint runs all five pillars of the outage-prevention framework inside one platform — so the loop stays closed, and the next failure gets caught in the trend line, not the control room.