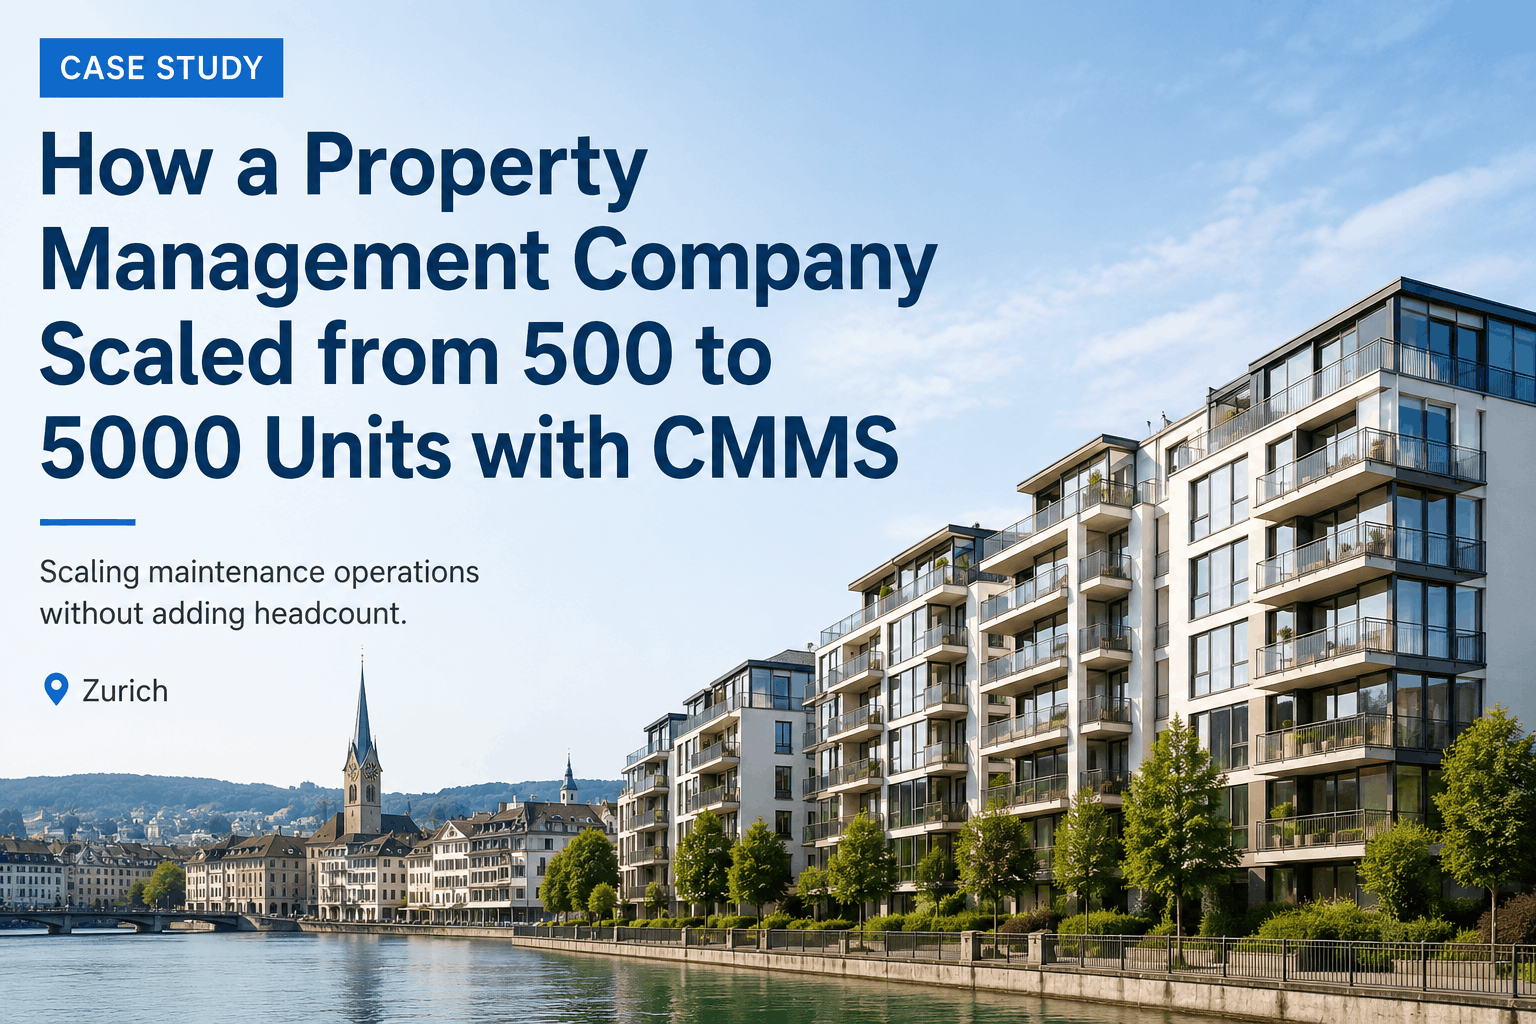
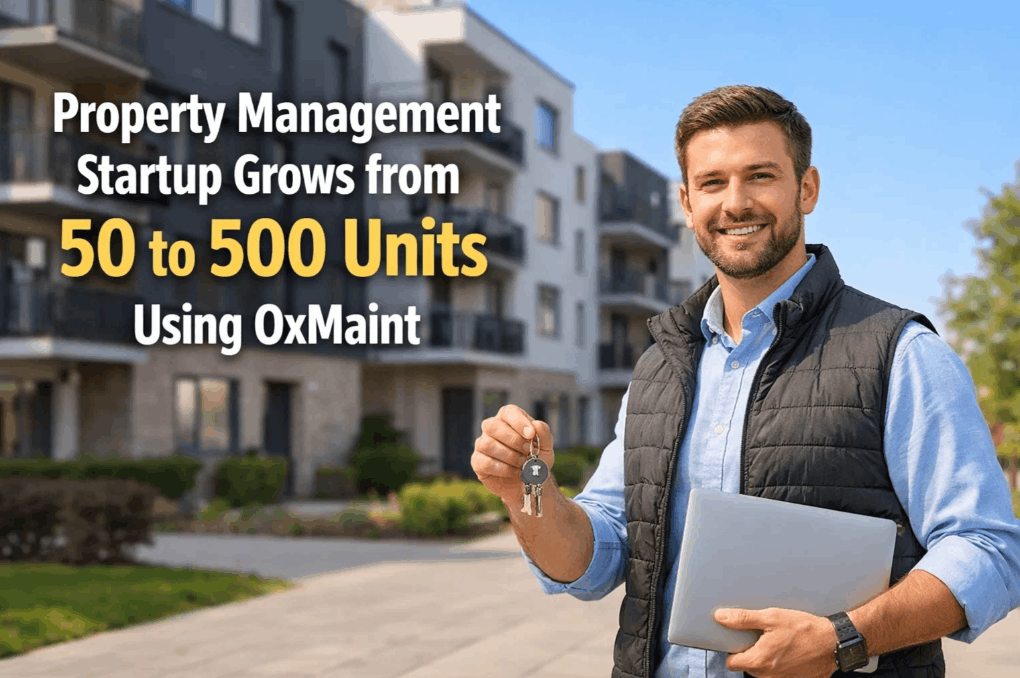
A mid-market property management company grew from managing 500 residential units to 5,000 units across 28 separate properties in five metropolitan markets over five years. This explosive growth created an operational crisis: maintenance coordination across multiple properties became impossible without centralized systems. Tenant requests arrived via phone, email, and portal — often getting lost. Emergency repair decisions were made in isolation by property managers at each location, with no coordination across the portfolio. Vendor relationships were inconsistent — the same HVAC contractor might have different pricing at different properties because no central procurement existed. Maintenance costs varied wildly across the portfolio with no visibility into why. The company was growing rapidly but profitably — until the organizational stress of un-coordinated maintenance began limiting further growth. Adding more properties without better systems would create more chaos, not more profit. After implementing a portfolio-wide CMMS with centralized work order management, vendor integration, and standardized maintenance procedures, the company reduced per-property maintenance costs by 28%, improved maintenance consistency across all 28 properties, and created the operational foundation needed to scale to 10,000+ units without proportional increases in overhead. Start your free trial or schedule a scaling consultation to see how your property portfolio can achieve standardized efficiency at scale.
Property Portfolio Growth & Scaling — 2026
From Chaotic Multi-Property Operations to Standardized Portfolio Efficiency — 5,000-Unit Success
28%
Maintenance cost reduction per unit
Standardized vendor relationships, centralized procurement, and preventive maintenance coordination reduced per-property costs from $1,450 to $1,042 annually per unit
5,000
Units under management
28 properties across 5 metropolitan markets; average portfolio age 12 years; average 180 units per property
42%
Work order response time improvement
Centralized intake and routing reduced average tenant request response from 18 hours to 10.4 hours across portfolio
3.2x
Revenue per maintenance dollar
Lower maintenance costs plus improved tenant satisfaction from faster response = higher retention and ability to command market rents
The Challenge: Scaling Maintenance Operations Without Organizational Chaos
A property management company's growth typically follows a predictable pattern. Start with 5–10 properties managed by a founder and small team. Growth to 50 properties requires adding property managers but the system still works — the founder has relationships with key vendors and knows each property personally. Growth to 100+ properties creates the first major inflection point: the founder cannot know every property, cannot make every maintenance decision, and cannot personally manage every vendor relationship. The systems that worked for 50 properties break under the weight of 100+ properties. This company experienced that inflection point at 500 units and faced it again at 2,500 units and again at 5,000 units. Each inflection forced operational restructuring. At 500 units across 3 properties, the company managed maintenance reactively through phone calls and emails. Each property manager handled their own vendor relationships. An HVAC failure at Property A was resolved by the local manager contracting with a vendor. An HVAC failure at Property B used a different vendor at different pricing because there was no central relationship. An HVAC failure at Property C got delayed because the manager was focused on a plumbing issue. There was no coordination, no standardization, no visibility. As the portfolio grew to 2,500 units across 14 properties, this reactive chaos became operationally unsustainable. Tenant complaints accumulated because requests got lost in email threads. Maintenance decisions took days because property managers were not available. Vendor pricing varied wildly across the portfolio — no economies of scale despite managing 2,500 units. The company added administrative staff to handle the coordination overhead, but the staff could not keep up with the operational complexity. The growth that had been profitable at 500 and 1,500 units was becoming less profitable at 2,500 units because maintenance costs were rising faster than revenue. By the time the portfolio reached 5,000 units, the company understood that further growth without better systems would not be sustainable. The organizational structure could not handle adding more properties — each property added more chaos, not more profit. The operational bottleneck was not capital (the company had funding) or sales capacity (there were more properties to acquire). The bottleneck was the ability to manage maintenance consistently across a geographically dispersed portfolio. Without centralized systems, scaled portfolio management becomes organizational gridlock.
01
Tenant Requests Lost in Fragmented Communication Channels
Tenants call the property office, email a general inbox, use a tenant portal at one property (but not another), or submit requests through a leasing management system. Requests arrive through 4–5 different channels. Without centralized intake, requests get lost between channels, duplicated, or misrouted. Response times vary wildly depending on which property manager is available. Tenant satisfaction suffers not because maintenance is poor, but because request routing is chaotic.
02
Inconsistent Vendor Relationships Across Properties
Each property manager maintains their own vendor relationships. Property A uses Vendor X for HVAC at $150/service call. Property B uses Vendor Y for HVAC at $210/service call. Property C uses Vendor Z at $140/service call. There is no centralized vendor management, no volume discounts, no performance standards enforced across all vendors. The company is managing 5,000 units with the buying power of 20 small properties instead of one large portfolio.
03
No Visibility Into Maintenance Performance Across Portfolio
The CEO cannot answer: "What is our average maintenance cost per unit across the portfolio?" Some properties run at $800/unit/year. Others run at $1,600/unit/year. Why? There is no portfolio-wide dashboard showing which properties have high maintenance costs and which have efficient operations. Is the high-cost property poorly maintained or do they just have older buildings? Are high-performing properties just lucky or do they have better processes? Without visibility, optimization is impossible.
04
Preventive Maintenance Varies by Property Manager Discipline
One property manager schedules preventive HVAC maintenance quarterly and experiences fewer emergency calls. Another property manager focuses on tenant-requested repairs only and experiences frequent emergencies. Without standardized PM scheduling enforced across all properties, maintenance quality is determined by individual manager discipline rather than systematic process. Some properties are well-maintained. Others are deteriorating due to deferred prevention.
Multi-Property Standardization: The Five Operational Pillars of Portfolio-Wide CMMS
A CMMS designed for scaled property portfolios must address the unique operational reality of managing 5,000+ units across multiple properties: centralized visibility, standardized procedures, vendor relationship optimization, and consistent asset management across geographically dispersed locations. Oxmaint's portfolio-wide approach consolidates maintenance operations across five operational pillars that enable growth without organizational chaos.
01
Centralized Work Order Intake From All Channels
All tenant requests routed through single system regardless of submission method
Tenants call the main office, email the portal, or use mobile app — all requests flow into a single system. Each request is time-stamped, prioritized, and routed to the appropriate property. No requests get lost between channels. No duplicate work orders. The central operations team has complete visibility into all maintenance needs across all 28 properties simultaneously.
02
Standardized Preventive Maintenance Schedules Across All Properties
Same PM applied at all locations regardless of property manager preferences
HVAC is serviced quarterly at every property on the same schedule. Plumbing inspections happen annually at all locations. Fire suppression systems are tested on identical timelines across the portfolio. Standardization eliminates the "manager discipline" variable — maintenance quality is consistent because the system enforces it, not because managers remember to do it.
03
Centralized Vendor Management With Portfolio-Level Pricing
All properties use same approved vendors at negotiated portfolio rates
Instead of each property manager negotiating with local vendors, central procurement creates a master vendor list with portfolio-wide pricing. HVAC contractor is approved and priced for all 28 properties. Plumbing contractor is approved for all locations. The portfolio has leverage to negotiate volume discounts that individual properties never could achieve. Emergency vendors are pre-approved so property managers do not need to scramble during crises.
04
Portfolio-Wide Performance Dashboards & KPI Tracking
CEO and senior management see maintenance metrics across all properties in real-time
Dashboard shows maintenance cost per unit for each property, allowing comparison of operational efficiency. Shows emergency repair frequency by property. Shows average response time to tenant requests by location. Shows vendor performance ratings across the portfolio. This visibility enables optimization: properties with high emergency rates can be studied to understand why and corrective actions implemented. Properties with efficient operations become models for others.
05
Scalable Growth Without Proportional Overhead Increase
Adding 500 more units does not require adding proportional administrative staff
The first 500 units require a property manager and administrative support. Adding the next 500 units requires marginal additional support — existing systems handle the volume increase without breakdown. This is the key to profitable scaling: each new property adds maintenance work but not proportional administrative overhead. A centralized CMMS enables the company to grow from 5,000 to 10,000 units without doubling the administrative team.
Scale Your Portfolio Without Losing Control
Grow to 10,000+ Units Without Creating Organizational Chaos.
Oxmaint's portfolio-wide CMMS enables property management companies to centralize work order intake, standardize preventive maintenance, manage vendor relationships at scale, and maintain real-time visibility across all properties. This company reduced maintenance costs by 28%, improved tenant satisfaction through faster response times, and created the operational foundation to triple portfolio size without proportional overhead growth.
Portfolio Scaling Impact: Before and After Operational Metrics
| Operational KPI | Before Portfolio CMMS (fragmented) | After CMMS (portfolio-wide) | Business Impact |
| Maintenance cost per unit annually |
$1,450 average (range $900–$1,800 by property) |
$1,042 average (standardized across portfolio) |
$408 per unit annual savings × 5,000 units = $2.04M annual savings portfolio-wide; 28% cost reduction |
| Tenant request response time |
18 hours average (range 4 hours to 48 hours) |
10.4 hours average (consistent across properties) |
42% faster response; improved tenant satisfaction and reduced turnover; retention improves from 82% to 91% annually |
| Work order submission channels |
4–5 fragmented channels (phone, email, portal at some properties only) |
Single centralized intake system (all channels feed single queue) |
Zero lost requests; no duplicate work orders; operations team has complete visibility across all 28 properties |
| Vendor relationship coordination |
Each property has own vendor relationships; no volume pricing |
Centralized vendor list with portfolio-level negotiated pricing |
Volume discounts across 5,000 units; emergency vendor pre-approval reduces crisis response costs; vendor performance tracked consistently |
| Preventive maintenance completion rate |
72% average — varies by property manager discipline |
94% average — standardized schedules enforced automatically |
Reduction in emergency repairs from 8–12 per month to 2–4 per month; emergency labor costs reduced 65% |
| Time to answer "What is maintenance cost at Property X?" |
2–3 days of manual report assembly from multiple systems |
Instant — dashboard shows per-property metrics in real-time |
Enable optimization: identify high-cost properties and study what drives cost differences; apply best practices across portfolio |
| Administrative overhead per property |
$35,000–45,000 annually (property manager + coordinator) |
$18,000–22,000 annually (systems handle coordination) |
Added 500 units without adding proportional administrative staff; profit per property remains stable as portfolio grows |
Customer Testimonial: VP of Operations, 5,000-Unit Property Management Company
"When we hit 2,500 units, we realized our property-by-property management approach was breaking. Tenant requests were getting lost. Maintenance costs varied wildly across properties and we didn't know why. Vendor pricing was inconsistent. We were adding properties but profit per property was declining because administrative overhead was growing faster than revenue. We either needed to stop growing or fix the operations. Oxmaint gave us a centralized system that could handle the operational complexity. Now all tenant requests flow through one system. All properties use the same preventive maintenance schedules. Vendors are approved and priced at portfolio level. We can see exactly what maintenance costs are at each property and benchmark them against each other. That visibility alone drove a 28% cost reduction — we implemented best practices from our most efficient properties across the entire portfolio. We reduced average response time to tenant requests from 18 hours to 10 hours, which dramatically improved tenant retention. We added 1,000 more units after implementing Oxmaint without adding proportional administrative overhead. The system created the operational foundation to scale beyond 5,000 units. Now we're confident we can grow to 10,000 units without organizational chaos. That confidence is what this system gave us."
VP of Operations, 5,000-Unit Multi-Property Management Portfolio, USA
Portfolio CMMS Features: Purpose-Built for Multi-Property Scaling
01
Centralized Tenant Request Intake & Routing
All tenant requests — phone calls, emails, mobile app submissions, web portal entries — flow into a single system. Each request is time-stamped, property-identified, and routed to the appropriate property manager. No requests get lost between channels. Central operations team has complete visibility of all pending requests across all 28 properties.
100% request capture; zero lost requests; real-time queue visibility
02
Standardized Preventive Maintenance Across All Properties
Define preventive maintenance schedules at the portfolio level. HVAC is serviced quarterly at all 28 properties on the same schedule. Plumbing inspections happen annually everywhere. The system automatically generates work orders at each property based on the standardized schedule, ensuring consistent maintenance regardless of property manager preferences or staff turnover.
Consistent maintenance quality across all 5,000 units; reduced emergency rates uniformly
03
Central Vendor Management & Portfolio-Level Pricing
Maintain a master vendor list approved and priced at portfolio level. HVAC contractor approved for all 28 properties at negotiated rate. Plumbing contractor approved across all locations. Emergency vendors pre-approved so property managers do not need to scramble during crises. Vendor performance is tracked and compared across all properties, with poor performers flagged for termination and superior performers expanded.
Volume discounts for 5,000-unit portfolio; vendor consistency; emergency response certainty
04
Portfolio-Wide Dashboard & Property-Level Performance Metrics
CEO and senior management see maintenance cost per unit for each property, allowing instant comparison. Shows emergency repair frequency by location. Shows average response time by property. Shows vendor performance ratings. This visibility enables optimization: high-cost properties are studied to understand cost drivers, and best practices are applied across the portfolio.
Portfolio-level KPI visibility enabling continuous optimization
05
Scalable Architecture Supporting 5,000–50,000+ Units
Oxmaint's architecture is built to scale. Adding 500 more units does not require proportional administrative overhead increases. The system handles operational complexity that would otherwise force staffing growth. This enables property companies to grow from 5,000 to 10,000 to 25,000+ units without proportional increases in administrative staff.
Profitable scaling without organizational chaos or overhead explosion
06
Integration With Existing Financial & Leasing Systems
Oxmaint integrates with major property management accounting systems and leasing platforms. Work order costs post directly to unit-level financials. Tenant information from leasing platform flows to maintenance system for context. Integration setup typically takes 2–4 weeks and eliminates manual data entry between systems.
Seamless data flow across financial, leasing, and maintenance operations
Frequently Asked Questions: Property Management Scaling with CMMS
How do we migrate from property-by-property management to centralized CMMS without disrupting operations?+
Oxmaint operates alongside existing systems during transition. Start by centralizing critical work orders at 3–4 pilot properties. Most companies achieve 100% centralized intake and routing within 6–12 weeks across full portfolio. Transition happens gradually without operational disruption; existing processes continue while new systems ramp.
What if property managers have different vendor relationships they want to maintain?+
Centralized vendor management creates better outcomes than dispersed relationships — portfolio leverage generates volume discounts no individual property could negotiate alone. We recommend moving vendor relationships to portfolio level gradually. Conduct vendor performance reviews across all properties to identify superior performers to expand and underperformers to replace. Transition takes 3–6 months but delivers measurable cost savings.
Can property managers still have autonomy over local maintenance decisions while using a centralized system?+
Yes. Standardized PM schedules are portfolio-wide, but property managers retain decision-making authority on emergency response, vendor selection from approved list, and repair vs. replace decisions. The system enforces minimum standards while allowing local flexibility on execution details.
How does Oxmaint handle properties with different ages/conditions and different maintenance needs?+
Properties are configured with different asset profiles and PM schedules based on building age, condition, and asset inventory. Newer properties with modern HVAC systems have different schedules than older properties with aging systems. The system accommodates property-specific configurations while maintaining portfolio-level coordination and visibility.
What prevents property managers from resisting centralized systems they perceive as reducing their autonomy?+
Show property managers how centralization benefits them. Standardized PM reduces their decision-making burden. Pre-approved vendors eliminate vendor search stress during crises. Centralized intake means they are not hunting through email for lost requests. Most managers embrace systems that reduce their workload and give them better tools. Implementation should include property manager training and input on system configuration.
Can Oxmaint integrate with our existing leasing and accounting systems?+
Yes. Oxmaint integrates with major property management platforms (AppFolio, Buildium, etc.) via APIs. Work order costs post directly to unit-level financials. Tenant information flows to maintenance system. Integration setup typically takes 2–4 weeks and eliminates manual data entry between systems.
How long before we see ROI from implementing Oxmaint across 5,000+ units?+
Most companies see measurable cost reduction within 30 days through vendor consolidation and PM standardization. A 28% cost reduction ($2M+ annually for a 5,000-unit portfolio) means ROI is achieved within 3–6 months. Beyond financial ROI, operational improvements (faster response times, consistent maintenance quality, visibility) are realized immediately.
Property Management Scaling — Oxmaint
From Fragmented Property-by-Property Operations to Integrated Portfolio Management.
Centralized work order intake, standardized preventive maintenance, portfolio-level vendor management, and real-time performance dashboards enable property companies to scale from 5,000 to 10,000+ units without proportional increases in administrative overhead. This company reduced maintenance costs by 28%, improved tenant response times by 42%, and created the operational foundation to triple portfolio size profitably. Your property portfolio can achieve the same transformation.
28%
Cost reduction per unit
$2.04M
Annual portfolio savings
42%
Response time improvement