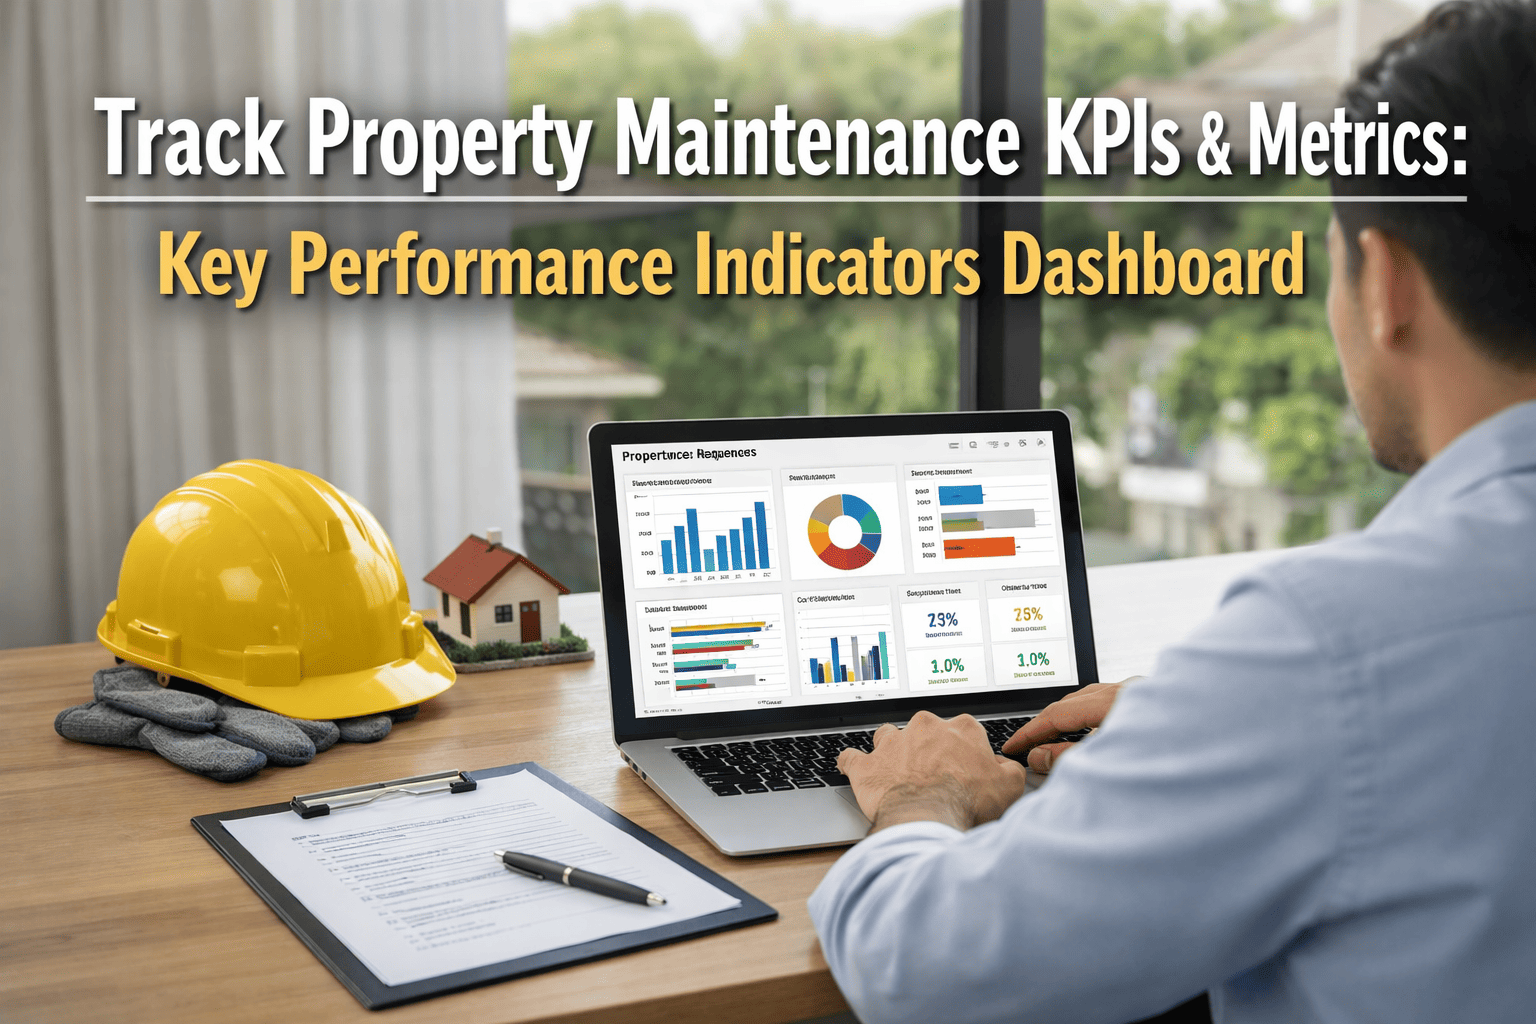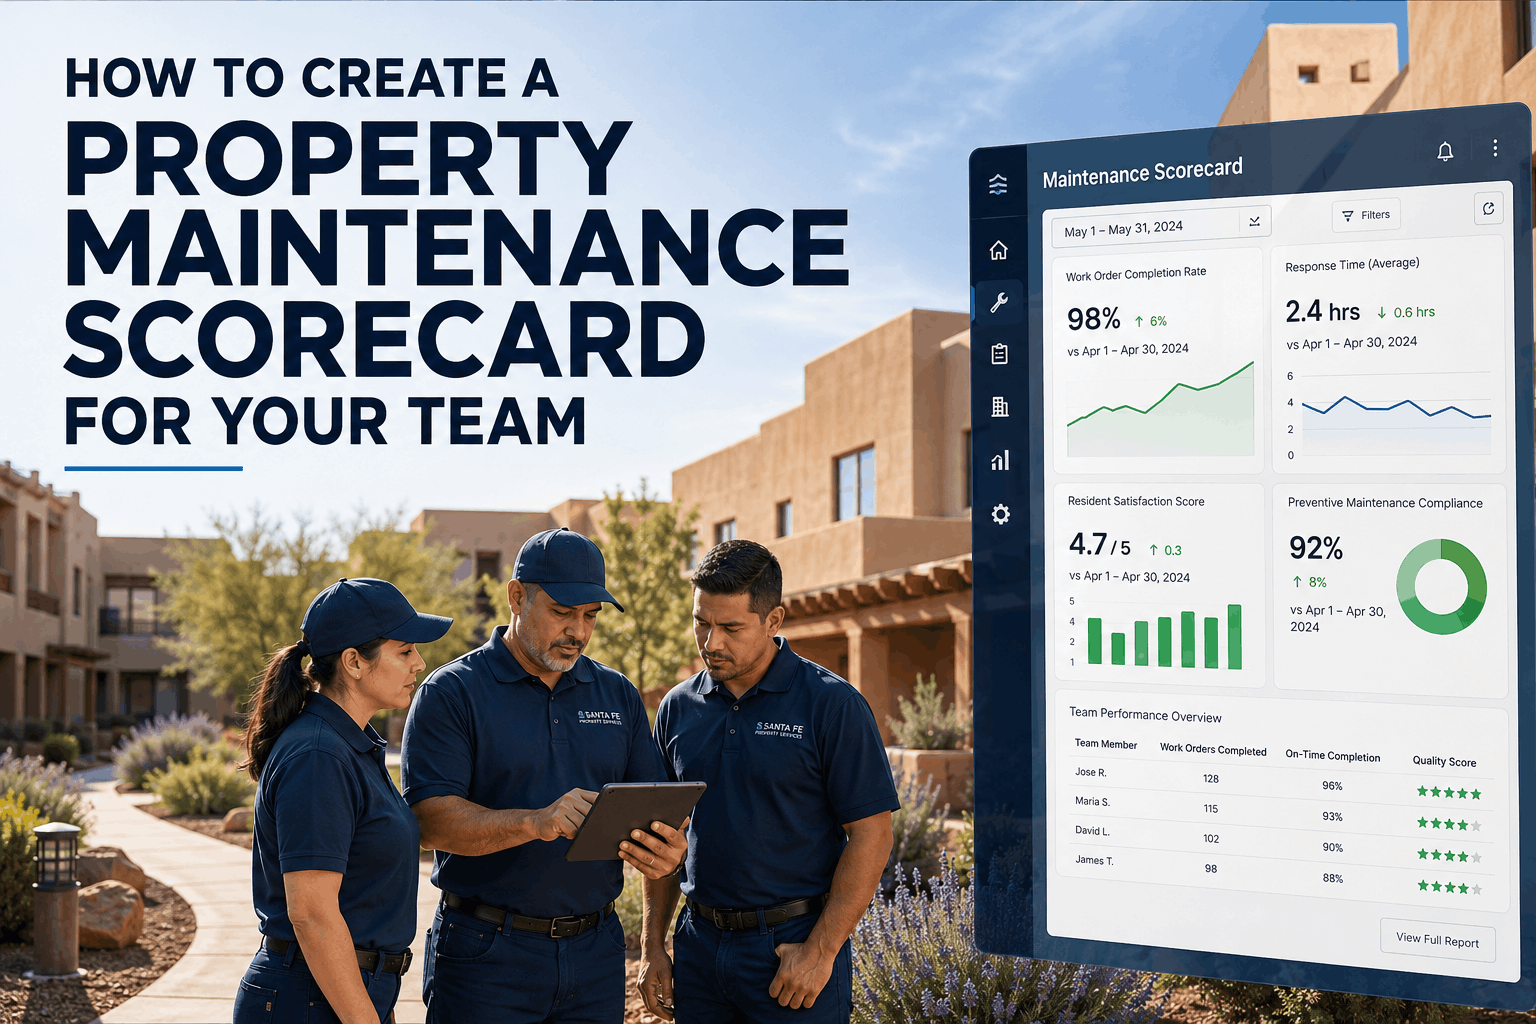
Property maintenance is invisible when it works. Nobody celebrates the fact that the HVAC system ran reliably for six months. Nobody gives bonuses for the roof not leaking. Success in maintenance means problems don't happen — which makes it extremely difficult to measure, justify, and improve. How does a maintenance director prove to the CFO that their $500,000 annual maintenance budget is generating value? How does a property manager evaluate technicians when the primary outcome (no breakdowns) is largely invisible? How does an organization know whether their maintenance operation is improving or declining year-over-year? The answer: a comprehensive maintenance scorecard. A maintenance scorecard is a balanced set of metrics that measure what actually matters — not just cost, but also quality, timeliness, safety, compliance, and team capability. OxMaint's scorecard module transforms maintenance data into actionable performance indicators: financial metrics (cost per square foot, maintenance spending trends), customer metrics (tenant satisfaction, repair turnaround time), internal process metrics (preventive maintenance compliance, work order completion rate), and learning metrics (technician certifications, training completion, innovation adoption). Property managers using OxMaint's scorecard report improved operational efficiency by 22%, higher tenant satisfaction scores by 18 points, and reduced emergency repairs by 31% — all driven by visibility into what's actually happening in maintenance operations. When you can measure it, you can manage it. When you can manage it, you can improve it.
Section 1: The Balanced Scorecard Framework for Maintenance Operations
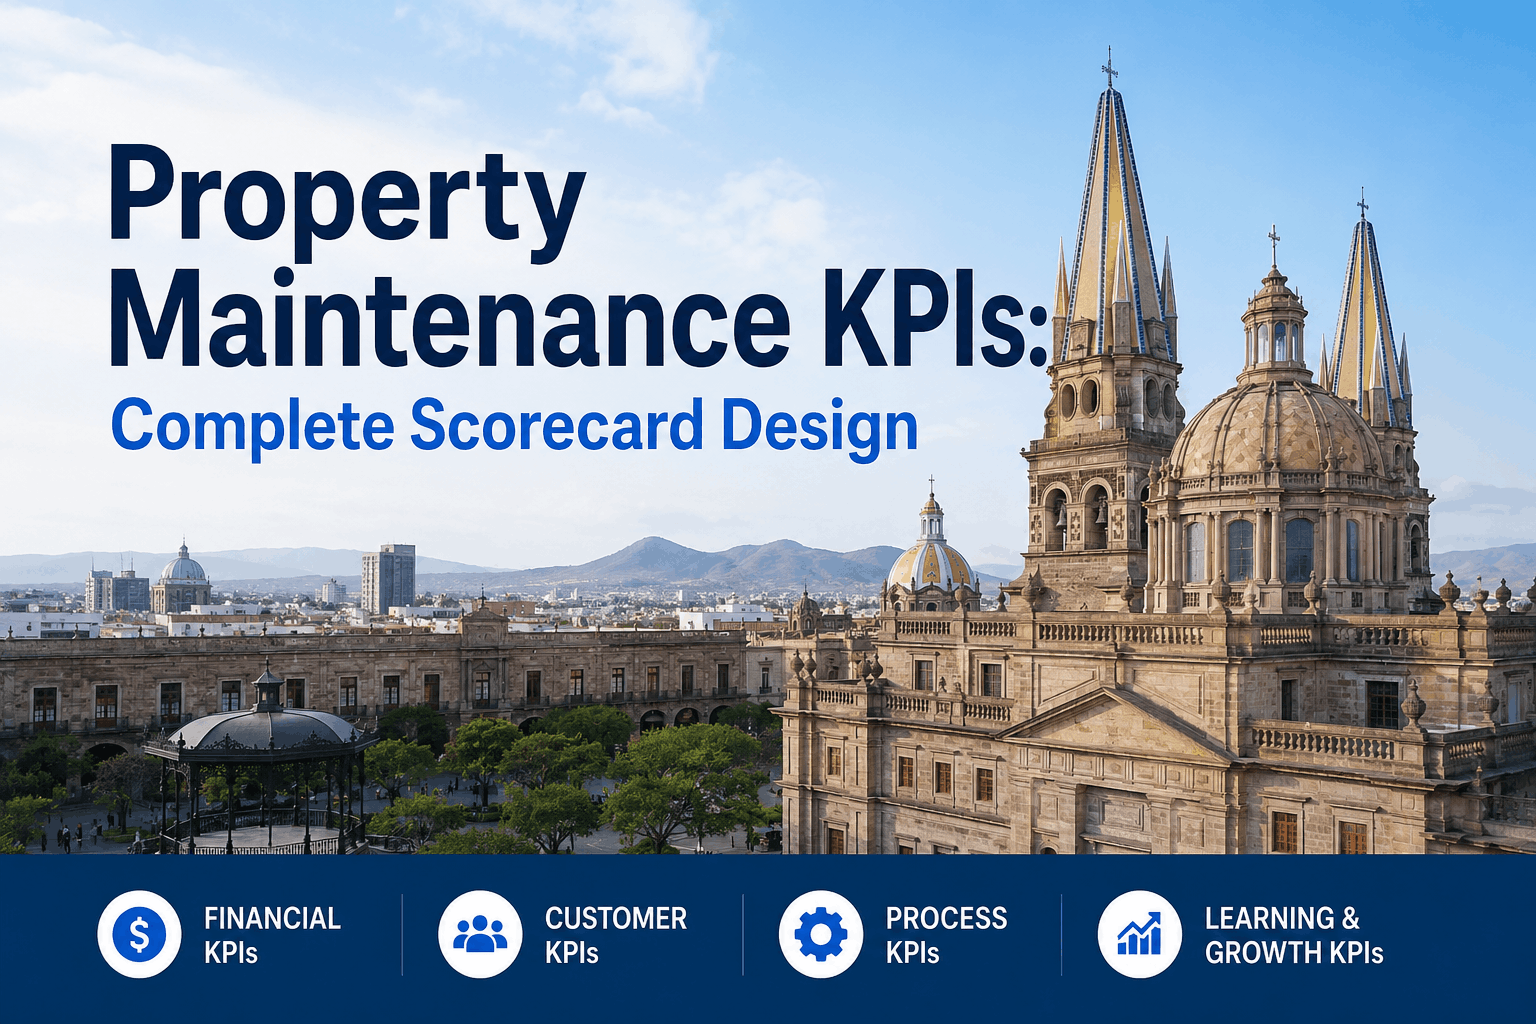
The Balanced Scorecard is a strategic performance management system developed by Kaplan and Norton. The original framework measured organizational performance across four perspectives: financial, customer, internal process, and learning and growth. This framework has been adapted across industries — including facility management and property maintenance — to provide holistic performance measurement. Rather than focusing exclusively on cost (which leads to under-investment and deteriorating asset quality), a balanced scorecard forces organizations to measure multiple dimensions simultaneously: (1) Financial Perspective: cost management, budget compliance, cost-per-square-foot efficiency, (2) Customer Perspective: tenant satisfaction, repair turnaround time, quality ratings, (3) Internal Process Perspective: preventive maintenance compliance, work order accuracy, safety incidents, regulatory compliance, (4) Learning and Growth Perspective: technician certifications, training hours, staff retention, innovation adoption. When all four perspectives are measured together, organizations get a complete picture of maintenance operation health. A property manager might achieve excellent financial performance (low costs) but poor customer satisfaction (slow repairs) and low compliance (missed preventive maintenance). This pattern reveals an under-resourced operation that is cutting corners to meet budget targets. Conversely, a manager might achieve excellent customer satisfaction and high compliance but poor financial performance and no staff retention — suggesting an operation that is burning out people and money. A truly healthy maintenance operation balances all four dimensions: it delivers financial efficiency AND customer satisfaction AND process compliance AND team development. OxMaint captures the data needed to measure all four perspectives and presents them on a single dashboard called the Maintenance Scorecard.
Section 2: Financial Metrics — Measuring Maintenance ROI and Cost Efficiency
Financial metrics are the foundation of maintenance performance measurement. They answer the question: Are we spending money wisely on maintenance? The key financial metrics include: (1) Maintenance Cost Per Square Foot: total annual maintenance spending divided by total property square footage. Industry benchmark is $1.50–$2.50 per square foot annually depending on property age and type. Trend over time shows whether maintenance spending is rising (indicating aging assets or deferred maintenance accumulating), stable (indicating steady-state operations), or declining (potentially indicating deferred maintenance — repairs being skipped to reduce costs). (2) Preventive vs. Reactive Spending Ratio: percentage of maintenance spending allocated to planned preventive maintenance versus emergency repairs. Industry best practice is 80% preventive, 20% reactive. Organizations with low preventive spending percentages (60% or lower) experience higher failure rates, more emergency repairs, higher costs, and more tenant disruption. (3) Budget Variance: actual spending versus planned budget. Organizations that consistently overspend indicate either poor planning or under-resourced operations. Organizations that consistently underspend relative to building conditions indicate deferred maintenance. (4) Cost Avoidance Through Prevention: estimated costs of failures prevented through preventive maintenance. For example, if an HVAC system receives regular maintenance, the cost of a compressor replacement is avoided (typical cost: $8,000–$15,000). Tracking prevented failures quantifies the ROI of prevention spending. (5) Maintenance Productivity: labor hours per work order completed. Trend improvement indicates technicians are becoming more efficient. Trend degradation indicates skill gaps, tool deficiencies, or process inefficiencies slowing technicians down. OxMaint captures all five metrics in real-time and displays them on the financial section of the maintenance scorecard. Property managers can see whether their operation is trending toward greater efficiency or deteriorating performance, and can identify which specific costs are driving variance from budget.
"Before we implemented the balanced scorecard, our CFO had no idea whether we were managing maintenance efficiently or just spending money. Once we showed him the dashboard with all four perspectives — financial, customer, process, compliance — he could see that yes, our spending was appropriate for our property age, and our tenant satisfaction was excellent. The scorecard became our justification for a $150,000 annual maintenance budget increase, supported by data." — David Chen, Director of Facilities, Seattle, WA
Section 3: Customer and Operational Metrics — Quality, Speed, and Satisfaction
Financial efficiency is meaningless if maintenance operations are failing to serve the customers they're supposed to serve: tenants, building occupants, and property owners. Customer metrics measure how well the maintenance operation delivers value from the customer's perspective. The key customer metrics include: (1) Repair Turnaround Time: average time from work request submission to completion. Benchmark varies by repair type — emergency repairs (HVAC, plumbing) should be 4 hours or less, routine repairs 2–5 days, deferred maintenance 30 days. Trend improvement indicates the operation is responding faster. Trend degradation indicates staffing issues or backlog accumulation. (2) Work Request Fulfillment Rate: percentage of work requests completed as requested by deadline. Target: 95%+. Below 95% indicates over-committed resources or poor work order prioritization. (3) Tenant Satisfaction Score: post-repair surveys asking tenants to rate quality, speed, and professionalism on a 1–10 scale. Average across all repairs indicates maintenance operation quality from customer perspective. Target: 8.0 or higher. (4) Safety Incidents: OSHA-reportable incidents, near-misses, and injuries involving maintenance staff. Trend should be consistently declining. Rising incidents indicate safety culture degradation. (5) Compliance Violations: violations of building codes, regulatory requirements, or maintenance standards. Target: zero violations. Rising violations indicate deferred maintenance or compliance gaps. (6) Emergency Repair Rate: percentage of repairs handled as emergencies (unplanned) versus planned preventive maintenance. High emergency rates (above 25%) indicate inadequate preventive maintenance and reactive operations. OxMaint measures all six customer metrics continuously and displays trends on the customer section of the scorecard.
Section 4: Process and Compliance Metrics — The Health of Maintenance Operations
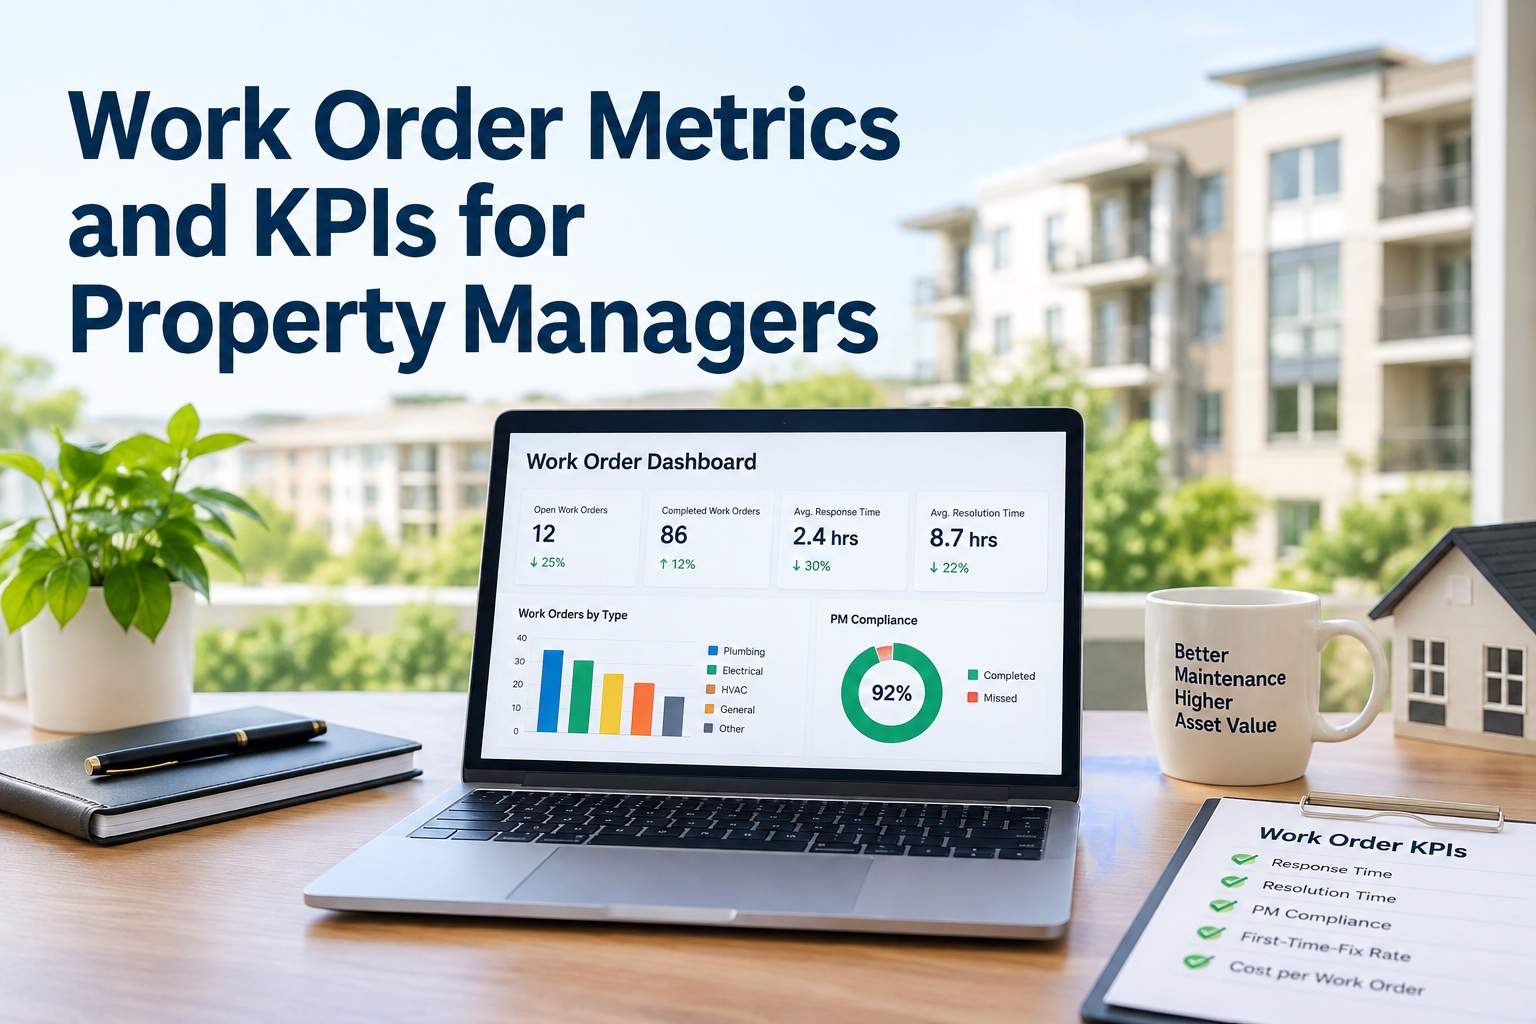
Process metrics measure how well the maintenance operation executes its core functions. These metrics reveal whether the operation has the systems, discipline, and rigor to maintain assets reliably. The key process metrics include: (1) Preventive Maintenance Compliance: percentage of scheduled preventive maintenance tasks completed on or before the scheduled date. Target: 95%+. Compliance below 90% indicates that planned maintenance is routinely deferred, creating deferred maintenance backlog. (2) Work Order Accuracy: percentage of work orders completed with all required documentation (description, date, time, technician, photos, parts used, labor hours, follow-up recommendations). Target: 100%. Below 95% indicates data quality issues that compromise reporting and planning. (3) Mean Time Between Failures (MTBF): average time elapsed between successive failures of the same asset or system. Trend improvement indicates better maintenance. Trend degradation indicates asset aging or maintenance quality decline. (4) First-Time Fix Rate: percentage of repair work orders resolved on first visit (not requiring return visits). Target: 90%+. Below 90% indicates technicians lack skills, parts, or information to fix issues properly on first contact. (5) Asset Condition Index: quantitative measure of asset condition based on inspection data, repair history, and age. Trend should be stable or improving. Declining trend indicates assets aging beyond design life and approaching end-of-life replacement. (6) Regulatory Compliance Rate: percentage of regulatory inspections passed without violation. Target: 100%. Violations indicate maintenance gaps or non-compliance with code requirements. OxMaint measures process metrics through work order data, inspection records, and failure tracking, displaying trends on the process section of the scorecard.
Section 5: Learning and Growth Metrics — Building a World-Class Team
The fourth dimension of a balanced scorecard is learning and growth — the investments in people and capability that enable the organization to improve over time. Maintenance operations that invest in training, certifications, and staff development create capabilities that drive all other metrics: financial, customer, and process. Learning and growth metrics include: (1) Staff Certification Rate: percentage of maintenance technicians holding industry-recognized certifications (EPA for refrigerant handling, HVAC certifications, electrical licenses, etc.). Target: 100% for critical roles. Higher certification rates correlate with better quality work and higher compensation. (2) Training Hours Per Technician: annual hours spent in formal training (classroom, online, manufacturer training, etc.). Target: 40+ hours annually. Organizations investing in training see better technician retention, higher quality work, and faster problem-solving. (3) Staff Retention Rate: percentage of maintenance staff remaining with the organization year-over-year. Target: 90%+. Below 85% indicates dissatisfaction, burnout, or poor management. High turnover increases training costs and reduces operational quality. (4) Knowledge Capture: percentage of maintenance processes documented in standard operating procedures, with photos and videos. Target: 100%. Well-documented processes enable consistency across teams and faster onboarding of new technicians. (5) Skill Gap Analysis: assessment of current skills versus skills required for planned initiatives (transition to preventive-based operations, adoption of new technologies, etc.). Organizations regularly conducting skill gap analysis can proactively train staff to meet future needs. (6) Innovation Adoption: percentage of recommended process improvements or new technologies successfully implemented by the team. High adoption rates indicate a culture of continuous improvement. OxMaint captures learning metrics through training records, certification tracking, staff tenure data, and SOP documentation, displaying them on the learning section of the scorecard. Property managers can identify skill gaps and training needs to plan professional development initiatives that improve team capability.
.png)