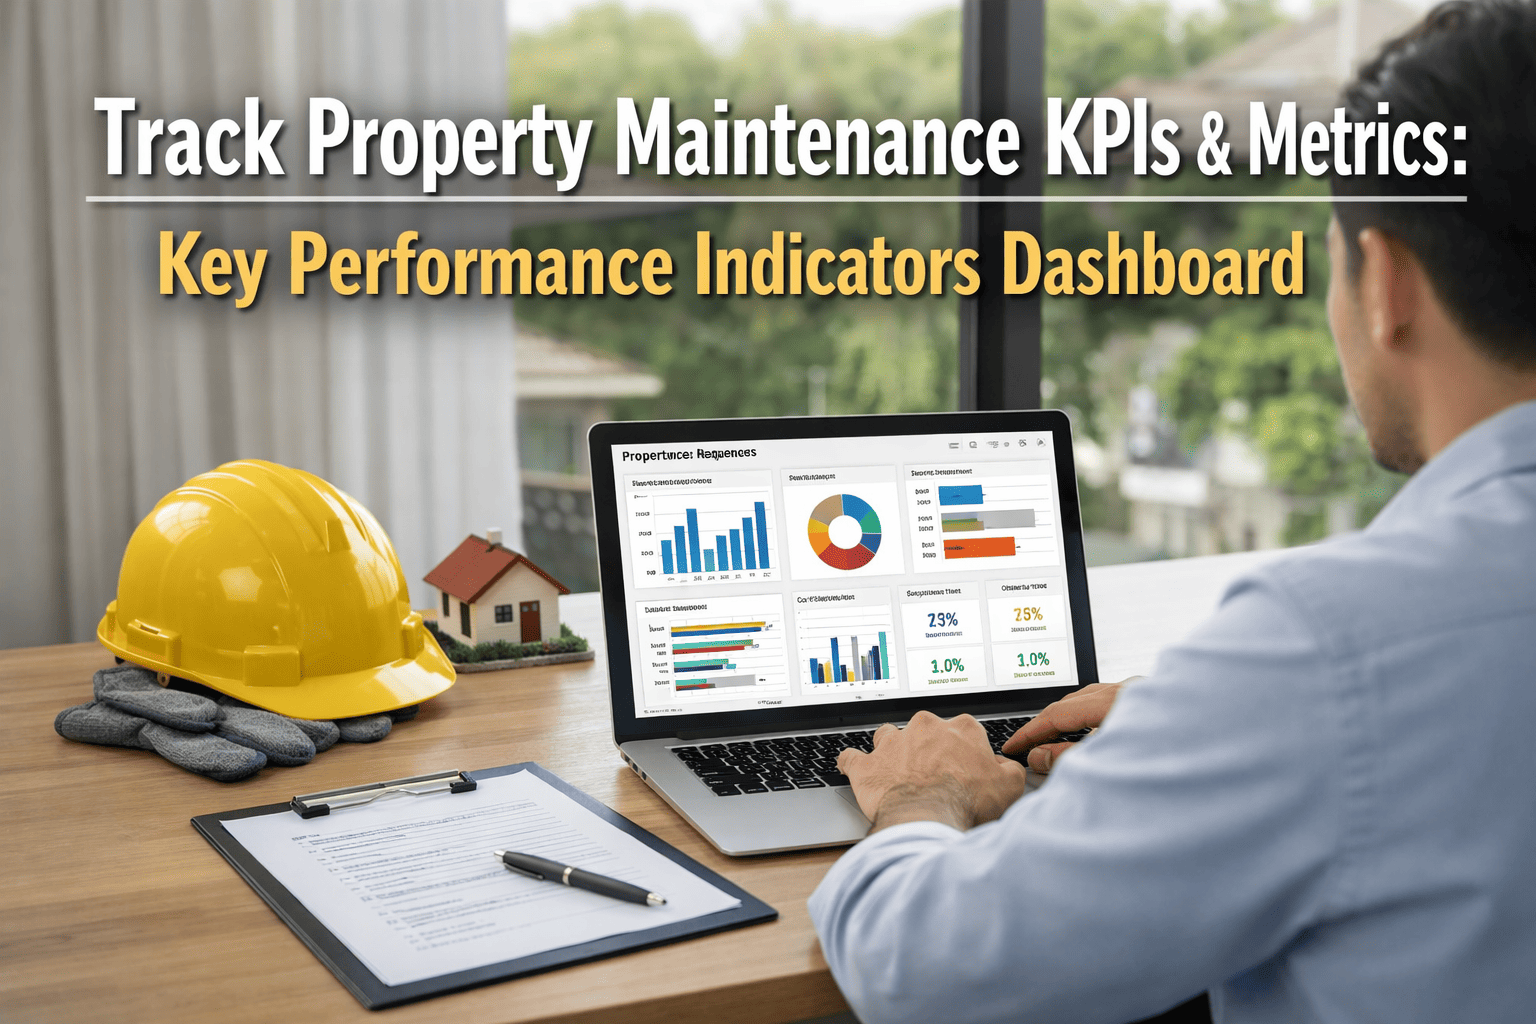
Property maintenance teams often operate in the dark—measuring what's easy to see rather than what actually drives profitability. A property manager tracks work orders completed this month (88 orders) without knowing whether those repairs were fixing chronic problems or just temporary band-aids. Without MTTR, MTBF, first-time fix rates, and PM compliance metrics, every maintenance decision looks reasonable because there's no reference point for what acceptable actually means. A property running $0.72 per square foot in maintenance costs while top-quartile properties operate at $0.44/sq ft isn't understaffed—it's unmeasured. The financial gap between measured and unmeasured maintenance operations is dramatic: properties tracking KPIs against industry benchmarks reduce maintenance costs by 28-41% within 12 months without increasing budget or staff. The reduction comes from eliminating emergency premiums, repeat visits, and reactive firefighting that characterizes unmeasured programs. This comprehensive guide covers the 15-20 essential property maintenance KPIs: mean time to repair, first-time fix rate, preventive maintenance compliance, work order response time, maintenance cost per unit, tenant satisfaction, asset uptime, emergency work ratio, vendor SLA performance, and the dashboard design that converts these metrics into daily operational decisions and quarterly strategic planning. Property managers who implement balanced KPI scorecards gain competitive advantage: faster tenant response, lower emergency repair costs, better vendor performance, and the data foundation to justify maintenance investment to ownership groups and lenders. Start free to build your KPI dashboard, or book a demo to see how OxMaint tracks maintenance performance against live industry benchmarks every reporting period.
Stop Guessing About Maintenance Performance: Track KPIs That Drive Profitability
OxMaint measures MTTR, first-time fix rates, PM compliance, cost per unit, and tenant satisfaction—comparing your property metrics against live industry benchmarks so you see exactly where improvements generate ROI and where maintenance budgets are being wasted.
Maintenance KPI Categories: Efficiency, Reliability, Cost, and Satisfaction Balanced Metrics
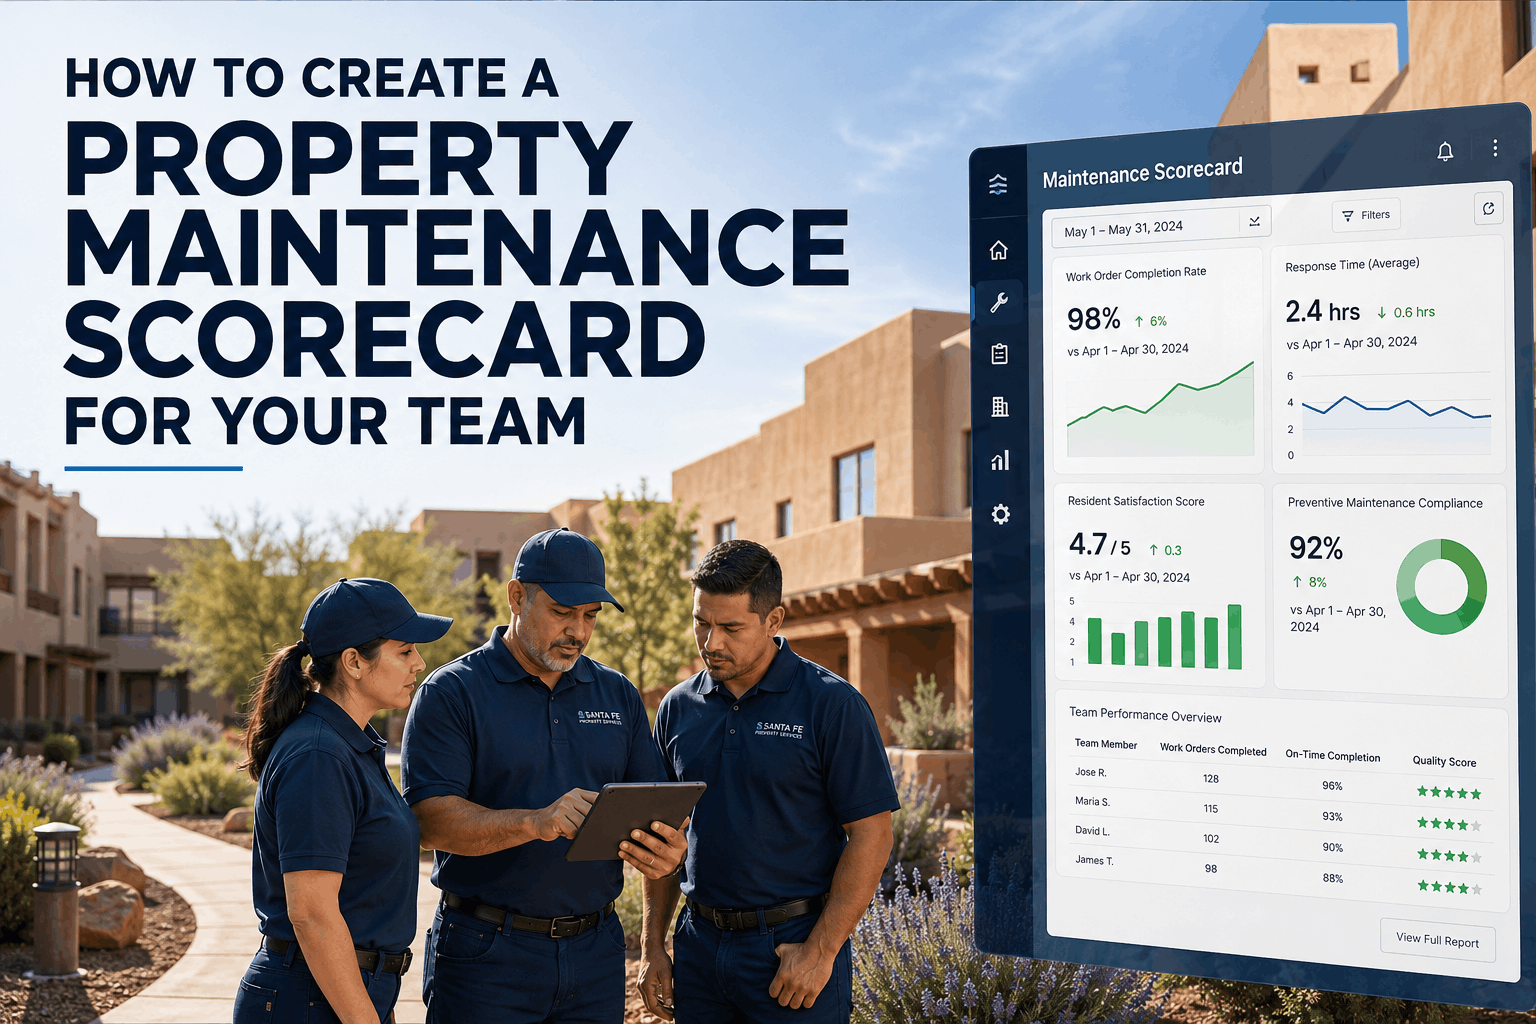
A complete property maintenance scorecard tracks metrics across four balanced dimensions: operational efficiency (MTTR, response time, work order completion rate), asset reliability (MTBF, PM compliance, uptime percentage), financial performance (cost per unit, emergency ratio, preventive-to-reactive shift), and tenant/customer outcomes (satisfaction score, lease renewal rate, complaint escalations). Most property managers unconsciously bias toward one dimension—typically cost because it's easiest to measure—while ignoring the others. A property manager focused exclusively on cost reduction might eliminate preventive maintenance to cut spending, inadvertently driving up emergency repairs that cost 3-5x more per event. A property focused on tenant satisfaction might respond to every request instantly, generating excessive service costs relative to industry norms. Balanced KPI tracking forces tradeoff visibility: implementing 95%+ preventive maintenance compliance costs more labor upfront but reduces emergency premiums over 6-12 months, resulting in net cost reduction. Improving MTTR from 24 hours to 6 hours increases technician utilization and potentially staffing costs, but improved response drives tenant satisfaction and lease renewal, offsetting costs through retention revenue.
The second critical principle is benchmarking. A property manager reporting "our MTTR is 18 hours" without reference context tells the board nothing. MTTR averaging 18 hours for emergency repairs is world-class (industry benchmark is 4-6 hours for non-emergencies). MTTR averaging 18 hours for routine work orders is poor (benchmark is 8-16 hours). Properties compare KPIs against industry benchmarks by property type, climate, building age, and tenant mix. Top-quartile commercial office buildings run MTTR under 4 hours for critical systems, 8-10 hours for routine work. Properties below 12 hours for emergency work and 16+ for routine work are typically bottom-quartile in operational efficiency. OxMaint's KPI dashboards surface benchmark comparisons automatically—showing property managers not just their metrics, but how they rank against industry peers and what specific improvements drive highest ROI.
Average duration from issue report to resolution for emergency, urgent, and standard requests. Industry benchmarks: emergency repairs 4-6 hours, routine 8-16 hours. Tracks where repair time is being lost: parts availability, technician diagnosis, scheduling delays. Lower MTTR directly correlates with higher tenant satisfaction.
Percentage of maintenance requests resolved without return visit. Top-quartile properties maintain 88%+ FTFR; below 72% indicates inadequate diagnosis, parts inventory shortages, or technician skill gaps. Properties with low FTFR spend 2.4x more on labor because technicians make multiple trips.
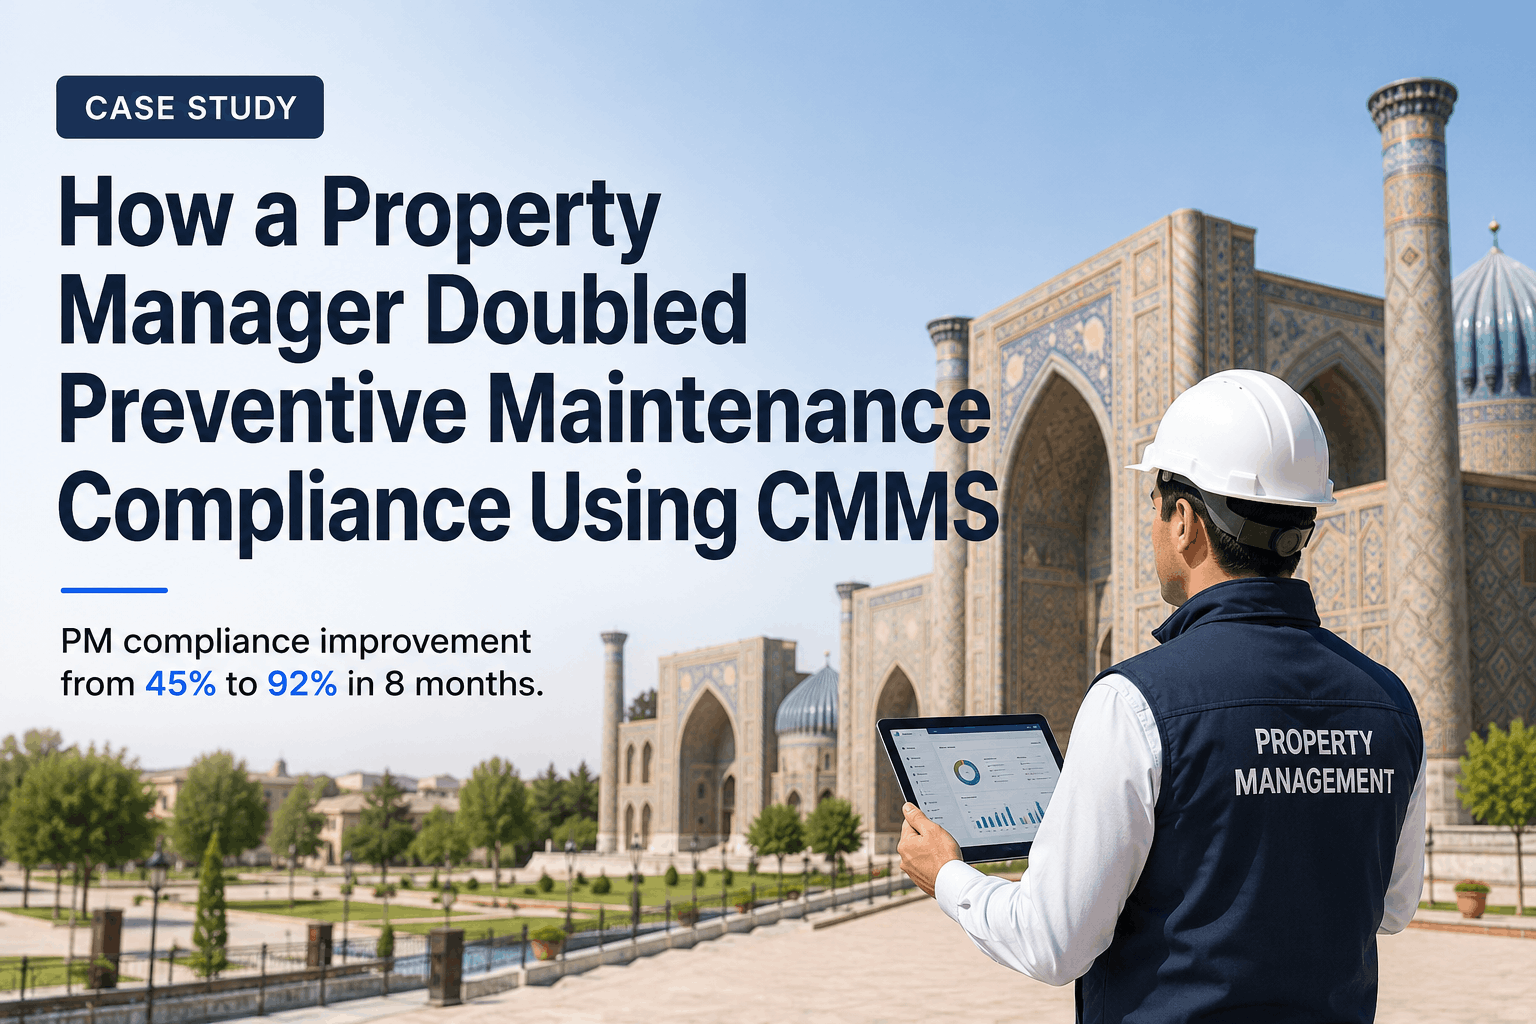
Percentage of scheduled PM tasks completed on time. Industry benchmark 90%+ for world-class operations. Below 80% signals resource or scheduling issues. PM compliance directly drives down emergency repair frequency—highest ROI metric in maintenance KPI portfolios.
Average interval between equipment failures and percentage of time assets remain operational. MTBF trending shows whether condition is improving or degrading. Asset uptime target 90%+ for general equipment, 95%+ for critical systems, 98%+ for Class A office buildings.
Total monthly/quarterly maintenance spend divided by unit count. Industry ranges $0.44-$0.72 per square foot depending on building type and age. Tracks whether maintenance spending is increasing or decreasing and whether actual costs match budgeted amounts.
Quarterly tenant satisfaction surveys tracking overall satisfaction and specific satisfaction with maintenance responsiveness. Research shows properties with 95%+ SLA compliance achieve 4.2/5 satisfaction; 75% compliance achieves 3.2/5. Directly correlates with lease renewal rates.
Core Property Maintenance KPI Metrics: The Balanced Scorecard Framework
MTTR measures average duration from issue report to completion. Calculate by summing total repair time for all incidents in period, dividing by number of repairs. For example: three repairs taking 2h, 3h, and 4h = MTTR of 3 hours average. Benchmark targets: 4-6 hours for emergency critical systems, 8-16 hours for routine work orders. Properties exceeding 24 hours for non-emergency work typically have resource constraints or first-time fix problems. MTTR directly impacts equipment availability, tenant satisfaction, and cost—faster repairs reduce downtime costs, improve tenant experience, and reduce cascade damage from extended outages. Organizations tracking MTTR by technician, system, and request type identify exactly where efficiency breaks down and implement targeted improvements.
Percentage of maintenance requests resolved without a return visit. Top-quartile properties maintain 88%+ FTFR. Below 72% signals inadequate diagnosis, parts inventory shortages, or technician skill gaps. Properties with low FTFR spend 2.4x more on labor because technicians make multiple trips to same issue. Improving FTFR from 70% to 85% reduces total labor costs 15-20% even if technician wages increase slightly. Root causes of low FTFR: inadequate technician training, parts inventory gaps, diagnostic procedures missing critical steps, or insufficient time allocated for initial diagnosis. Tracking FTFR by technician, issue category, and system reveals which areas need improvement—pointing toward training programs, inventory optimization, or staffing adjustments that generate measurable ROI within 60-90 days.
Percentage of scheduled PM tasks completed on time. Calculation: PM tasks completed on time ÷ PM tasks scheduled × 100. Industry benchmark 90%+ for world-class operations. Sustained compliance above 90% is precondition for reliability improvement—compliance below 75% over two consecutive quarters usually explains higher failure frequency. Properties creating rigorous PM schedules but allowing day-to-day reactive work to crowd out planned maintenance destroy the value of preventive programs entirely. PM compliance tracking exposes this failure mode and creates management visibility to protect scheduled work from reactive disruption. A property reporting 85% PM compliance might believe execution is solid—until compared to world-class 95%—revealing 10% schedule slippage translating to dozens of deferred maintenance actions quarterly.
Ratio of reactive emergency repairs to planned preventive maintenance work. Industry average 55-70% reactive (meaning 30-45% planned). Top-performing portfolios shift toward 80%+ planned maintenance—indicating mature, proactive program. Emergency repairs cost 3-5x more per event than same work performed as planned maintenance. Every 10% shift from reactive to planned typically reduces maintenance cost 8-12%. This ratio is one of most sensitive leading indicators of maintenance program quality: when reactive work drops below 20%, MTTR, MTBF, and cost per unit all improve simultaneously because technicians are no longer constantly interrupted by emergency fires while scheduled work accumulates overdue. Tracking this ratio monthly by property reveals which locations are stuck in reactive cycles and need intervention versus those successfully executing preventive programs.
Total maintenance spend divided by unit count per period (month or quarter). Industry ranges: residential $0.44-$0.62 per square foot; Class A commercial $0.48-$0.72 per square foot; properties over 25 years old average $0.65+. Budget variance tracks whether actual spending matches forecast—critical for capital planning credibility. Properties with 10%+ variance either have forecast issues (predictive models missing real costs) or operational issues (scope creep, waste, inefficient processes). Declining cost-per-unit while holding service levels constant indicates operational improvement; increasing costs might indicate aging asset base requiring more repairs or deteriorating maintenance discipline. Cost per unit should be tracked by property, building system, and asset type to identify where expenses concentrate and where efficiency improvements generate ROI.
Quarterly tenant satisfaction surveys measuring overall satisfaction and specific satisfaction with maintenance responsiveness. Research consistently identifies maintenance responsiveness as leading indicator of lease renewal intention: tenants satisfied with maintenance are 3.2x more likely to renew leases. Satisfaction measured 1-5 scale. Properties with 95%+ SLA compliance average 4.2/5 satisfaction. 75% SLA compliance averages 3.2/5. Interestingly, satisfaction correlates more strongly with response visibility (real-time status updates) than actual repair speed—tenants satisfied when they know status, even if repairs take 48 hours. Properties tracking satisfaction scores quarterly and correlating against SLA metrics identify whether satisfaction issues stem from slow repairs or poor communication. Linking satisfaction scores to lease renewal rates quantifies maintenance program ROI: every 0.5 point satisfaction improvement correlates with 5-10% lease renewal rate increase in many markets.
KPI Dashboard Design: Reporting Cadence & Performance Visibility
| KPI Category | Measurement Period | Review Frequency | Key Actions Triggered | OxMaint Reporting |
|---|---|---|---|---|
| MTTR & Response Time | Per-incident; monthly trend | Weekly team huddles | Staffing adjustments; parts inventory analysis; training | Daily dashboard; weekly summary; technician/system breakdown |
| First-Time Fix Rate | Monthly by technician, category | Monthly operations review | Training programs; parts inventory adjustment; diagnostic procedures | Monthly report; technician comparison; category trending |
| PM Compliance Rate | Monthly by asset, technician | Monthly management review | PM schedule prioritization; technician capacity analysis; schedule revision | Real-time compliance dashboard; monthly/quarterly trending |
| Maintenance Cost Per Unit | Quarterly per property, system | Quarterly strategic review | Capital planning; vendor performance evaluation; service model changes | Quarterly benchmarking report; property/system breakdown; budget variance |
| Tenant Satisfaction Score | Quarterly overall; tracking correlation | Quarterly leadership review | Maintenance program investment justification; communication improvements | Quarterly satisfaction survey; SLA correlation; trend analysis |
KPI Implementation Best Practices: Common Pitfalls & Success Strategy
Start With 6-8 Core KPIs Maximum: Avoid Analysis Paralysis
Resist the temptation to track everything the CMMS can measure. Select 2-3 metrics from efficiency category (MTTR, FTFR), 2-3 from reliability (PM compliance, MTBF), 1-2 from cost (maintenance cost per unit), 1-2 from satisfaction (tenant score, lease renewal rate). Start with focus set. Add metrics only when existing ones stabilize.
Establish Baseline Metrics Before Improvement Programs
Calculate current performance on all KPIs using 90 days of historical work order data. This baseline becomes reference point measuring improvement progress. Without baselines, property managers cannot determine whether metrics are improving or just better than last year. Baseline MTTR of 24 hours with improvement goal of 12 hours provides clear target. Vague "improve performance" goals generate no accountability.
Compare Against Industry Benchmarks, Not Just Internal History
A property reporting "MTTR improved from 22 hours to 18 hours" without benchmark context appears successful—until compared to industry benchmark of 8-16 hours for routine work. External benchmarks reveal whether "improvement" is meaningful or still bottom-quartile. OxMaint surfaces live benchmark comparisons automatically—showing exactly how property ranks against peers.
Use KPIs to Drive Daily Decisions, Not Just Reporting
KPIs should be decision tools, not vanity metrics. When FTFR drops to 75%, that triggers technician training programs or parts inventory analysis. When PM compliance misses 75%, resources shift to protecting scheduled work. When cost-per-unit spikes 15%, root cause investigation begins. If KPI movement does not trigger operational decisions, the metrics are not operational—they're decorative reporting.
Link Maintenance KPI Improvements to Tenant Satisfaction & Renewal Rates
The reason maintenance KPIs matter is they drive business outcomes: tenant satisfaction, lease renewal, NOI improvement. Property managers presenting KPI improvements should quantify: "Improving MTTR from 24 hours to 12 hours and PM compliance from 75% to 90% drove tenant satisfaction from 3.1/5 to 4.0/5, increasing lease renewal rate by 8 percent." This connects KPI mechanics to financial outcomes leadership understands.
Review KPI Trends Quarterly; Adjust Targets Based on Performance Patterns
Monthly KPI reviews enable operational adjustments. Quarterly deep dives enable strategic reassessment. If MTTR target of 8 hours for routine work proves unrealistic given staffing levels, reset to 10 hours—but document why adjustment made. Targets should be challenging but achievable. Perpetually missed targets create demoralization; easily met targets provide no improvement incentive. Schedule a demo to see KPI dashboard configuration and benchmarking for your property portfolio.
Frequently Asked Questions: Property Maintenance KPI Design
How much does improving MTTR from 24 hours to 8 hours impact tenant satisfaction?
Significant. Properties with MTTR under 4 hours for emergency work and 8-10 hours for routine work achieve 4.1/5 tenant satisfaction. Slower response typically correlates 2.8-3.2/5 satisfaction. Improvement compounds through reduced complaints and higher lease renewals.
What first-time fix rate should property managers target?
Top-quartile is 88%+. Best practice target 85%+. Below 72% indicates technician skill, parts inventory, or diagnostic procedure problems requiring intervention. Improvement from 70% to 85% reduces labor costs 15-20%.
How does PM compliance above 90% impact failure frequency?
Sustained 90%+ PM compliance is precondition for reliability improvement. Below 75% compliance over two consecutive quarters usually explains higher failure frequency. PM compliance directly drives down emergency repairs—highest ROI metric.
What is typical maintenance cost per square foot for different building types?
Residential $0.44-$0.62/sq ft; Class A commercial $0.48-$0.72; buildings over 25 years old $0.65+. Properties above range should investigate whether costs reflect aging asset base, maintenance discipline, or operational inefficiency.
How strongly does emergency work ratio impact overall maintenance costs?
Direct impact: emergency repairs cost 3-5x more per event than planned work. Every 10% shift from reactive to planned reduces maintenance costs 8-12%. Industry average 55-70% reactive; world-class 20% reactive/80% planned.
Should property managers track KPIs by individual technician or by property?
Both. Property-level metrics show portfolio performance. Technician-level metrics identify training needs and quality differences. Category-level metrics reveal system-specific problems. All three provide different actionable insights.
How quickly should property managers expect KPI improvements after implementing changes?
Operational KPIs (MTTR, FTFR, work order completion) show improvement within 60-90 days. Strategic KPIs (MTBF, maintenance cost) require 6-12 months of consistent execution to show statistically meaningful trends.
Can OxMaint calculate KPIs automatically or do property managers need to extract data?
Fully automatic. OxMaint timestamps all work order events (creation, assignment, dispatch, start, completion), automatically calculates MTTR, tracks PM compliance, categorizes work as emergency/urgent/routine, and generates weekly dashboards without manual data extraction.
Replace Maintenance Guesswork With Data-Driven KPI Performance Tracking
OxMaint tracks MTTR, first-time fix rates, PM compliance, cost per unit, and tenant satisfaction—comparing your property metrics against live industry benchmarks and surfacing exactly where maintenance improvements generate ROI.


.png)