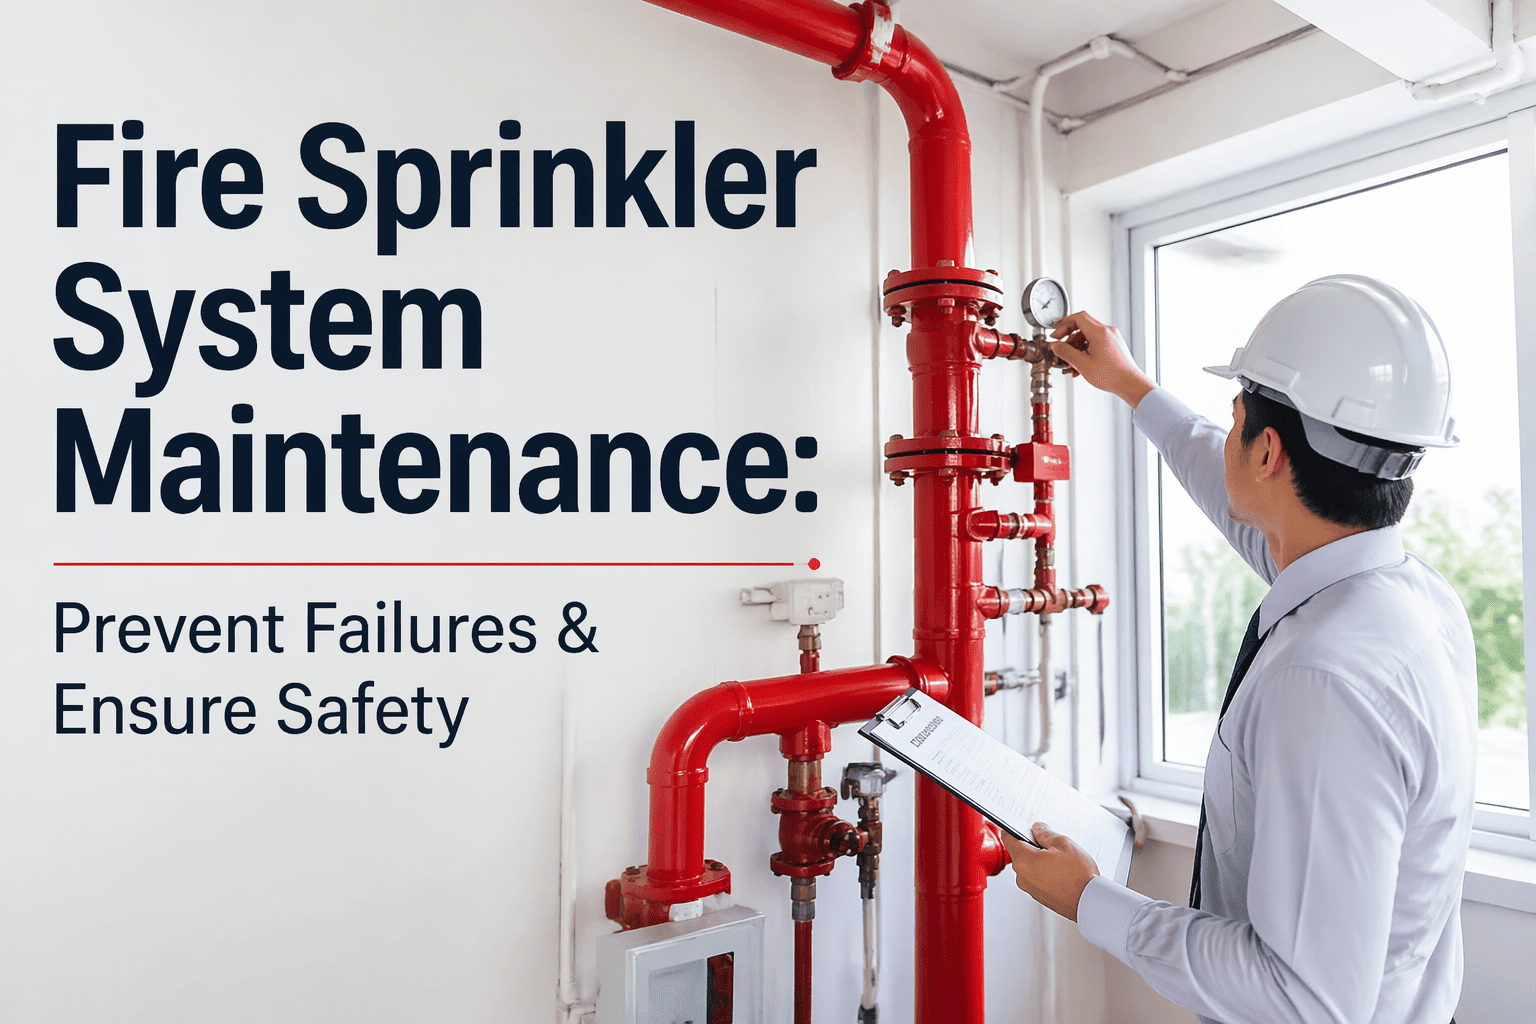
Emergency Maintenance Costs: The Silent Profit Killer in Property Portfolios
By allen on March 2, 2026
A 320-unit apartment complex in Phoenix ran its entire maintenance operation reactively for four years. When the central chiller failed mid-July, emergency replacement cost $187,000 — three times the $62,000 a planned replacement would have cost six months earlier. During the 11-day outage, 14 tenants broke leases, costing $252,000 in lost annual rent. The property manager had no condition data, no failure forecasts, and no documentation to justify the capital expense before it became an emergency. That single event erased 18 months of operating profit. Emergency maintenance is not a line item — it is a silent profit killer that compounds every quarter you ignore it.
3–5x
Emergency vs. Planned Maintenance Cost
25–30%
Higher Cost of Reactive vs. Preventive Programs
60–75%
Emergency Callouts Eliminated with Predictive Systems
$2–$5/sqft
Monthly Vacancy Cost from Failed Building Systems
Why Emergency Maintenance Costs 3–5x More Than Planned Repairs
Most property managers see the repair invoice and think that is the cost. It is not. The invoice is the tip of an iceberg that extends through after-hours labor premiums, expedited parts, tenant relocation, lease breaks, insurance hikes, and reputational damage that takes quarters to recover. Understanding the full cost anatomy is the first step to eliminating it.
The True Cost Anatomy of Emergency Maintenance
Planned vs. Emergency: What one repair event actually costs your portfolio
Planned Maintenance
✓
Labor Rate
Standard Rate — Scheduled During Business Hours
✓
Parts Procurement
Standard Shipping — 5 to 7 Business Days
✓
Tenant Disruption
Minimal — Scheduled Around Occupancy
✓
Budget Impact
Predictable — Approved in Advance
✓
Diagnostic Accuracy
Root Cause Identified — First-Time Fix Rate 85%+
VS
Emergency Maintenance
✗
Labor Rate
150 to 200% Premium — After-Hours and Weekends
✗
Parts Procurement
Expedited — 25 to 50% Markup on Rush Orders
✗
Tenant Disruption
Maximum — Lease Breaks, Room Changes, Complaints
✗
Budget Impact
Unpredictable — 40 to 60% Variance Year Over Year
✗
Diagnostic Accuracy
Rushed — Symptoms Treated, Root Cause Missed
Emergency repairs cost 3 to 5x more than planned maintenanceEvery dollar spent reactively is $3 to $5 that could have been $1 proactively
The Six Hidden Cost Drivers Behind Every Emergency Event
The repair invoice is only the visible cost. Behind every emergency event, six hidden cost drivers compound silently — from after-hours labor premiums to long-term asset depreciation. Property teams that only track repair invoices are seeing less than 40% of what emergencies actually cost their portfolio.
Six Hidden Cost Multipliers in Emergency Maintenance
After-Hours Labor Premiums
150–200%
Emergency calls at nights and weekends carry labor rates 1.5 to 2x the standard rate — the single largest cost multiplier in reactive operations
Expedited Parts Shipping
25–50%
Rush-order markups on replacement parts add 25 to 50% over standard procurement — parts that cost $800 on a Tuesday cost $1,200 on a Saturday
Tenant Lease Breaks
$18K–$42K
Each lease break from unresolved maintenance failures costs $18,000 to $42,000 in lost annual rent — plus turnover costs to re-lease the unit
Collateral Damage Cascade
3–8x
A burst pipe does not just need plumbing — it damages floors, walls, ceilings, and units below. One failure triggers multiple repair invoices
Insurance Premium Increases
8–14%
Repeat emergency claims increase portfolio insurance premiums by 8 to 14% at the next renewal — a cost that persists for years
NOI and Asset Valuation Loss
$8–$15
Every $1 of increased operating cost reduces asset value by $8 to $15 at typical cap rates — emergency costs directly destroy property valuation
The Emergency Cost Cascade: How One Failure Becomes Four Problems
Emergency maintenance does not stop at the repair invoice. Every unplanned failure triggers a four-stage cascade that multiplies cost across your entire operation — from the initial breakdown through tenant impact, budget disruption, and long-term asset depreciation. This is why reactive portfolios spend more every year while their asset values decline.
Four Stages of the Emergency Cost Cascade
01
System Failure
Equipment runs to failure with no condition monitoring
No early warning from maintenance data or sensor alerts
Failure occurs at worst time — nights, weekends, peak occupancy
Cost: 3–5x Repair Premium
02
Tenant Disruption
Comfort or safety compromised — HVAC, plumbing, elevator
Emergency relocation, service credits, and complaint handling
Negative reviews and referral damage within hours
Cost: $18K–$42K Per Lease Break
03
Budget Disruption
Emergency CapEx bypasses normal approval cycles
Reserves depleted by single event without recovery plan
Budget variance spikes 40 to 60% year over year
Cost: 40–60% Budget Variance
04
Asset Depreciation
Rushed repairs miss root cause — repeat failures in 90 days
Property NOI drops — directly reducing asset valuation
Cost: $8–$15 Per $1 NOI Lost
The Compounding Effect
Reactive portfolios do not just pay more per repair — they pay more every year. Each deferred maintenance cycle increases eventual cost by 12 to 18%. Each premature emergency replacement wastes 20 to 40% of remaining asset life. Poorly maintained assets require replacement 40% sooner, destroying capital planning and investor returns.
Stop the Cascade Before It Starts
Oxmaint transforms your maintenance operation from reactive firefighting into predictive prevention. Track asset conditions in real time, get failure alerts before breakdowns, and eliminate the emergency cost cascade that silently drains your portfolio profitability.
The Real Cost Comparison: Reactive vs. Preventive vs. Predictive
Property managers who track only repair invoices miss the full picture. When you factor in labor premiums, parts markups, tenant impact, and asset depreciation, the cost difference between maintenance strategies is not incremental — it is exponential. Here is what each dollar actually costs across the three approaches.
Cost Per Maintenance Dollar by Strategy
Including labor, parts, tenant impact, and asset depreciation — not just repair invoices
Reactive Emergency Repair
$100 (Baseline)
Scheduled Preventive
$35
Predictive Condition-Based
$20
Predictive maintenance reduces costs by up to 80% vs. reactive emergency responseThe industry standard target is an 80/20 preventive-to-reactive ratio
Which Systems Cause the Most Expensive Emergencies
Not all emergency failures are equal. Five building system categories account for over 85% of all emergency maintenance spending in commercial properties. Targeting these systems for predictive monitoring eliminates the majority of emergency costs without requiring portfolio-wide sensor deployment.
Emergency Failure Cost by Building System
Average emergency repair cost per event — including labor premiums, parts, and collateral damage
HVAC Systems
Compressor failures, refrigerant leaks, chiller breakdowns — 35 to 50% of all emergency spend
$15K–$187K
Plumbing and Water
Burst pipes, riser failures, backflow events — collateral water damage multiplies repair cost 3 to 8x
$8K–$120K
Elevators
Entrapment events, motor failures, control board replacements — emergency service at premium rates
Monitoring these five system categories alone eliminates 60 to 75% of all emergency callouts across a portfolio. Start here for fastest ROI.
How Predictive Systems Eliminate Emergency Costs
The shift from reactive to predictive maintenance does not require replacing your team or installing sensors on every asset. It requires giving your team visibility they never had — condition scoring, failure prediction, automated scheduling, and budget forecasting that turns existing maintenance data into an early warning system.
Four Capabilities That Prevent Emergencies Before They Happen
Asset Condition Scoring
Real-Time
Every asset scored 1 to 5 by age, repair history, and performance data — updated continuously from work order activity and mobile inspections
Failure Prediction
30–90 Days
AI identifies equipment trending toward failure and alerts your team 30 to 90 days before breakdown — enough time to plan, budget, and schedule
Automated Work Orders
Zero-Delay
Preventive tasks auto-generated, assigned to technicians, and tracked to completion — no manual coordination, no missed PM cycles
Budget Forecasting
85% Accurate
Condition-backed replacement schedules reduce budget variance from 40 to 60% down to under 12% — with data to justify every capital request
The Preventive Maintenance ROI
Properties implementing comprehensive preventive programs report consistent results: HVAC costs decline 35 to 50%, plumbing costs drop 40 to 60%, emergency callouts reduce by 60 to 75%, and tenant satisfaction increases 15 to 25%. Proactive maintenance correlates with 94% tenant retention vs. 76% for reactive operations.
The Financial Impact: What Predictive Maintenance Delivers
Every year spent in reactive mode costs more than the last. Every year spent in predictive mode saves more than the last. The numbers below represent documented results from property portfolios that made the shift — showing the full annual value delivered across all cost categories.
Annual Savings: Predictive Maintenance Deployment
20-property portfolio — 1,800 units — $2.4M annual maintenance budget
Emergency Repair Elimination
60 to 75% fewer emergency callouts — 6 prevented events at $95K avg reactive cost
$570,000
After-Hours Premium Savings
Shifting 80% of emergency work to scheduled hours eliminates overtime and weekend premiums
$144,000
Equipment Life Extension
Condition-based timing extends asset life 15 to 30% — deferring $1.6M in premature replacements
$320,000
Tenant Retention Value
Proactive maintenance prevents 4 lease losses from system failures at $36K avg annual rent
$144,000
Energy Efficiency Gains
Well-maintained HVAC and mechanical systems reduce energy consumption 10 to 20%
$96,000
Insurance Premium Reduction
Documented condition monitoring reduces property insurance premiums by 8 to 14%
$68,000
Total Annual Value Delivered
$1.34M
Platform investment: $18,000 to $36,000 per year. Net ROI: $1.30M to $1.32M. Return: 37 to 74x in the first year. Value compounds as condition data matures and replacement forecasts improve accuracy.
Implementation: From Reactive to Predictive in 6 Weeks
Deploying predictive maintenance does not require years of asset inventories or six-figure sensor deployments. Modern CMMS platforms import existing data, mobile inspections build condition scores progressively, and meaningful savings begin within the first 90 days.
Four-Phase Deployment Roadmap
01
Week 1–2: Import
Import asset registries from existing spreadsheets or CMMS
Configure properties, buildings, and asset categories
Load historical maintenance costs and repair records
Output: Asset Inventory Live
02
Week 3–4: Assess
Mobile condition inspections on critical assets first
Photo documentation linked to each asset record
AI generates initial condition scores from repair history
Output: Condition Baseline
03
Week 5: Automate
Preventive schedules auto-generated from condition data
Work orders assigned and tracked without manual input
Failure alerts configured for highest-risk assets
Output: PM Program Active
04
Week 6: Optimize
Budget forecasts generated with condition-backed data
Vendor performance scored and consolidated
Quarterly review cadence for continuous improvement
Output: Predictive Operations
Frequently Asked Questions
How much more does emergency maintenance actually cost compared to planned repairs?
Emergency repairs cost 3 to 5 times more than planned maintenance. The cost multiplier comes from after-hours labor premiums at 150 to 200% of standard rates, expedited parts shipping at 25 to 50% markups, rushed diagnostics that miss root causes leading to repeat failures, and collateral damage from cascading failures. A $5,000 planned HVAC repair becomes a $15,000 to $25,000 emergency when the system fails on a Friday night.
What percentage of our maintenance budget should be emergency versus planned?
Industry best practice targets an 80/20 preventive-to-reactive ratio. Most portfolios operating without a CMMS run at 60 to 70% reactive — meaning the majority of their budget goes to emergency work at premium rates. Shifting to 80% planned maintenance typically reduces total maintenance spend by 12 to 18% while improving tenant satisfaction by 15 to 25% and extending equipment life by 15 to 30%.
How quickly does predictive maintenance software pay for itself?
Most portfolios achieve positive ROI within 3 to 6 months — often from a single prevented emergency event. A single avoided HVAC failure or plumbing emergency typically saves $40,000 to $120,000 in reactive costs, covering 1 to 3 years of platform investment. First-year total value from optimized timing, emergency reduction, and tenant retention typically ranges from $800,000 to $1.3M for a 20-property portfolio.
What is the difference between preventive and predictive maintenance?
Preventive maintenance follows fixed schedules — for example, servicing HVAC every 6 months regardless of condition. Predictive maintenance uses real-time condition data, repair history analysis, and AI algorithms to determine exactly when service is needed. Predictive reduces costs up to 50% further than preventive by eliminating unnecessary maintenance on healthy equipment while catching failures that scheduled service would miss.
Can we start without a complete asset inventory or sensor deployment?
Yes — and most portfolios do. Start with the top 20% of assets by replacement cost and failure risk, typically HVAC systems, elevators, and plumbing risers. Build condition scoring progressively through mobile inspections. Most portfolios achieve 80% asset coverage within 90 days of deployment. No hardware or sensors are required to start — AI generates initial condition scores from your existing repair history and asset age data.
Does this integrate with our existing property management platform?
Yes. Oxmaint integrates with all major property management systems — Yardi, MRI Software, AppFolio, RealPage, Buildium, and Entrata. Asset data, maintenance costs, and tenant information flow automatically between systems. Integration setup takes 2 to 4 hours per platform and requires no custom development.
Every Emergency You Prevent Is Pure Profit Recovered
Oxmaint replaces reactive firefighting with predictive intelligence — condition scoring for every asset, automated preventive schedules, failure alerts 30 to 90 days before breakdown, and budget forecasting with 85% accuracy. Stop losing $3 to $5 for every $1 you could have spent proactively. Deploy in 6 weeks. ROI in 90 days. No credit card required.