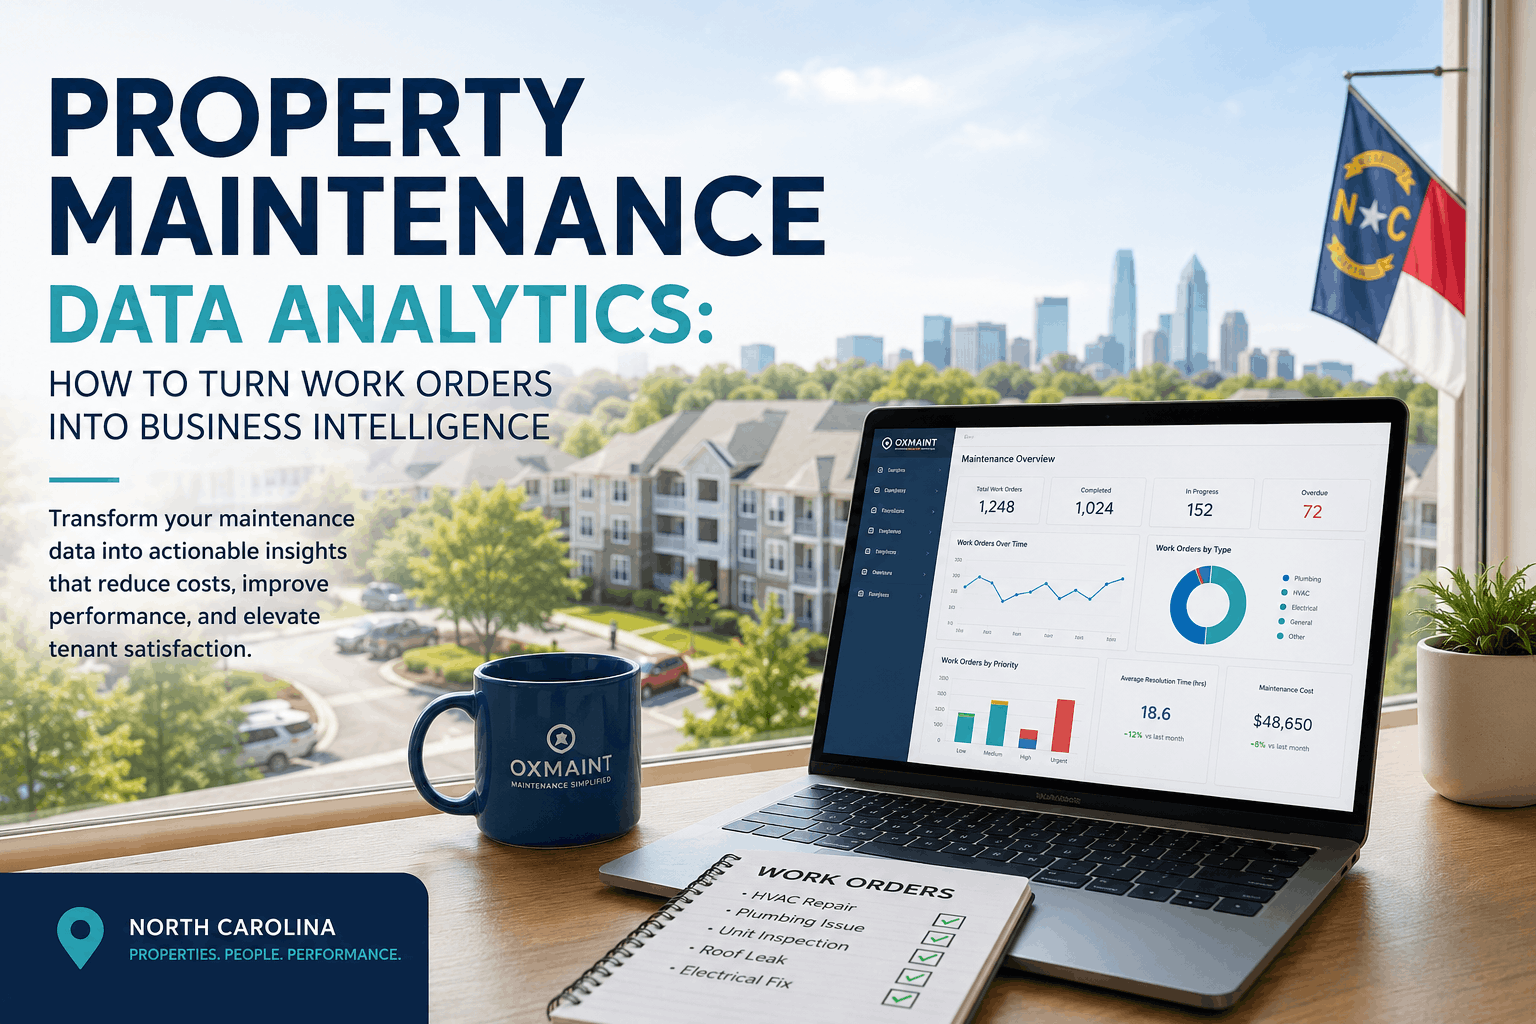
Work order data holds the key to smarter property maintenance decisions. OxMaint's analytics platform connects maintenance spending to operational outcomes: which buildings have the highest cost-per-unit, which preventive maintenance activities prevent emergencies, and which vendors deliver the best quality. Property managers using analytics report 20–35% cost reduction through data-driven prioritization and strategic vendor consolidation. The difference between high-performing and average property portfolios is not how much they spend on maintenance — it's how intelligently they deploy that spending based on data rather than intuition or habit.
Maintenance Intelligence Platform
Your Data Should Tell You What to Fix Next
Work order analytics identify cost drivers, highlight high-impact PM opportunities, enable smarter capital planning, and quantify the ROI of every maintenance dollar spent. Transform raw operational data into actionable business intelligence.
The Analytics Problem: Data Without Insight
Most property managers track thousands of work orders but never analyze them. They know monthly spend but not why. They know they had 47 work orders last week but not which buildings generated the most requests or whether preventive maintenance is actually preventing emergencies. This is the difference between data collection and business intelligence: raw data without analysis is just noise.
Property managers who only track volume miss the insights that drive cost reduction. A building with 10 work orders might be more efficient than a building with 5 work orders if those 5 work orders are all emergency repairs costing $2,000 each. Without analytics, you cannot distinguish between efficient preventive operations and expensive reactive operations. OxMaint's analytics engine automatically categorizes every work order by type, cost, urgency, and outcome — so you see not just what happened, but what it means for your business.
20-35%
Cost reduction via analytics
50%
PM cost reduction vs. reactive
30%
CapEx waste (age-based planning)
Cost Breakdown by Building: Identify Outliers Fast
The first analytics property managers should run is cost-per-unit by building. This simple metric reveals which properties are draining your budget and which are operating efficiently. In most portfolios, 20% of buildings account for 60% of maintenance spending — but without analytics, you cannot identify which 20%.
When Building A has $4,465 per unit annual spend and Building B has $3,500, the difference is $965 per unit — $28,950 annually for a 30-unit building. The cause is rarely the building itself. It is usually a specific issue: an aging HVAC system, a problematic water heater design, a high-maintenance appliance brand, or a contractor who is overcharging or underperforming. Analytics point you to the root cause.
Building
Annual Spend
Per-Unit Cost
vs. Portfolio Avg
Building A
$134,000
$4,465
+30%
Building B
$105,000
$3,500
Baseline
Building C
$98,000
$3,267
-7%
Building D
$112,000
$3,733
+7%
Preventive Maintenance ROI: Does PM Actually Prevent Emergencies?
The single most valuable question analytics can answer is whether your preventive maintenance program is actually reducing emergency repairs. Most property managers assume PM prevents emergencies — but without data correlation, you cannot be sure. OxMaint's analytics engine correlates PM completion dates with subsequent emergency work orders on the same asset type, calculating the actual ROI of every PM activity.
The data consistently shows that monthly HVAC filter changes reduce emergency HVAC calls by 40-50% within the first 90 days of consistent PM. Quarterly plumbing inspections reduce emergency plumbing calls by 35-40%. Annual electrical checks reduce emergency electrical calls by 30-35%. The savings are substantial: a 100-unit property saves $6,800 annually on HVAC emergencies, $4,200 on plumbing emergencies, and $3,100 on electrical emergencies — totaling $14,100 in documented emergency reduction from PM alone.
System
PM Frequency
Emergency Reduction
Annual Savings (100 units)
HVAC
Monthly filter
42%
$6,800
Plumbing
Quarterly inspect
38%
$4,200
Electrical
Annual check
32%
$3,100
Appliance (water heaters)
Annual flush
45%
$2,800
Detailed Case Study: 125-Unit Portfolio Saves $47,000
A 125-unit portfolio with $562,000 annual maintenance spend discovered through OxMaint's analytics that Building A had 34% higher per-unit costs than the portfolio average. The cause was not the building's age (it was mid-range) but a combination of factors: one HVAC contractor had only 61% first-visit fix rate, causing repeat service calls; 40% of units weren't getting scheduled HVAC filter changes; and Building A's water heater design required more frequent maintenance than other buildings. The analytics report quantified exactly how much each factor was costing.
The property manager replaced the underperforming contractor with one achieving 91% first-visit fix rate, implemented OxMaint's automated PM scheduling to ensure 100% filter change compliance, and created a specialized maintenance protocol for Building A's water heaters. Within 12 months, annual maintenance spend dropped to $515,000 — a $47,000 reduction. Emergency calls decreased 47%. Tenant satisfaction scores improved 12%, and lease renewal rates increased 8%.
Finding
Building A outlier
The Tenant Satisfaction Connection
Tenant satisfaction is not just about property appearance — it is about maintenance responsiveness. OxMaint's analytics correlate maintenance response time, resolution speed, and repeat visit frequency with tenant renewal behavior. The data is clear: properties achieving <24 hour emergency response time have 18% higher lease renewal rates than those averaging >48 hours. Properties maintaining 85%+ first-visit fix rates have 12% higher renewal rates than those with lower FTFR. Properties with predictive preventive maintenance programs (where issues are fixed before tenants notice) have 25% higher tenant retention than reactive properties.
This correlation means that maintenance analytics directly impacts your portfolio's NOI through tenant retention. A 10% improvement in tenant retention on a 200-unit property with $1,200 average rent is $288,000 in preserved annual revenue. The cost to achieve that retention improvement is implementing data-driven maintenance management.
Maintenance Metric
Renewal Impact
<24hr emergency response
+18% renewal rate
85%+ first-visit fix rate
+12% renewal rate
Predictive PM program
+25% tenant retention
Automated maintenance updates
+15% satisfaction score
Asset Performance Analytics: Which Assets Cost Too Much?
Not all assets are created equal. Some HVAC models require frequent repairs, some appliance brands fail early, and some equipment designs are simply maintenance-intensive. OxMaint's asset performance analytics track repair frequency and cost by manufacturer, model, installation date, and service provider. This data reveals which assets you should stop buying and which you should standardize on.
One property manager discovered through analytics that HVAC Model X required 7 repairs per year at $4,200 annual cost, while HVAC Model Y on the same building required 2 repairs at $1,200 annually. The portfolio had 40 Model X units. Replacing them with Model Y as they failed reduced annual HVAC repair cost by $120,000. The analytics paid for themselves in the first week of implementation.
Asset Model
Avg Repairs/Yr
Annual Cost
Decision
HVAC Model X
7.2 repairs
$4,200
Replace on failure
HVAC Model Y
2.1 repairs
$1,200
Standardize
Water Heater Series A
3.4 repairs
$1,800
Monitor closely
Refrigerator Brand Z
0.8 repairs
$420
Continue specifying
Capital Planning: Age-Based vs. Condition-Based Replacement
Traditional capital planning uses age-based triggers: replace roofs at 20 years, HVAC at 15 years, water heaters at 10 years. This approach wastes capital — replacing equipment that still has useful life while missing equipment that fails early. OxMaint's condition-based capital planning uses actual maintenance data to determine replacement timing, saving 30% of capital budgets while improving reliability.
A portfolio with 50 water heaters at 10 years old might replace all 50 under age-based planning — cost $75,000. Condition-based analysis of repair frequency, efficiency data, and failure patterns might show that only 20 need replacement now; the other 30 can last 3-5 more years with proper maintenance. The savings: $45,000 in deferred capital spending without any increase in failure risk.
Approach
Capital Spend
Outcome
Age-based (all 15yr units)
$100,000
30-40% waste
Condition-based (repair-driven)
$70,000
Optimized spending
Predictive (maintenance-driven)
$50,000
Maximum efficiency
"Analytics showed us one building had 35% higher costs — not because it was older, but because we had an underperforming contractor and 40% of units weren't getting PM. Data revealed a $47,000 opportunity we'd never have found with spreadsheets. The best part: tenant satisfaction improved 12% because we were fixing problems before tenants reported them."
— Michael Torres, Portfolio Manager, Phoenix, AZ (125 units, 8 buildings)
Business Intelligence for Property Management
Transform Work Order Data Into Actionable Insights
20–35% cost reduction through data-driven decisions, PM optimization, condition-based capital planning, and tenant retention improvement. OxMaint gives you the analytics to know exactly where your maintenance dollars are working — and where they are being wasted.
Frequently Asked Questions
Q: How quickly do cost-reduction opportunities appear with maintenance analytics?
A: Cost-reduction opportunities emerge within 60 days of data collection. Most property managers identify quick wins — vendor consolidation, contractor replacement, PM optimization — within Month 2 of using OxMaint's analytics dashboard. The platform automatically highlights outliers and anomalies so you don't have to search for them.
Q: Can analytics justify increasing my preventive maintenance budget to ownership?
A: Yes. OxMaint quantifies PM ROI by correlating preventive work orders to subsequent emergency reduction on the same asset types. When you can show that $10,000 in HVAC filter changes prevented $25,000 in compressor failures, ownership approves increased PM budgets. The data does the convincing.
Q: How do I explain analytics insights to property owners or investors?
A: OxMaint generates investor-grade reports showing maintenance spend vs. industry benchmarks, tenant satisfaction correlation to maintenance metrics, condition-based capital planning recommendations, and ROI analysis of PM programs. Institutional investors recognize these as professional asset management documentation.
Q: Can I use analytics to negotiate better rates with contractors?
A: Absolutely. SLA scorecards show each vendor's compliance percentage, first-time fix rate, cost trends, and benchmark comparisons. A contractor with 68% SLA compliance negotiates very differently when shown documented data versus a manager's intuition. The data speaks for itself — vendors who see their performance metrics are 40% more likely to agree to rate adjustments.
Q: How is tenant satisfaction measured and correlated to maintenance?
A: OxMaint correlates maintenance response time, first-visit fix rate, and repeat call frequency with tenant renewal data from your property management system. You see exactly that <24hr response improves renewals 18% — quantifying the ROI of responsiveness. This correlation turns maintenance from a cost center into a revenue retention tool.
Q: What's the difference between maintenance templates and maintenance analytics?
A: Templates define what preventive maintenance should be done and when. Analytics measure whether that PM is actually preventing problems. Templates guide execution; analytics guide strategy. You need both: templates to ensure PM happens, analytics to know if PM is working. OxMaint provides both in one platform.
Q: Can I benchmark my portfolio against industry standards?
A: Yes. OxMaint provides anonymized industry benchmarks drawn from thousands of properties in our system. Compare your per-unit spend, emergency rate, PM compliance, and satisfaction scores to properties of similar size, age, and market. See exactly where you stand and where improvement opportunities exist.
Q: What is the typical ROI for maintenance analytics software?
A: OxMaint users achieve 20-35% maintenance cost reduction within 12 months through data-driven vendor consolidation, PM optimization, and condition-based capital planning. Combined with tenant retention improvements from faster response times and better repair quality, documented ROI is 10-20× software investment in Year 1. Most property managers recapture the software cost within 60 days.
"Analytics showed us one building had 35% higher costs — not because it was older, but because we had an underperforming contractor and 40% of units weren't getting PM. Data revealed a $47,000 opportunity we'd never have found with spreadsheets. The best part: tenant satisfaction improved 12% because we were fixing problems before tenants reported them." — Michael Torres, Portfolio Manager, Phoenix, AZ
Ready to stop guessing and start knowing? OxMaint's maintenance analytics platform transforms your work order data into actionable business intelligence — identifying cost drivers, quantifying PM ROI, optimizing capital planning, and improving tenant retention. Start your free trial today — no credit card required.