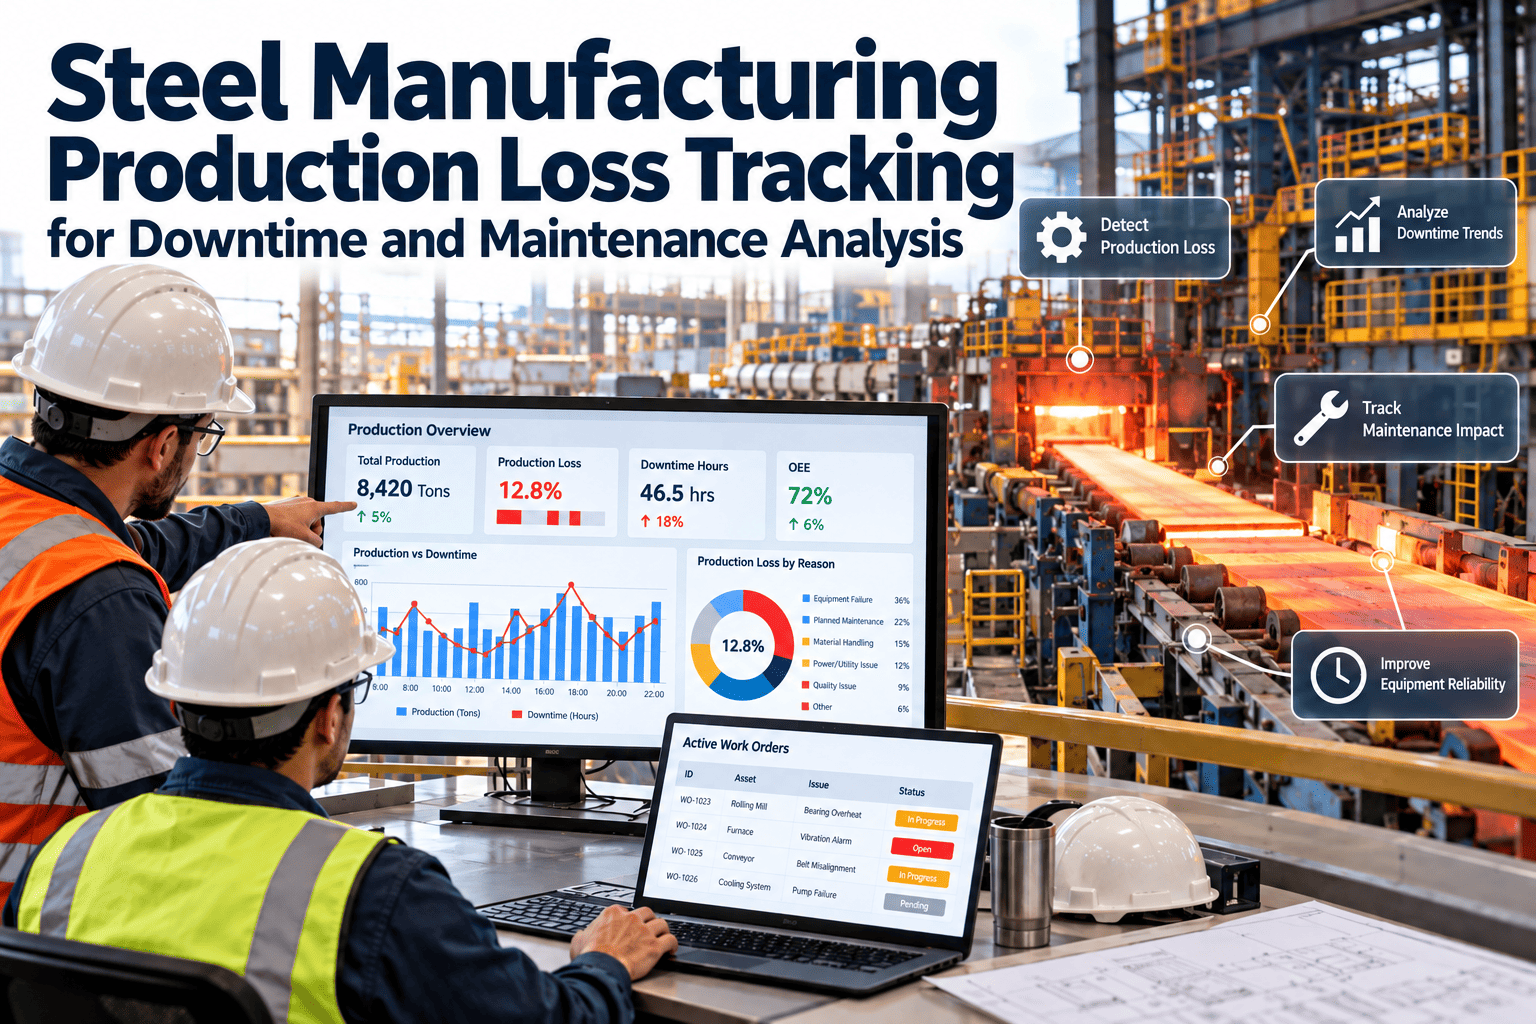
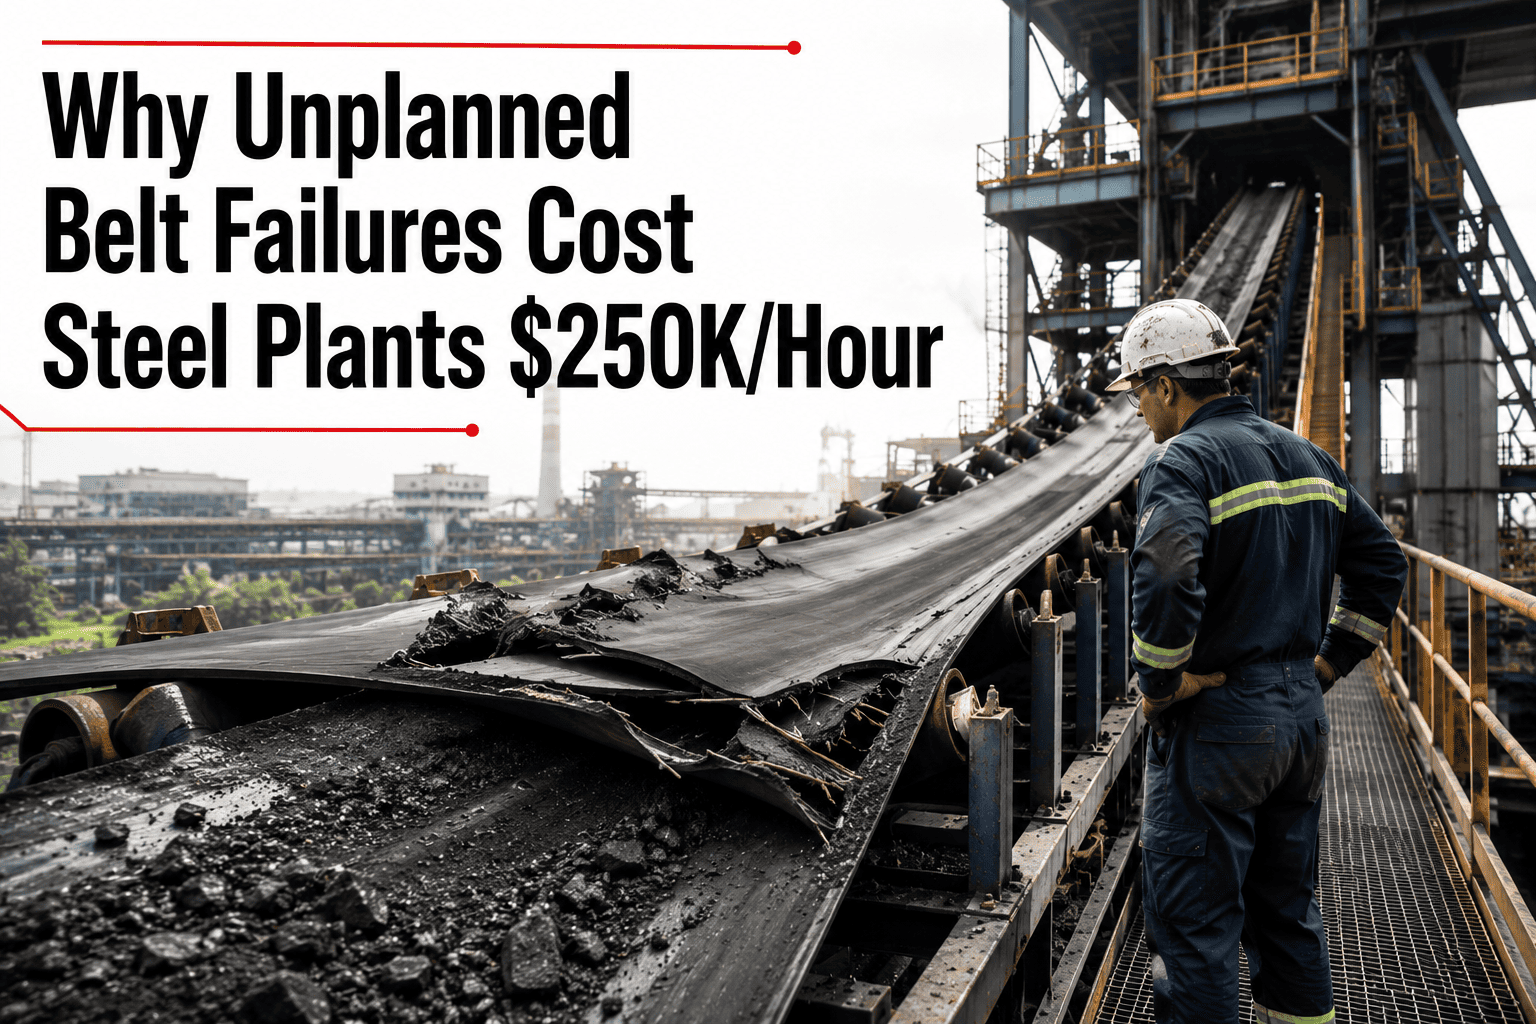
The blast furnace tapped on schedule at 2:20 AM. The hot metal was ready. The BOF was waiting. But Torpedo Car #3—the only car available on rotation—wouldn't move. Its traction motor had been drawing 18% above rated current for eleven days. Three different operators had noted it in the shift logbook. Nobody created a work order. Nobody flagged it for the next maintenance window. At 2:47 AM, the motor tripped on thermal overload. The hot metal sat in the torpedo car cooling for 53 minutes while maintenance scrambled to reroute Torpedo Car #7 from the repair bay—a car that had been pulled from service two days earlier for a hydraulic leak that also hadn't been repaired. The blast furnace held its next tap. The BOF schedule collapsed. The caster lost sequence. By the time the production chain recovered, eight hours of cascading delays had consumed $463,000 in lost output, emergency labor, and two scrapped heats of steel that cooled past the processing window. The motor bearing that started it all cost $1,900. The logbook where the warnings were recorded cost $4.50.
$4.6M
Annual Bottleneck Cost
Average annual production loss at integrated steel plants directly attributed to logistics bottlenecks caused by equipment maintenance failures—not process upsets, raw material shortages, or market conditions
Of logistics bottleneck events in steel plants are directly traceable to deferred, missed, or undocumented preventive maintenance on transfer and material handling equipment
Average cost multiplier when a single logistics equipment failure cascades into a plant-wide bottleneck—a $5,000 repair becomes a $36,500 production loss event due to upstream holds and downstream starvation
The Pattern Nobody Tracks Until It's Too Late
Steel plant production managers instinctively monitor furnace availability, caster uptime, and rolling mill performance. But the logistics equipment connecting these stages—torpedo cars, ladle transfer vehicles, overhead cranes, roller tables, slab yard transporters—rarely appears on the daily production dashboard. When a bottleneck forms, the root cause investigation focuses on the process stage that stopped. It almost never traces back to the maintenance failure three stages upstream that started the chain reaction. Without integrated equipment health data flowing into production planning, bottlenecks appear random. They're not. They're the predictable result of invisible maintenance gaps.
Logistics bottlenecks in steel plants don't happen because of bad scheduling or insufficient equipment. They happen because maintenance failures remove critical assets from the transfer chain at exactly the wrong moment—when production depends on them most. A torpedo car that won't tilt. A ladle crane with a faulty hoist brake. A roller table section with a seized bearing. A slab yard transporter with a dead hydraulic pump. Each failure, in isolation, is a routine maintenance event. In the context of a running production sequence, each one becomes a plant-wide crisis. The difference between plants that suffer chronic bottlenecks and those that don't isn't equipment age or capital budget—it's whether maintenance data flows into logistics planning before the failure happens. Plants that connect their maintenance systems to production planning digitally stop treating bottlenecks as scheduling problems and start preventing them as maintenance problems.
The Anatomy of a Maintenance-Driven Logistics Bottleneck
Understanding how a single maintenance failure becomes a plant-wide bottleneck requires mapping the steel production chain as a logistics network—not a series of independent process stages. Every ton of steel moves through 8-12 transfer points between raw material and finished product. Each transfer depends on specific equipment being available, functional, and positioned correctly at the exact moment the upstream process delivers material. When one link breaks, there is no buffer. Steel production is a continuous flow process where every minute of delay at one transfer point compounds through every downstream stage.
Every Ton Passes Through 8-12 Equipment-Dependent Transfer Points
From blast furnace tap to finished coil shipment, each ton of steel depends on torpedo cars, ladle cranes, transfer cars, roller tables, slab transporters, and finishing line equipment. A failure at any single point doesn't just stop one operation—it creates upstream pressure (material backing up) and downstream starvation (equipment sitting idle) simultaneously. The resulting bottleneck costs 7.3x more than the original equipment failure.
53 min
Average time to resolve a logistics equipment failure—during which 3-5 upstream and downstream stages are affected
$36.5K
Average total cascade cost per logistics bottleneck event when upstream holds and downstream starvation are included
3.4
Average number of departments affected per logistics bottleneck event caused by transfer equipment failure
127
average logistics bottleneck events per year at plants without digital maintenance tracking
41
average bottleneck events per year at plants with predictive maintenance on transfer equipment
68%
reduction in cascade events when maintenance data feeds production scheduling systems
The Five Ways Poor Maintenance Creates Logistics Bottlenecks
Logistics bottlenecks caused by maintenance failures don't just appear as sudden breakdowns. They develop through five distinct mechanisms—each one preventable with systematic maintenance tracking and condition monitoring. Understanding these mechanisms is the first step toward eliminating the chronic bottlenecks that silently consume millions in production capacity every year. The plants that prevent bottlenecks aren't spending more on maintenance—they're spending it more intelligently, on the equipment that controls material flow between process stages. When operations teams can see how digital maintenance prevents logistics bottlenecks, the ROI becomes immediately obvious.
| Bottleneck Mechanism |
How It Develops |
Equipment Typically Involved |
Average Production Impact |
| 1. Sudden Asset Unavailability |
Critical transfer equipment fails without warning because degradation symptoms were not tracked. No backup asset is positioned. Production holds propagate in both directions. |
Torpedo cars, ladle cranes, slab yard transporters, transfer cars |
$120K-$350K per event; 4-12 hours of cascading delays |
| 2. Degraded Performance Throughput Loss |
Equipment operates but at reduced speed or capacity due to unmaintained components. Transfer cycle times increase 15-40%, creating invisible throughput bottlenecks that compound over shifts. |
Roller tables, conveyors, overhead cranes with worn brakes, ladle cars with sluggish hydraulics |
$2,000-$8,000/day in hidden capacity loss; often undetected for weeks |
| 3. Unplanned Maintenance Timing Conflicts |
Equipment pulled from service for emergency repairs during peak production windows because preventive maintenance was deferred. Two or more critical assets in same transfer route offline simultaneously. |
Any logistics equipment without PM scheduling linked to production calendar |
$50K-$200K per conflict; eliminates scheduling flexibility for days |
| 4. Quality-Driven Rerouting Bottlenecks |
Poorly maintained equipment creates product quality issues that force material rerouting, reprocessing, or quality holds—consuming transfer equipment capacity that was allocated to primary production. |
Coating line rolls, finishing equipment, temperature control systems, tension devices |
$30K-$150K per event in rework, downgrade, and diverted logistics capacity |
| 5. Spare Equipment Fleet Depletion |
Backup/spare transfer assets accumulate deferred maintenance until none are available when a primary asset fails. The "safety net" has quietly been consumed by neglect. |
Spare torpedo cars, backup ladle cars, reserve crane hoists, standby transporters |
Transforms a 1-hour repair into a 6-12 hour crisis; $200K-$500K per event |
Swipe to see full table
Plants experiencing more than 10 logistics bottleneck events per month should audit their transfer equipment PM completion rates—bottleneck frequency correlates directly with PM schedule adherence below 85%
How Many Bottlenecks Did Your Plant Experience Last Month?
If you can't answer that question with data—including root cause, equipment involved, and total cascade cost—your logistics bottlenecks are invisible. See how steel plants are making bottleneck patterns visible and preventable.
Root Cause Analysis: The Maintenance Gaps That Feed Bottlenecks
When logistics bottleneck events are analyzed individually, each one looks like an isolated equipment failure. When analyzed as a population across months or years, clear patterns emerge—the same categories of maintenance gaps creating the same categories of bottlenecks repeatedly. These aren't random equipment failures. They're systematic maintenance system failures that produce predictable logistics disruptions. Digital maintenance tracking eliminates every one of these root causes.
01
No Condition Trend Tracking
28%
Equipment degradation symptoms—rising vibration, increasing motor current, falling hydraulic pressure, growing cycle times—are observed by operators but never recorded in a system that can identify trends. Each observation exists in isolation. No one connects this week's "slightly sluggish" to last month's "a little slow" to the breakdown three weeks from now.
Solution: Digital condition monitoring with trend alerts. When vibration on Torpedo Car #3's drive motor increases 10% over baseline across three consecutive readings, the system flags it automatically—not when it trips on overload at 2 AM.
02
PM Schedules Not Linked to Production
23%
Preventive maintenance is scheduled on calendar time—every 30 days, every quarter—regardless of production intensity or equipment utilization. High-utilization assets get the same PM frequency as low-utilization ones. Critical maintenance windows conflict with peak production. PMs get deferred "until next week" indefinitely.
Solution: Usage-based PM scheduling tied to operating hours, heat cycles, or meters processed. Maintenance windows automatically identified during planned production gaps. PM completion tracked with escalation alerts when deadlines approach.
03
Shift-to-Shift Information Loss
19%
Critical equipment observations made by the night shift never reach the day shift maintenance planner. Paper logbooks sit in control rooms. Verbal shift handovers compress 8 hours of observations into 2 minutes. Equipment symptoms observed by operators are lost in the gap between operations and maintenance communication.
Solution: Digital shift handover with mandatory equipment status fields. Any operator observation automatically generates a maintenance notification visible to planners across all shifts. No information dies at shift change.
04
Spare Fleet Maintenance Neglect
14%
Backup transfer assets—spare torpedo cars, reserve ladle cars, standby cranes—are maintained on a lower priority than active equipment. When a primary asset fails, the spare is called into service and discovered to be non-functional. The safety net has been quietly degrading in a corner of the maintenance bay for months.
Solution: Spare equipment included in active PM schedules with "ready-to-deploy" verification intervals. Standby asset health status visible on production dashboards. Spare fleet availability treated as a tracked KPI.
05
No Equipment-to-Bottleneck Correlation
11%
Production delay reports record the symptom ("caster lost sequence") but not the logistics root cause ("ladle arrived 7 minutes late because transfer car hydraulic response time degraded 40% over 3 weeks"). Without linking production delays to specific equipment condition data, the same bottleneck patterns repeat indefinitely.
Solution: Integrated delay tracking that links every production bottleneck to the specific equipment involved, its maintenance history, and its condition trend data. Pattern analysis identifies chronic bottleneck sources for targeted PM investment.
06
Deferred Maintenance Accumulation
5%
Individual PM deferrals appear low-risk. But deferred tasks accumulate across the transfer fleet, creating a "maintenance debt" that eventually manifests as multiple simultaneous equipment restrictions. When three torpedo cars need attention simultaneously, the fleet can't cover production demand—and there's no warning before the crisis.
Solution: Maintenance backlog visibility with fleet-level health dashboards. Deferred PM tracking with automatic risk scoring. Alerts when fleet-wide maintenance debt exceeds thresholds that threaten logistics capacity.
The Real Numbers: Plants With Digital Maintenance vs. Plants Without
The difference between steel plants that suffer chronic logistics bottlenecks and those that don't isn't visible in their equipment lists—it's visible in their maintenance systems. Plants using paper-based or disconnected maintenance tracking experience 3x more bottleneck events, 5x longer resolution times, and 7x higher cascade costs than plants with integrated digital maintenance systems. The gap isn't theoretical. It shows up in tonnage produced, cost per ton, and delivery reliability—the metrics that determine which plants get the next contract and which ones lose it. Plants ready to close this gap can create a free account and start building visibility immediately.
Paper-Based Maintenance
bottleneck events annually
Avg. resolution time:
4.2 hours
Cascade cost per event:
$36,500
Root cause identified:
23% of events
Digital CMMS
bottleneck events annually
Avg. resolution time:
1.1 hours
Cascade cost per event:
$12,200
Root cause identified:
94% of events
68%
fewer logistics bottleneck events per year
74%
faster bottleneck resolution when events do occur
$3.1M
average annual savings from bottleneck reduction alone
Expert Perspective: Why the Best Plants Treat Maintenance as Logistics Infrastructure
"The plants I see hitting 95%+ on-time delivery and lowest cost-per-ton in their peer group all share one characteristic: they've stopped treating maintenance and production as separate functions. Their maintenance data feeds into production scheduling. When a torpedo car's condition trend suggests it needs attention in the next 72 hours, the production planner knows before the maintenance planner files the work order. The bottleneck is prevented—not resolved. That's the difference between a plant that reacts to crises and one that prevents them. And it's entirely a data and systems problem, not an equipment problem."
— Steel Plant Operations Excellence & Throughput Consultant
Fleet Health Dashboards
Real-time visibility into the condition and availability of every transfer asset in the plant. Production planners see which torpedo cars, ladle vehicles, and cranes are green (fully operational), yellow (approaching PM due), or red (restricted)—before they build the next shift's production schedule.
Predictive Bottleneck Alerts
When condition monitoring data suggests a critical transfer asset is trending toward failure, the system alerts both maintenance and production planning simultaneously. The maintenance window gets scheduled before the bottleneck forms—not after production has already stopped.
Bottleneck Root Cause Database
Every logistics delay event is logged with the specific equipment involved, its maintenance history, the cascade impact, and the root cause. Over months, patterns emerge that guide PM investment to the exact equipment that generates the most bottleneck risk per dollar of deferred maintenance.
The most expensive maintenance in any steel plant isn't the work you do—it's the work you defer. Every deferred PM on a transfer asset is a bet that the equipment will hold until the next window. In a continuous production environment where a single stalled torpedo car can cascade into a $463,000 plant-wide bottleneck, that bet carries asymmetric risk. The repair costs $1,900. The bottleneck costs $36,500. The annual accumulation of bottlenecks from deferred maintenance costs $4.6M. Plants that schedule a walkthrough of integrated maintenance and production planning stop accepting logistics bottlenecks as inevitable and start treating them as the preventable maintenance failures they actually are.
The Question Every Plant Manager Should Ask Tomorrow Morning
Walk into your production meeting and ask: "How many logistics bottleneck events did we have last week, what equipment caused each one, and what was the maintenance history on that equipment?" If the room goes quiet—if the answers require days of investigation rather than seconds of dashboard review—your bottlenecks are invisible. And invisible bottlenecks don't get prevented. They get repeated. The plants that eliminate chronic logistics bottlenecks made one decision: they connected their maintenance data to their production reality. That decision didn't require new equipment. It required new visibility into the equipment they already had.
Stop Reacting to Bottlenecks. Start Preventing Them.
Oxmaint gives steel plants the maintenance-to-production visibility that eliminates chronic logistics bottlenecks—fleet health dashboards, predictive condition alerts, shift-to-shift handover accountability, spare fleet readiness tracking, and bottleneck root cause analytics that turn reactive crisis management into proactive throughput protection.
Frequently Asked Questions
What percentage of steel plant logistics bottlenecks are caused by maintenance issues?
Analysis across integrated steel plants consistently shows that 61% of logistics bottleneck events trace directly to deferred, missed, or undocumented preventive maintenance on transfer and material handling equipment. The remaining 39% includes scheduling conflicts, raw material supply issues, and process upsets. However, even among "non-maintenance" bottlenecks, a significant portion involve equipment operating in a degraded state due to incomplete maintenance—meaning the true maintenance contribution to logistics disruptions likely exceeds 70% when degraded-performance bottlenecks are included.
How does a single equipment failure cascade into a plant-wide bottleneck?
Steel production is a continuous flow process with zero buffer between most transfer stages. When a torpedo car stalls between the blast furnace and BOF, it creates simultaneous upstream and downstream effects. Upstream: the blast furnace must hold its next tap or divert to another car (if available), disrupting the tapping schedule. Downstream: the BOF waits for hot metal, pushing back its blowing schedule, which delays ladle delivery to the caster, which causes a sequence break—one of the most expensive events in steel production. A single 53-minute equipment failure can produce 8+ hours of cascading delays affecting 3-5 departments. The average cascade multiplier is 7.3x, meaning a $5,000 repair event generates $36,500 in total production losses.
How much do logistics bottlenecks actually cost a steel plant annually?
Integrated steel plants without digital maintenance tracking on transfer equipment experience an average of 127 logistics bottleneck events per year, with an average cascade cost of $36,500 per event—totaling approximately $4.6M annually in direct production losses. This figure includes lost output, emergency repair premiums, scrapped material, overtime labor, and downstream schedule disruption. It does not include indirect costs like customer delivery penalties, expedited shipping, or contract loss from reliability reputation damage. Plants that implement integrated digital maintenance-to-production systems reduce bottleneck frequency to approximately 41 events per year at $12,200 average cascade cost, saving $3.1M annually.
What's the fastest way to reduce logistics bottlenecks in a steel plant?
The highest-impact first step is establishing digital condition tracking on the 15-20 transfer assets that sit on critical production paths—the torpedo cars, ladle transfer vehicles, primary overhead cranes, and key roller table sections that have no backup route. Implementing weekly digital condition checks with trend alerting on these assets alone typically reduces bottleneck events by 35-45% within 90 days. The second step is connecting maintenance scheduling to the production calendar so PMs are completed during planned production gaps rather than deferred indefinitely. The third step is integrating delay event tracking with equipment maintenance history to identify chronic bottleneck sources. Plants that complete all three steps within 6-12 months typically achieve the full 68% bottleneck reduction.
Why do spare and backup transfer assets fail when they're needed most?
Spare and backup transfer equipment—reserve torpedo cars, standby ladle cars, backup crane hoists—are typically maintained at lower priority than active production assets. When PM resources are constrained, spare equipment maintenance is the first to be deferred. Over weeks and months, the spare fleet quietly degrades. Batteries discharge, hydraulic seals dry and crack, brake systems corrode, and drive components develop faults from inactivity. When a primary asset fails and the spare is called into service, it's discovered to be non-functional—transforming what should have been a 1-hour swap into a 6-12 hour crisis. The solution is including spare assets in active PM schedules with "ready-to-deploy" verification at defined intervals and tracking spare fleet availability as a production-critical KPI on the daily management dashboard.
How does CMMS prevent logistics bottlenecks specifically?
Digital CMMS prevents logistics bottlenecks through five specific mechanisms. First, condition trend tracking with automated alerts identifies failing equipment 2-6 weeks before breakdown. Second, usage-based PM scheduling ensures high-utilization transfer assets receive more frequent maintenance than calendar-based schedules would provide. Third, digital shift handover eliminates the information loss between shifts that allows equipment symptoms to go unreported for days. Fourth, fleet health dashboards give production planners real-time visibility into which transfer assets are fully operational, approaching maintenance due, or restricted—enabling proactive schedule adjustment. Fifth, bottleneck root cause logging builds a database that identifies chronic problem assets and guides targeted PM investment. Together, these capabilities reduce bottleneck events by 68% and resolution time by 74% on average.