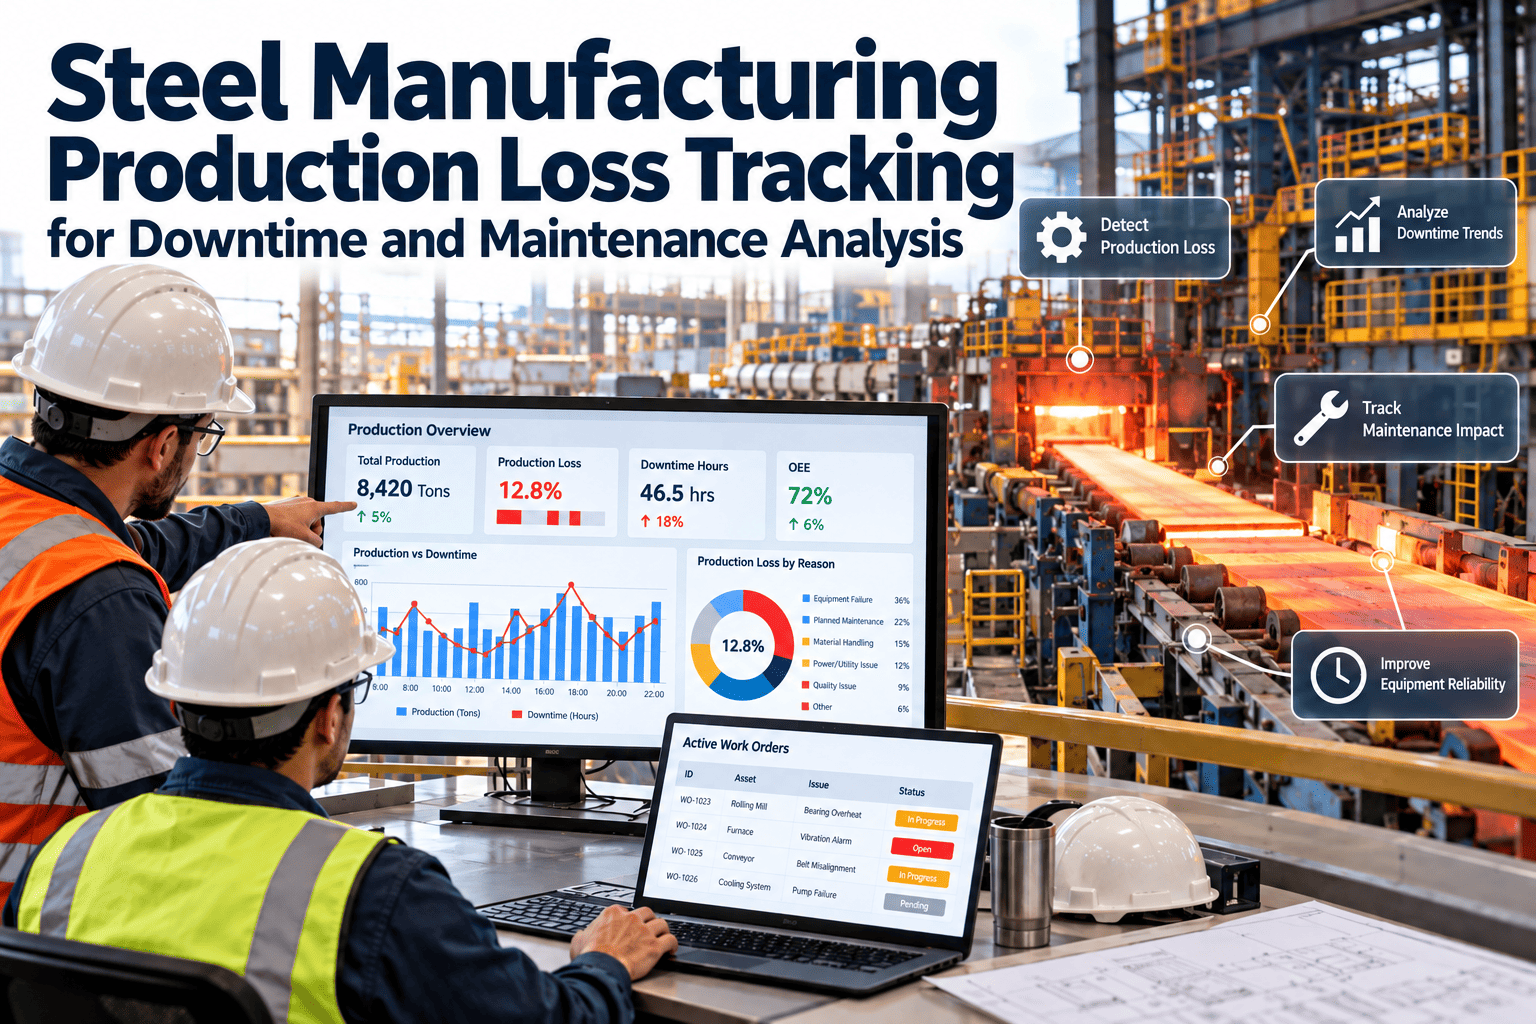
Ask a maintenance manager how much production a rolling mill lost to unplanned downtime last month, and you will usually get two different numbers from two different people. The shift log says one duration, the ERP says another tonnage, and nobody can say which failure mode actually cost the most. That gap is not a discipline problem — it is a structural one, because most steel plants have no single ledger that ties a stoppage to an asset, a line, a shift, a failure mode, and the tonnes it cost. Closing that gap starts with treating every stoppage as a structured record instead of a note in a logbook, and a system like Oxmaint built to hold that record is where the fix begins.
Production Loss Tracking for Downtime and Maintenance Analysis in Steel Plants
Every unplanned stop in a steel plant carries five facts that matter: which asset failed, which line it stopped, which shift was running, what failure mode caused it, and how many tonnes were lost while it was down. Most plants capture one or two of these and lose the rest. Oxmaint structures every stoppage into a single loss record — asset, line, shift, failure mode, downtime duration, and tonnes affected — so the data survives long enough to be analyzed.
Why Loss Data Falls Apart Between the Floor and the Report
A stoppage on a continuous caster or a hot strip mill generates data in three different places at once: the operator's handwritten shift log, the PLC or SCADA historian, and whatever the maintenance technician remembers to write on the work order afterward. None of these three sources were built to talk to each other.
The Five Fields a Loss Record Actually Needs
A production loss ledger only works if every stoppage is captured against the same structure, every time, regardless of which shift or which technician logs it. Reliability engineers analyzing steel plant downtime consistently come back to the same five dimensions.
A Loss Record Is Only Useful If It Is Captured the Same Way Every Time
Oxmaint turns every stoppage into a structured work order with asset, line, shift, failure mode, duration, and tonnes affected filled in as fields — not written into a free-text note that gets summarized away.
From Downtime Minutes to Tonnes: How the Conversion Actually Works
Minutes of downtime and tonnes of lost production are not interchangeable — a thirty-minute stop on a slow-running line costs far less than thirty minutes on a caster running near capacity. Loss tracking has to convert duration into tonnage using the specific line's rated throughput at the time of the stop.
This is also where restart losses hide. A caster that stops for forty minutes rarely returns to full speed on restart — it ramps up over the next hour, and that ramp-up period produces at reduced throughput or off-spec material. A loss ledger that only counts the stop-to-restart window and ignores the ramp-up understates every event by a meaningful margin. Book a demo to see how ramp-up loss is captured alongside the primary stop.
Building the Failure Mode Pareto
Once every stoppage carries a structured failure mode, the loss ledger can be sorted to show which failure categories are actually driving lost tonnage — usually a short list, and usually not the list plant leadership expects.
Once bearing and hydraulic failures show up as the top two categories, they stop being background noise and become a target: a specific bad-actor list, a specific inspection frequency, a specific spares reservation. Reliability teams that build this view consistently find that a small number of failure modes account for the majority of lost tonnage, which is exactly what makes the ledger worth building in the first place.
Why Shift-Level Data Is Uncomfortable and Necessary
Breaking loss data down by shift is rarely popular, because it surfaces patterns that look like a people problem before anyone digs into the root cause. In practice, shift-level differences are usually a process signal, not a performance one.
Spreadsheet Loss Tracking vs. a Structured Loss Ledger
Most steel plants already track something — a downtime spreadsheet, a whiteboard, a shift-report template. The problem is rarely the intent; it is that the format cannot hold five linked fields consistently across hundreds of events a year.
| What matters | Spreadsheet / shift log | Structured loss ledger in Oxmaint |
|---|---|---|
| Asset-level detail | Line-level only, component lost | Tied to the exact asset in the hierarchy |
| Failure mode | Free text, inconsistent wording | Fixed reason-code list, sortable |
| Duration accuracy | Rounded, entered after the fact | Timestamped at stop and restart |
| Tonnes affected | Calculated separately by finance, days later | Converted automatically from line rate |
| Shift comparison | Possible, but manual and rare | Standard filtered view |
| Pareto by failure mode | Requires manual re-coding of free text | Built from existing reason codes |
How the Ledger Feeds Maintenance Work, Not Just Reporting
A loss ledger only earns its keep if it changes what maintenance does next, not just what appears in a monthly slide deck. In Oxmaint, the same record that captures a stoppage also drives the corrective work that follows it.
That last step is where loss tracking stops being a reporting exercise and starts changing the preventive maintenance schedule itself — an asset with a rising failure frequency can be flagged for a shorter inspection interval, an added vibration check, or a spares reservation, directly from the same history that recorded the losses.
What This Looks Like on a Reliability Dashboard
Once loss records accumulate across a few months, the dashboard view stops being a list of incidents and starts answering the questions a reliability manager is actually asked in a review meeting.
Loss Tracking, Spares, and the Cost of Being Unprepared
A failure mode Pareto is only half the picture once it points to bearings and hydraulic components as the top two causes of lost tonnage. The next question a reliability manager has to answer is whether the right spares were on the shelf when those failures happened, because a correctly diagnosed failure that waits four hours for a part is still four hours of lost tonnage.
Loss records that carry the asset and failure mode can be cross-referenced against inventory history to show a second, quieter category of loss: downtime extended by parts availability rather than by the repair itself. Where that pattern shows up repeatedly on the same bearing size or valve type, it becomes a stocking decision rather than a maintenance one — raise the minimum quantity, or move the part closer to the line it actually serves.
Separating wait time from repair time inside the same loss record is what turns a downtime ledger into a spares strategy, not just a maintenance report — and it is the kind of detail that a general downtime spreadsheet almost never captures, because nobody thinks to log the moment a technician started waiting rather than the moment they started fixing.
Compliance, Audits, and the Value of a Defensible Record
Steel plants operating under ISO 9001, IATF 16949, or customer-specific quality agreements are regularly asked to demonstrate that unplanned stoppages affecting quality-critical processes were investigated and closed out. A structured loss ledger doubles as that evidence trail — asset, failure mode, corrective action, and closure date, all attached to the same record, ready to produce during an audit rather than reconstructed from memory afterward.
The same structure supports insurance and warranty claims after a major equipment failure, where a timestamped, asset-specific record of the failure mode and prior maintenance history carries far more weight than a shift-log summary written days after the event.
Frequently Asked Questions
Turn Every Stoppage Into a Record You Can Actually Use
Asset, line, shift, failure mode, duration, tonnes affected — captured the same way every time, on every line, so the loss data is still useful by the time anyone reads the report.