
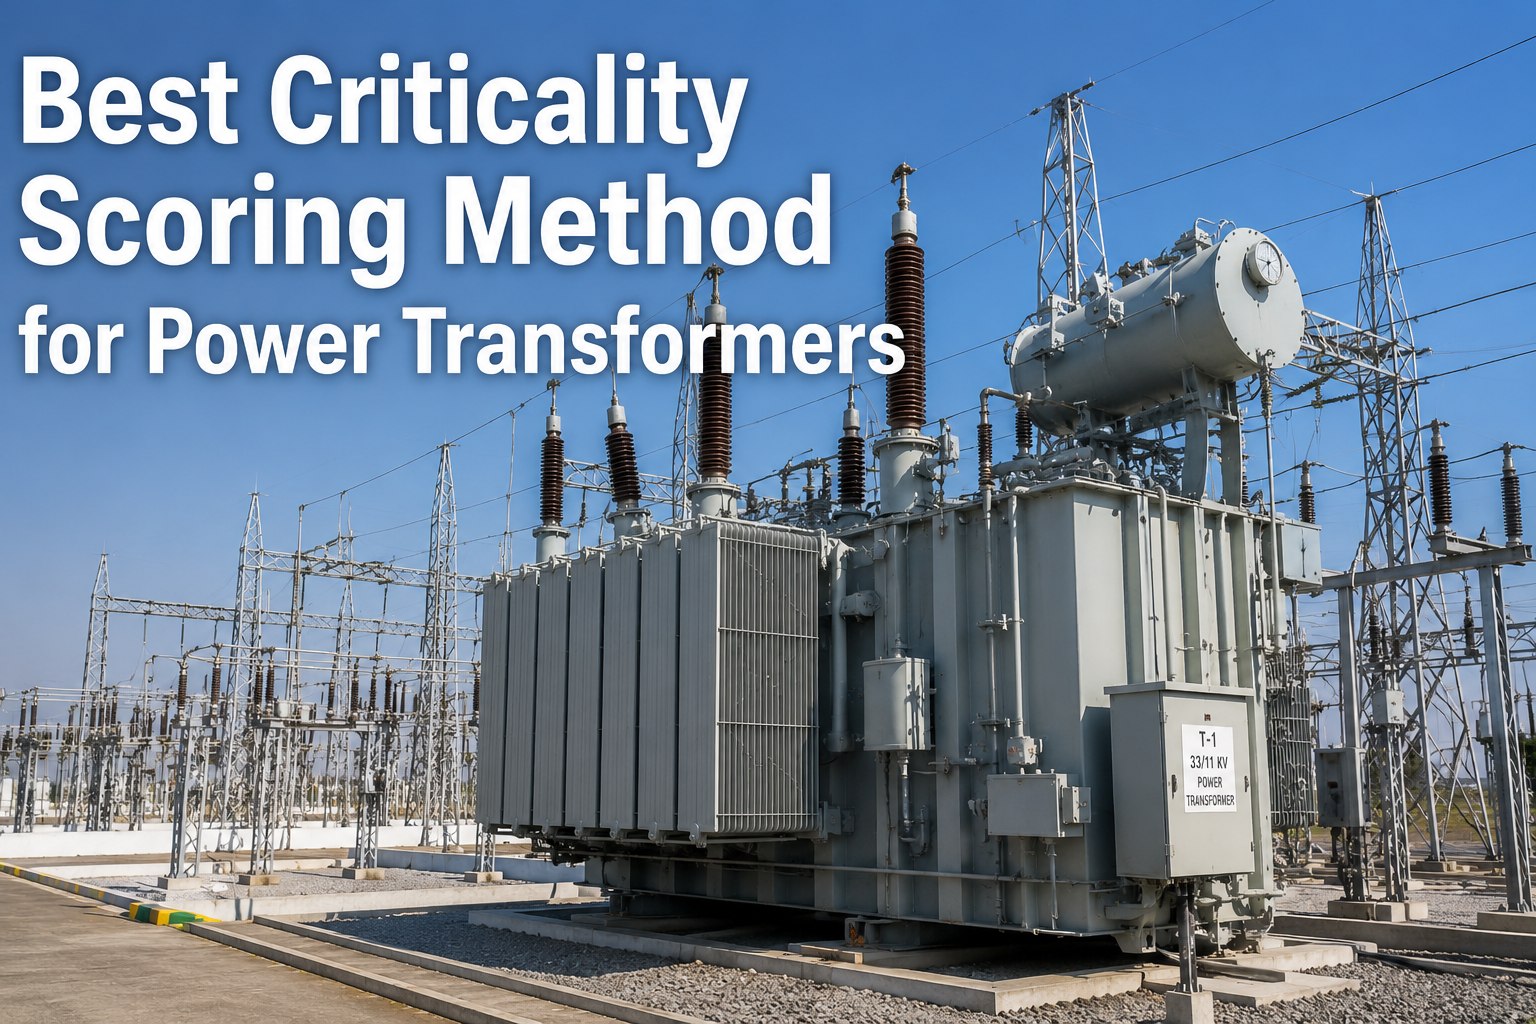
Criticality analysis for power transformers is the systematic process of ranking transformer assets by the consequence of their failure — weighting financial impact, safety, grid stability, and environmental risk — so maintenance teams can allocate preventive and predictive resources where they matter most. A robust power transformers risk assessment moves reliability programs from reactive firefighting to controlled, data-driven maintenance prioritization, ensuring that high-risk units receive oil sampling, dissolved gas analysis (DGA), and bushing inspections before catastrophic failure. This guide breaks down the best criticality scoring method, consequence-of-failure frameworks, and tier-ranking strategy for power transformers maintenance, showing how modern CMMS platforms like OxMaint operationalize these scores into automated PM schedules and work-order workflows. Ready to transform your asset priority strategy? Start Free Trial and map your entire transformer fleet today.
Is your highest-risk transformer the one getting the least maintenance attention?
Without a structured power transformers criticality ranking, teams spread preventive maintenance evenly across the fleet — over-maintaining low-impact units while critical grid-edge assets degrade silently. Consequence-of-failure scoring changes that.
How to build a power transformers risk matrix that actually reflects reality
A defensible power transformers consequence analysis evaluates four impact dimensions. Most utilities weight financial impact at 40%, safety at 25%, grid stability at 20%, and environmental risk at 15% — but your weights should reflect your regulatory environment and load profile.
Financial Impact
Replacement cost ($300K–$5M+), emergency repair labor, lost revenue from outage duration, and contractual grid-penalty exposure. A 50 MVA unit serving an industrial cluster can rack up $50K–$200K per day of unplanned outage.
Safety & Personnel Risk
Catastrophic transformer failures project blast debris, oil spray, and toxic smoke. Score proximity to occupied buildings, public right-of-ways, and worker exposure during oil handling and tap-changer maintenance.
Grid Stability & Redundancy
N-1 contingency analysis: if this transformer fails, can the load transfer without exceeding emergency ratings? Substations with zero redundancy and critical feeders score highest on this dimension.
Environmental & Regulatory
Oil containment capacity, proximity to waterways, PCB history, and SPCC compliance requirements. A single oil spill near a watershed can trigger $500K+ in remediation and regulatory fines.
The power transformers priority scoring formula reliability teams use
Criticality is not just consequence — it is consequence multiplied by the probability of failure. The standard power transformers failure impact scoring model combines both into a single actionable risk score from 1 to 100.
A regional utility operates 180 power transformers. Today, every unit receives the same annual oil test and 5-year DGA cycle. By applying the CRS formula, they discover 12 transformers score above 75 (Tier 1 — critical), 34 score 50–74 (Tier 2 — essential), and 134 score below 50 (Tier 3 — standard). The 12 Tier-1 units carry 68% of total fleet risk but were receiving the same PM frequency as low-risk assets.
Power transformers tier ranking: matching maintenance strategy to risk level
Once criticality scores are calculated, transformers are grouped into maintenance tiers. Each tier defines the frequency, depth, and type of maintenance intervention — ensuring that power transformers maintenance priority aligns with actual asset risk, not arbitrary schedules.
| Tier | CRS Score | Asset Description | Maintenance Strategy | Key Interventions |
|---|---|---|---|---|
| Tier 1 | 75–100 | Critical — no redundancy, high load, aged fleet | Predictive + Condition-Based | Monthly DGA, quarterly oil quality, online monitoring, annual sweep frequency response analysis (SFRA) |
| Tier 2 | 50–74 | Essential — limited redundancy, moderate load | Preventive + Periodic Condition | Quarterly DGA, annual oil test, biennial bushing power factor, 3-year internal inspection |
| Tier 3 | Below 50 | Standard — redundant, low load, newer units | Time-Based Preventive | Annual oil sample, 5-year DGA, visual thermography, deferred capital intervention |
How insulation & winding degradation should adjust your criticality score
Static criticality scores are a starting point. Power transformers reliability demands dynamic adjustment based on condition indicators — especially insulation & winding degradation, the leading precursor to catastrophic failure.
Dissolved Gas Analysis (DGA) Trends
Rising acetylene (C2H2) above 5 ppm indicates internal arcing; increasing ethylene (C2H4) with methane suggests hot spots above 150°C. A negative DGA trend should increase the probability multiplier (Pfail) by 0.3–0.5, pushing a borderline Tier-2 unit into Tier-1 priority.
Moisture-in-Oil Content
Moisture above 20 ppm in free-breathing transformers accelerates cellulose aging by 2x and reduces dielectric strength by 15–30%. High moisture combined with load cycling dramatically increases partial discharge risk and warrants immediate criticality re-scoring.
Degree of Polymerization (DP)
DP below 450 signals significant paper aging; below 250 indicates end-of-life insulation. Transformers with low DP should carry a probability multiplier of 1.8–2.0 regardless of chronological age, triggering accelerated replacement planning.
Load History & Thermal Stress
Units consistently loaded above 85% nameplate experience 1.5–2x faster insulation degradation. Loading factor history must feed the criticality model — a 15-year-old transformer at 95% load may carry more risk than a 30-year-old at 60% load.
How OxMaint operationalizes transformer criticality into daily maintenance action
A criticality score is only valuable if it changes how work is planned and executed. OxMaint's AI-powered CMMS turns your power transformers asset priority ranking into automated PM schedules, condition-based work-order triggers, and real-time risk dashboards — closing the gap between analysis and action.
Dynamic Asset Risk Register
Store criticality scores, DGA trends, and condition data in one asset hierarchy. When a new oil sample or thermography result is logged, OxMaint auto-adjusts the risk tier and reprioritizes the PM schedule — no spreadsheet updates required.
Tier-Based PM Automation
OxMaint automatically generates work orders at the frequency defined by each transformer's tier — monthly DGA for Tier 1, quarterly for Tier 2, annual for Tier 3. Tasks route to qualified technicians with checklists, spare-parts kits, and safety procedures attached.
Predictive Condition Triggers
Connect IoT sensors, online DGA monitors, and SCADA load data to OxMaint. When acetylene crosses threshold or winding temperature spikes, the system auto-creates a priority work order and escalates to the reliability engineer — before failure occurs.
Audit-Ready Compliance Reporting
Every criticality decision, PM deferral, and condition assessment is logged with timestamps and technician attribution. Generate NERC, FERC, or ISO 55000 compliance reports in one click — proving that maintenance priority is driven by documented risk methodology, not guesswork.
See OxMaint rank your transformer fleet by real risk — not guesswork
Book a 30-minute demo and our reliability engineers will map your transformer criticality scores to automated PM workflows live on your asset data.
Power transformers criticality analysis: what teams ask most
From scoring weights to condition-based adjustments, here are the most common questions maintenance and reliability leaders have when implementing power transformers importance ranking.
What is the best criticality scoring method for power transformers?
The most effective method combines a weighted consequence-of-failure model (financial, safety, grid stability, environmental) with a probability-of-failure multiplier driven by condition data like DGA trends, age, and load history. This produces a 1–100 Criticality Risk Score that objectively ranks transformers into maintenance tiers. You can build and automate this scoring model inside OxMaint so scores update dynamically as new condition data arrives.
How often should power transformer criticality scores be recalculated?
Static criticality reviews should happen annually, but dynamic re-scoring should trigger whenever new condition data is logged — a DGA sample, thermography scan, or significant load-profile change. Best practice is to set threshold-based alerts: if acetylene rises above 5 ppm or moisture exceeds 20 ppm, the criticality score auto-updates and the PM schedule adjusts. This is standard functionality in OxMaint's asset risk register.
What weight should be assigned to each consequence factor in the risk matrix?
Typical starting weights are 40% financial impact, 25% safety, 20% grid stability, and 15% environmental risk. However, these should be adjusted for your context: a utility serving a dense urban area may increase grid-stability weight to 30%, while one near waterways may raise environmental to 25%. The key is documenting the rationale so scores are defensible during audits and consistent across the fleet.
How does criticality ranking change maintenance strategy for transformers?
Tier 1 (high criticality) transformers shift to predictive, condition-based maintenance with monthly DGA, online monitoring, and annual SFRA. Tier 2 moves to preventive with quarterly testing. Tier 3 remains on time-based annual schedules. This ensures 68% of fleet risk — often concentrated in 10–15% of assets — receives proportionally more attention and budget, cutting unplanned outages by 25–35%.
Can a CMMS automate power transformers criticality ranking?
Yes. An AI-powered CMMS like OxMaint stores criticality scores in the asset hierarchy, auto-generates tier-based PM work orders, and dynamically adjusts risk tiers when condition data is logged. This eliminates manual spreadsheet updates, ensures PM frequency always matches current risk, and provides an audit trail linking every maintenance decision to a documented criticality methodology.
Stop maintaining every transformer the same way
Deploy a criticality-driven maintenance strategy across your entire fleet with OxMaint — AI-powered work orders, predictive condition triggers, and audit-ready compliance reporting built for power transformer reliability teams.
Free 14-day trial · No credit card


-optimizing-your-maintenance-strategy.png)