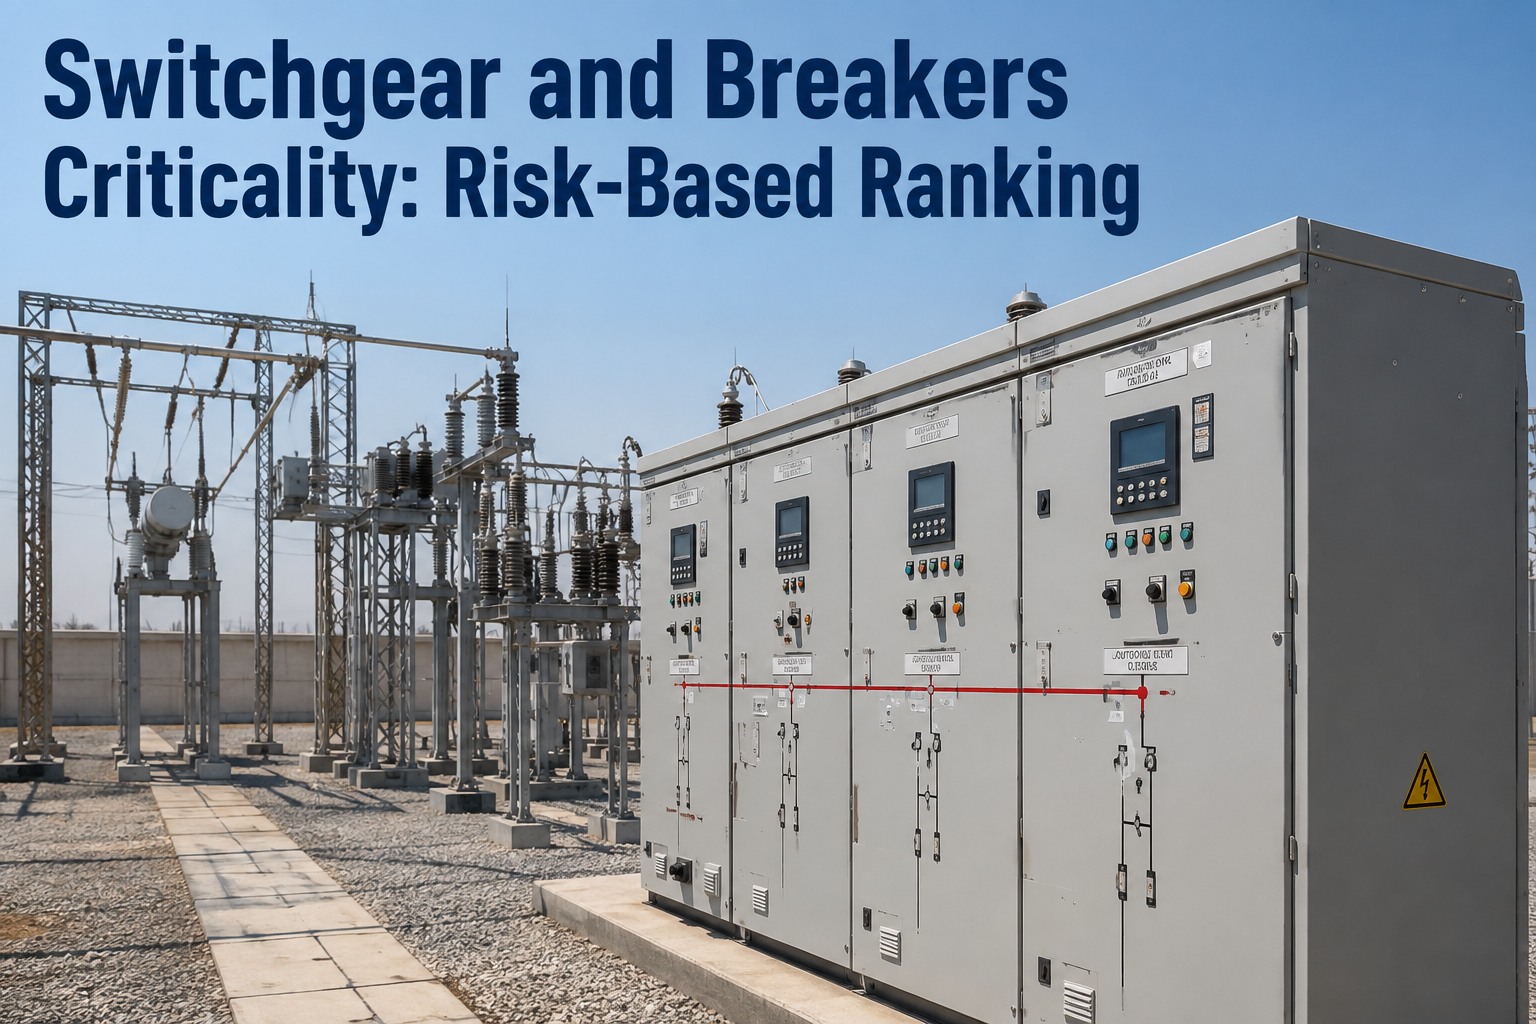
Criticality analysis for switchgear & breakers is the process of ranking electrical assets by consequence and probability of failure so maintenance teams can allocate preventive and predictive resources where downtime, safety, and compliance risks are highest. Instead of treating every breaker equally, a risk-based switchgear & breakers criticality ranking applies consequence-of-failure scoring across production impact, redundancy, safety, and regulatory exposure to produce a tiered maintenance priority list. By formalizing switchgear & breakers risk assessment into a measurable matrix, reliability teams shift from reactive firefighting to controlled, data-driven asset management. OxMaint's AI-powered CMMS and EAM platform operationalizes this exact framework, turning your priority scoring into automated PMs, mobile work orders, and live analytics. Start Free Trial to map your criticality matrix today.
Risk-Based Maintenance Strategy
What if your next breaker failure wasn't a surprise?
A single catastrophic switchgear failure can cost over $500K in damage, lost production, and regulatory fines. Move from reactive firefighting to controlled reliability with a systematic switchgear & breakers risk assessment framework that ranks every asset by true operational consequence.
The Cost of Inaction
Why switchgear & breakers criticality ranking matters
Electrical switchgear and circuit breakers sit at the intersection of production continuity, personnel safety, and regulatory compliance. Yet industry studies show that nearly 73% of switchgear failures are preventable through proper maintenance prioritization. When teams treat all breakers equally, they over-maintain low-criticality assets and under-maintain the ones that can halt a 180-asset plant for 14 hours at $30K per hour in lost output alone. A structured switchgear & breakers importance ranking system eliminates this blind spot by scoring assets on consequence of failure, not just age or guesswork.
Scoring Framework
How to score switchgear & breakers consequence analysis
Switchgear & breakers consequence analysis evaluates what happens when an asset fails. Each breaker is scored across four weighted dimensions: production impact, safety and environmental risk, redundancy availability, and regulatory compliance exposure. The composite score places the asset into a risk tier that dictates maintenance frequency, inspection depth, and whether predictive technologies like partial discharge monitoring or dissolved gas analysis are warranted.
Score the operational downtime cost if the breaker trips and cannot be reset. A main feeder breaker halting a production line scores 5; a lighting circuit breaker scores 1. Factor in upstream dependencies and recovery time.
Evaluate arc-flash energy, personnel proximity, and environmental hazard potential. SF6 breakers in confined spaces with high arc-flash incidence carry the highest safety consequence weighting.
Determine whether an alternate power path exists. A breaker with automatic transfer switch redundancy scores lower on consequence; a single-point-of-failure main breaker scores 5 because no backup path exists.
Assess NFPA 70B, NETA MTS, and OSHA compliance implications. Breakers feeding life-safety systems or required by insurance carriers carry elevated compliance consequence scores.
Risk Matrix
Switchgear & breakers risk matrix and tier ranking
The switchgear & breakers risk matrix maps consequence scores against probability of failure based on asset age, operating environment, maintenance history, and failure mode data. This produces a four-tier asset priority system that directly drives maintenance strategy selection — from continuous condition monitoring for Tier 1 to run-to-failure for Tier 4.
| Risk Tier | Score Range | Asset Characteristics | Maintenance Strategy | Inspection Frequency |
|---|---|---|---|---|
| Tier 1 Critical | 4.0 – 5.0 | Main breakers, single-point-of-failure feeders, life-safety tie breakers | Predictive + condition-based with continuous monitoring | Monthly visual, quarterly IR scan, annual full inspection |
| Tier 2 Essential | 3.0 – 3.9 | Production feeders with partial redundancy, large motor breakers | Preventive with scheduled overcurrent testing and contact wear tracking | Quarterly visual, semi-annual IR scan, biennial full inspection |
| Tier 3 Standard | 2.0 – 2.9 | Distribution breakers with backup paths, non-critical loads | Time-based preventive maintenance on 2-3 year cycles | Annual visual, IR scan every 2 years |
| Tier 4 Low Priority | Below 2.0 | Lighting circuits, auxiliary loads with zero production impact | Run-to-failure with corrective work orders | Visual during routine rounds only |
Strategy Selection
Matching switchgear maintenance strategy to criticality tier
Switchgear maintenance is not one-size-fits-all. The risk tier determines whether you invest in contact resistance trending and mechanism failure prediction, or simply respond when a low-priority breaker trips. Aligning your maintenance strategy to the switchgear & breakers maintenance priority ensures reliability budget is spent where it prevents the most costly failures. Two failure modes dominate breaker reliability data: contact wear from repeated overcurrent operations, and mechanism failure from lubrication degradation, spring fatigue, and alignment drift.
Contact Wear Tracking
Each overcurrent operation erodes breaker contacts. Track operation counts against manufacturer endurance limits (typically 2,000–10,000 operations) to predict contact replacement timing before insulation resistance drops or partial discharge begins.
Mechanism Failure Prediction
Stored-energy mechanisms fail from lubrication breakdown, spring set, and linkage wear. Tier 1 and 2 breakers require timed trip-and-close testing every 1-2 years to detect mechanism degradation before the breaker fails to clear a fault.
Insulation & Partial Discharge
Solid and gas insulation degrades from thermal cycling, moisture ingress, and PD activity. Ultrasonic and UHF partial discharge surveys on Tier 1 switchgear identify developing insulation faults 6-18 months before flashover.
Worked Example
Criticality ranking in action: a 180-asset plant scenario
Consider a mid-sized manufacturing facility with 180 electrical assets and a $42K annual maintenance budget. Without criticality ranking, the team spent equal time on every breaker — 2.3 hours per asset per year. After implementing a switchgear & breakers priority scoring system, they reallocated effort: Tier 1 breakers received 8 hours of predictive maintenance each, Tier 2 received 4 hours of preventive work, Tier 3 dropped to 1 hour, and Tier 4 moved to run-to-failure. The result: a 38% drop in unplanned electrical downtime, $156K in avoided production loss, and the maintenance budget actually decreased by 12% because overtime callouts fell.
- Equal time spent on every breaker regardless of consequence
- Reactive callouts averaged 3.2 per month during production runs
- No tracking of operation counts or contact wear trends
- Breaker failures caused 14-hour average production stops
- Maintenance budget consumed by overtime and emergency parts
- Tier 1 breakers receive 8x more maintenance attention than Tier 4
- Predictive PMs reduced unplanned callouts to 0.7 per month
- Automatic operation count tracking flags contact wear at 80% limit
- Mean downtime dropped to 3.1 hours with pre-staged spare parts
- Budget reduced 12% while downtime cost avoidance hit $156K annually
See how OxMaint ranks and protects your critical breakers
Book a 30-minute demo and we'll map your switchgear criticality matrix live — showing exactly which assets need predictive monitoring and which can move to run-to-failure.
Platform Capabilities
How OxMaint operationalizes switchgear & breakers criticality
A criticality score on a spreadsheet changes nothing if it doesn't drive daily maintenance decisions. OxMaint connects your switchgear & breakers asset priority directly to work order generation, PM scheduling, spare parts staging, and compliance reporting — so the right maintenance happens on the right breaker at the right interval, automatically.
Asset Hierarchy & Criticality Scoring
Build a complete electrical asset hierarchy from substation to feeder to load. Assign criticality scores using customizable weighted criteria and let OxMaint auto-tier every breaker for switchgear & breakers reliability prioritization.
Risk-Based PM Automation
Each risk tier triggers its own PM template — monthly IR scans for Tier 1, biennial full inspections for Tier 3. OxMaint auto-generates and assigns work orders based on tier, operation count, or condition data without manual scheduling.
Mobile Work Order Execution
Technicians receive switchgear maintenance checklists on mobile devices with asset history, previous test results, and safety procedures. Capture contact resistance readings and trip times digitally — no paper, no data entry lag.
Predictive Analytics & Compliance Reporting
Track operation counts, contact wear trends, and mechanism test results over time. OxMaint's AI flags breakers approaching failure thresholds and generates NFPA 70B, NETA MTS, and insurance compliance reports in one click.
Common Questions
Switchgear & breakers criticality analysis FAQ
What is criticality analysis for switchgear & breakers?
Criticality analysis for switchgear & breakers is a risk-based method of ranking electrical assets by the consequence of their failure across production, safety, redundancy, and compliance dimensions. Each breaker receives a composite score that places it into a maintenance priority tier, ensuring the most consequential assets receive the most intensive preventive and predictive attention. OxMaint automates this scoring and links it directly to PM scheduling.
How often should switchgear maintenance be performed?
Maintenance frequency depends on the criticality tier: Tier 1 critical breakers require monthly visual inspections, quarterly infrared scans, and annual full inspections per NFPA 70B. Tier 2 assets typically need semi-annual to biennial cycles, while Tier 3 and 4 breakers may only require visual checks every 1-3 years. OxMaint's CMMS auto-schedules these intervals based on your risk tier assignments. Book a Demo to see automated PM scheduling in action.
What are the most common switchgear failure modes?
The three dominant switchgear failure modes are contact wear from repeated overcurrent operations, mechanism failure from lubrication degradation and spring fatigue, and insulation breakdown from partial discharge and thermal cycling. Tracking operation counts against manufacturer endurance limits and conducting timed trip-close tests every 1-2 years catches approximately 70% of developing failures before functional loss.
How do you calculate a switchgear criticality score?
A switchgear criticality score is calculated by weighting and summing four factors: production impact (35%), safety risk (30%), redundancy gap (20%), and compliance exposure (15%). Each factor is scored 1 to 5, producing a composite from 1.0 to 5.0. Scores of 4.0 and above indicate Tier 1 critical assets requiring predictive maintenance; scores below 2.0 indicate Tier 4 low-priority assets suitable for run-to-failure strategy.
Can a CMMS improve switchgear & breakers reliability?
Yes. A CMMS like OxMaint improves switchgear & breakers reliability by linking criticality scores to automated PM generation, tracking operation counts and test data over time, staging spare parts by tier, and providing mobile checklists that ensure inspection consistency. Plants using risk-based CMMS scheduling typically reduce unplanned electrical downtime 30-50% and cut emergency maintenance callouts by 60-80%. Start Free Trial to operationalize your criticality matrix today.
Stop guessing which breakers matter most
Build your switchgear & breakers criticality matrix in OxMaint and let risk-based automation handle the rest. Your most critical assets get predictive protection; your least critical move to efficient run-to-failure.
Free 14-day trial · No credit card