Chiller maintenance is the one programme in a building where cutting corners shows up in the energy bill long before it shows up as a breakdown. A neglected chiller does not stop. It keeps making chilled water, keeps meeting setpoint, keeps the tenants comfortable — and quietly draws more kilowatts for every ton it delivers, every hour, all season. That is what makes it so expensive: nothing alarms. A 10% drift in kW/ton from commissioning baseline on a 500-ton machine running 2,500 hours a year costs roughly $25,000 to $35,000 in additional electricity annually, which is more than the entire PM programme. And the mechanisms behind that drift are not mysterious. Fouled tubes can raise chiller energy consumption by 20 to 30%. Non-condensables trapped in the condenser cut efficiency by up to 4% at 60% load and 7% at full load. A refrigerant charge 10% below design makes the compressor work harder while delivering less cooling. Each is invisible to a walk-past and obvious to an instrument. This guide covers how to maintain a chiller plant to OEM specification so COP holds and energy cost stays where it was designed to be. Start a free Oxmaint trial and trend kW/ton against commissioning baseline, or book a demo to see approach temperature trigger tube-cleaning work orders.
HVAC · Chiller Plant · Energy Optimization
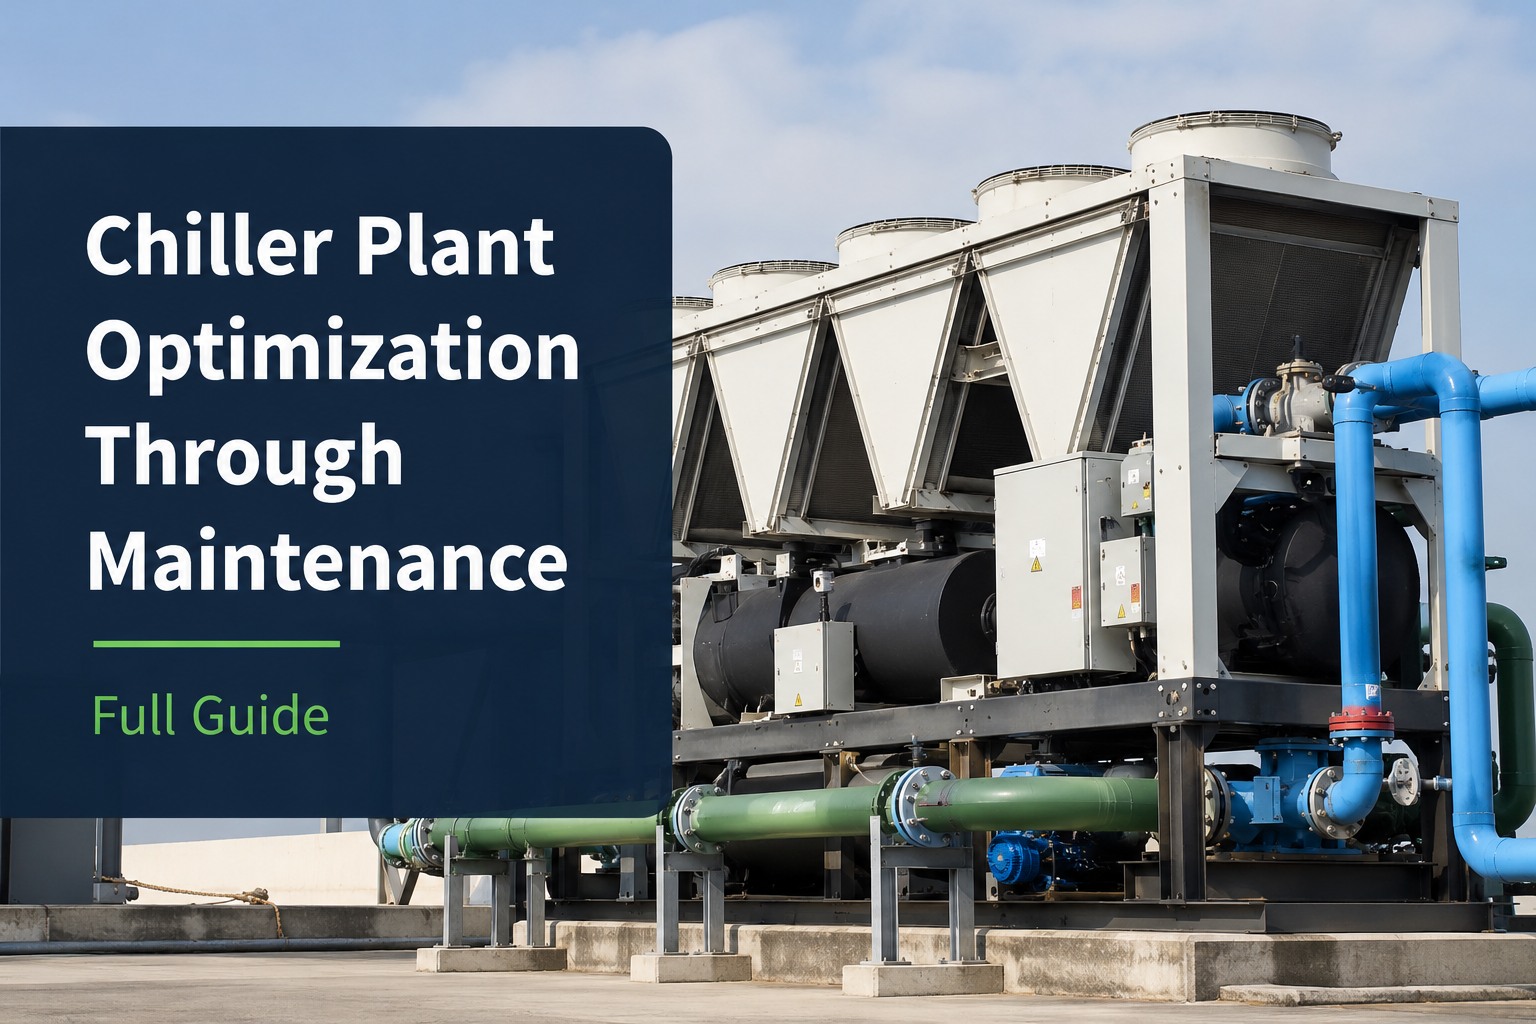
Chiller Plant Optimization Through Maintenance
How maintaining chillers to OEM specification protects COP and cuts energy cost — tube fouling intervals, purge unit PM, condenser water treatment, and the instrument readings that expose degradation months before failure.
-
20–30%
more energy consumed when condenser tubes are fouled
-
45–60%
of total cooling energy in large commercial facilities
-
+3°F
approach rise above design triggers OEM tube cleaning
-
$25K–$35K
annual cost of 10% efficiency loss on a 500-ton chiller
Three Ways a Chiller Gets Expensive
The Efficiency Thieves, and What Each One Costs
Chiller degradation is not one slow decline — it is three distinct mechanisms, each with its own penalty, its own indicator, and its own maintenance answer. Every one of them raises the compressor's work per ton of cooling delivered.
- Tube fouling 20–30% more energy Minerals, scale, mud, algae, and biofilm insulate the tubes. A large chiller can hold more than five miles of condenser and evaporator tubing, and just 0.25mm of scale cuts heat transfer efficiency by about 30% — forcing condensing pressure and compressor lift up.
- Non-condensables 4–7% efficiency loss Air and moisture leak into low-pressure machines and become trapped at the top of the condenser, insulating tubes and elevating condensing pressure. Roughly 4% loss at 60% load, 7% at full load — and moisture promotes acid formation that attacks windings and bearings.
- Low refrigerant charge harder work, less cooling Usually the result of undetected leaks. A charge 10% below design strains the compressor while simultaneously reducing cooling capacity — invisible without refrigerant pressure readings, and damaging if carried through a full cooling season.
Undetected refrigerant leaks, condenser tube fouling, and missed oil analysis cycles are the three leading causes of chiller failure — and all three are preventable. Book a demo to see each degradation mechanism trended separately.
The Diagnostic That Sees It First
Approach Temperature Is the Tell
Approach temperature is the difference between refrigerant saturation temperature inside a heat exchanger and the leaving water temperature. It rises long before efficiency loss becomes obvious — which is exactly when cleaning is still cheap. Track it daily and the chiller tells you what it needs.
-
1
Fouling begins, invisibly
Scale and biofilm accumulate gradually over months. Nothing alarms, capacity still holds, and the machine keeps meeting setpoint while drawing more power to do it. -
2
Approach temperature climbs
Each 1°F of approach rise costs roughly 1–2% efficiency. A condenser approach drifting from 3°F toward 7°F is signalling tube fouling, scale, or insufficient water flow. -
3
The OEM threshold is crossed
More than 3°F above the original design specification on either condenser or evaporator: most manufacturers require tube cleaning and refrigerant inspection at this point, before efficiency loss compounds. -
4
Ignored, it becomes mechanical
Severe fouling raises discharge pressure beyond safe limits and leads to compressor surge, motor damage, and catastrophic failure — the expensive end of a problem that started as a cleaning task.
A 10% degradation in kW/ton from commissioning baseline is the standard threshold that should trigger a full PM inspection. Sign up for Oxmaint to auto-raise a work order when approach crosses design plus 3°F.
Read the Plant by Its Numbers
The Readings That Define Chiller Health
Optimization is a measurement discipline. These are the values to baseline at commissioning and trend continuously — because a chiller that has drifted 20% below design efficiency costs more to run every single day than the service contract that would have prevented it.
| Reading | Benchmark | What a Deviation Means |
|---|---|---|
| kW/ton, centrifugal | 0.45–0.55 at AHRI conditions | Above 0.8 warrants immediate investigation |
| Condenser approach | Design spec, tracked daily | +3°F triggers tube cleaning |
| Superheat | 8–12°F at suction inlet | High: restricted metering or low charge |
| Purge unit runtime | Low and stable | Rising runtime means the machine is leaking |
| Annual degradation | 1–3% per year is normal wear | Faster decline requires investigation |
Purge-unit runtime and moisture accumulation are the best leak indicators on a low-pressure machine — a purge that runs constantly is reporting an air ingress path, not doing its job well. Book a demo to see purge runtime and kW/ton trended together.
The Cheapest, Highest-Return Tasks in the Plant
Water Treatment Is Chiller Efficiency, Upstream
Condenser water treatment does not look like an energy conservation measure on a work order, but it is the most direct one available. Minerals, scale, mud, and algae arrive through the condenser water loop, and a paper-thin deposit on the tubes acts as insulation that pushes condensing pressure and compressor lift up for the rest of the season. Disciplined water treatment — testing pH, conductivity, and corrosion inhibitor concentration on schedule — combined with regular tube cleaning virtually eliminates fouling inside the machine and holds design approach temperatures, with payback typically under two years. Add quarterly compressor leak testing, EPA Section 608 leak-rate tracking, and oil analysis on cadence, and the three leading causes of chiller failure are all being actively defended against. Regular tube cleaning and disciplined water treatment remain the cheapest, highest-return maintenance tasks in the entire plant.
Oxmaint for Chiller Plants
How Oxmaint Runs Chiller Optimization
-
Baseline Trending
kW/ton Against Commissioning
Hold the commissioning baseline per machine and trend kW/ton under comparable load, so a 10% degradation raises a full PM inspection rather than being absorbed silently into the utility bill.
-
Approach Alerts
Design Spec Plus 3°F
Log condenser and evaporator approach daily and auto-generate a tube-cleaning and refrigerant-inspection work order the moment either rises more than 3°F above the original design specification.
-
Purge Unit PM
Runtime as a Leak Signal
Track purge-unit runtime and moisture accumulation on low-pressure machines as the primary leak indicator, with head pressure and condensing temperature trended alongside as corroborating evidence.
-
Water Treatment
Chemistry on Schedule
Recurring tests for pH, conductivity, and corrosion inhibitor concentration, plus strainer basket inspection on both chilled and condenser water sides — the upstream control that keeps tubes clean.
-
Refrigerant & Oil
608 Tracking, Quarterly Analysis
EPA Section 608 refrigerant leak-rate tracking with full leak-detection surveys, quarterly oil analysis reminders, and superheat and subcooling recorded against the asset each service.
-
Performance Record
One Searchable History
Every efficiency test, tube cleaning, oil sample, and refrigerant survey in one searchable record per chiller — producing the performance report that proves the plant is holding its design COP.
Frequently Asked
Chiller Maintenance Questions
What is approach temperature and why track it daily?
Approach temperature is the difference between the refrigerant saturation temperature inside a heat exchanger and the leaving water temperature. On the condenser side, a rising approach — drifting from 3°F toward 7°F, for example — signals tube fouling, scale buildup, or insufficient water flow. Because each 1°F of approach rise costs roughly 1–2% efficiency, tracking it daily gives an early warning that tube cleaning is needed before losses compound into higher energy costs and equipment damage. Sign up for Oxmaint to log approach temperature daily.
When do OEMs require condenser tube cleaning?
Most chiller manufacturers recommend scheduling tube cleaning and a refrigerant inspection when approach temperature on either the condenser or the evaporator rises more than 3°F above the original design specification. The reason the threshold is that tight is compounding: fouled tubes can raise chiller energy consumption 20–30%, and severe fouling pushes discharge pressure beyond safe limits, leading to compressor surge, motor damage, and catastrophic failure.
What do purge units do and how do they reveal leaks?
Low-pressure chillers operate portions of the refrigeration circuit below atmospheric pressure, so air and moisture — non-condensables — leak inward and become trapped in the condenser, raising condensing pressure and compressor power while cutting capacity. Purge units remove them. The best leak indicator on such a machine is purge-unit runtime and moisture accumulation: if either is high, the unit is leaking. Increased head pressure and condensing temperature corroborate it. Book a demo to see purge runtime tracked as a leak signal.
What does chiller efficiency degradation actually cost?
On a 500-ton chiller running 2,500 hours per year at $0.10/kWh, a 10% loss in kW/ton from the commissioning baseline costs roughly $25,000 to $35,000 in additional annual electricity — considerably more than the PM programme that would have prevented it. Chiller plants consume 45–60% of total cooling energy in large commercial facilities, so a degraded machine is the dominant energy load running dirty. Normal wear produces 1–3% degradation per year; anything faster warrants investigation. Sign up for Oxmaint to hold the baseline and prove the savings.
Measure · Clean · Purge · Treat
A Chiller Never Warns You. Its Instruments Do.
Every degree of approach temperature nobody logged, every purge unit running longer than last month, and every kW/ton reading never compared to commissioning is money leaving through a machine that still looks like it is working. Oxmaint gives chiller plant teams one platform to trend kW/ton against baseline, auto-raise tube cleaning at design plus 3°F, track purge runtime as a leak signal, schedule water treatment chemistry and oil analysis, and hold one searchable performance record per machine — so the COP the plant was designed for is the COP it actually delivers.