Most food manufacturing plants think they know what downtime costs them. They're wrong — by a factor of five to ten. When a line stops, managers count the repair invoice and move on. They miss the scrapped raw materials, idle labour still on payroll, the emergency parts premium, the QA scramble, and the customer whose order just became a problem. Industry research consistently shows that facilities only capture 10–20% of their actual downtime cost, which means maintenance investment decisions are being made on numbers that are dangerously incomplete. OxMaint's downtime and cost tracking module gives food manufacturing maintenance leaders the full financial picture — every stoppage, every cost category, every asset — so ROI on maintenance investment becomes something you can prove, not just estimate. Start your free OxMaint trial or book a demo to see the cost tracking dashboard built for food manufacturing.
Maintenance KPI / Downtime & Cost Tracking
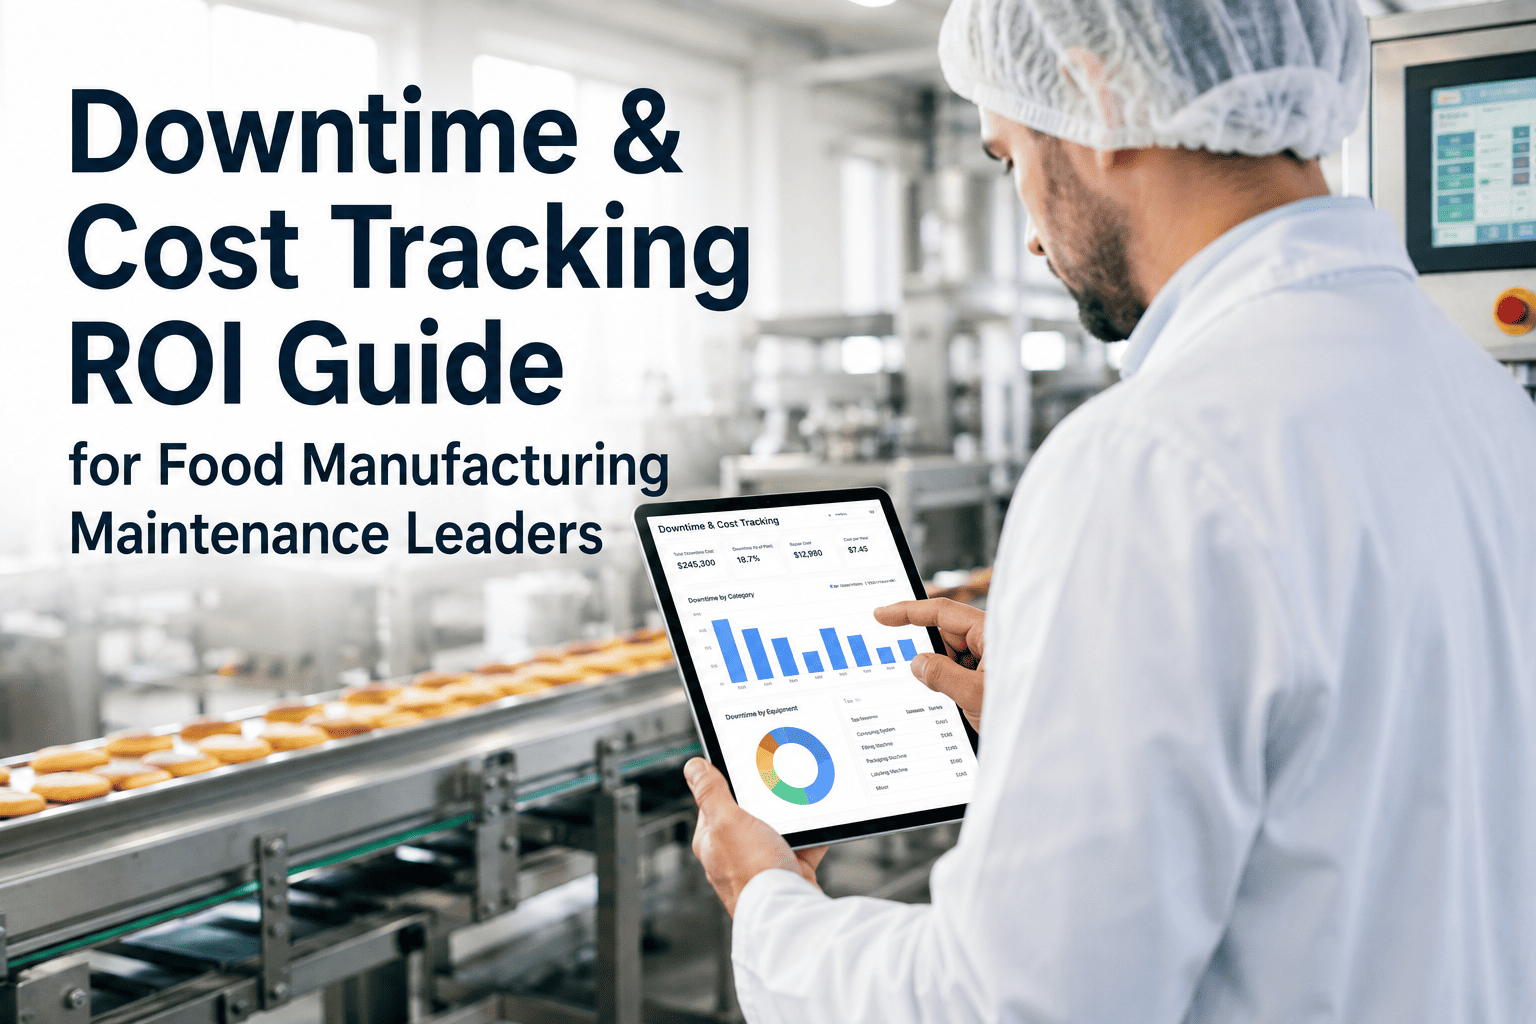
Downtime & Cost Tracking ROI Guide for Food Manufacturing Maintenance Leaders
How food manufacturing maintenance leaders quantify the real cost of unplanned stoppages, build a defensible ROI case for CMMS investment, and track every dollar of maintenance spend against actual production performance.
What Downtime Really Costs in Food Manufacturing
Small facility
$200–500/min
Mid-size plant
$800–2,500/min
Large high-speed line
$3,000–10,000+/min
Most facilities measure only 10–20% of actual downtime cost
The 4-Layer Downtime Cost Model: What You're Missing
When a filler line goes down for 90 minutes, your maintenance team files the repair. Your finance team sees one number. But four separate cost layers are accumulating simultaneously — and most food plants only capture one of them.
Layer 1
Direct Production Loss
Captured by: 95% of plants
Lost output volume multiplied by product margin. This is the only number most maintenance reports include. For a plant running $4M of product per shift, 90 minutes of downtime = $500K+ of lost production value before any other cost is applied.
Layer 2
Idle Labour and Overhead
Captured by: 40% of plants
Every operator on payroll during the stoppage represents cost with zero output. A 60-person line at average food manufacturing labour rates costs $1,200–$2,400 per hour of stoppage in idle wages alone — irrespective of whether anyone is working on the repair.
Layer 3
Material Waste and Scrap
Captured by: 25% of plants
Raw materials in process at stoppage are often unrecoverable — particularly temperature-sensitive ingredients, in-progress batches, and packaging already committed to a run. A single refrigeration failure can destroy an entire batch in transit through a processing stage.
Layer 4
Compliance and Customer Impact
Captured by: 10% of plants
Missed shipments trigger retailer chargebacks, SLA penalties, and potential contract renegotiations. HACCP documentation gaps from unplanned stoppages create regulatory exposure. A single equipment failure that triggers a product hold can cost more than a year of maintenance software investment.
The True Cost Multiplier
To calculate real downtime cost, apply a 2.4× multiplier to your visible production loss figure. This accounts for Layers 2–4 based on Aberdeen Research and ABB benchmarks for food and beverage facilities. Most plant directors find the resulting number meaningfully changes maintenance investment decisions.
Calculate Your Real Downtime Cost
Stop Underestimating Your Downtime Exposure
OxMaint's cost tracking module captures all four downtime cost layers automatically — giving maintenance leaders the complete financial picture they need to build a defensible ROI case for every maintenance investment.
Building the ROI Case: What the Numbers Look Like
A mid-sized food manufacturing facility spending $800K annually on maintenance with an average of two major unplanned incidents per month. Here is what the ROI calculation actually looks like when all cost layers are included.
Current State: Reactive Maintenance
Unplanned incidents per month
~8–10
Avg. cost per incident (all layers)
$120,000
Annual unplanned downtime cost
$1.15M+
Reactive vs planned repair cost ratio
3–5× higher
Maintenance cost as % of asset value
4–8% (industry avg)
With OxMaint Predictive Maintenance
Unplanned incident reduction
70–89%
First-year maintenance savings
$280K–$340K
Software investment (annual)
$15K–$80K
Positive ROI timeline
60–90 days
Single-incident ROI recovery
6–10× software cost
The 6 KPIs Every Food Manufacturing Maintenance Leader Must Track
01
Overall Equipment Effectiveness (OEE)
OEE = Availability × Performance × Quality
The headline maintenance metric. Food manufacturing industry average OEE sits at 55–65%. World-class is 85%+. OxMaint tracks OEE per asset and per line, flagging the gap as a dollar value your production team can act on — not just a percentage.
Industry benchmark: 55–65% avg / 85%+ world-class
02
Mean Time Between Failures (MTBF)
MTBF = Total Operating Time ÷ Number of Failures
The reliability baseline. Tracking MTBF per asset over time reveals which equipment is deteriorating ahead of schedule — and which PM intervals need shortening before the failure curve catches up with your production schedule.
Track trend over 90-day rolling window per asset
03
Mean Time to Repair (MTTR)
MTTR = Total Repair Time ÷ Number of Repair Events
Every minute of MTTR is a minute of production loss. OxMaint tracks MTTR by technician, asset type, and fault category — identifying whether your bottleneck is diagnostic time, parts availability, or procedure complexity. Reducing MTTR by 20 minutes per event on a busy line saves hundreds of thousands annually.
World-class target: Under 2 hours for critical assets
04
Planned Maintenance Percentage (PMP)
PMP = Planned Hours ÷ Total Maintenance Hours × 100
The ratio that determines whether your maintenance program is in control or in crisis. A PMP below 65% means you're spending more than a third of your maintenance capacity fighting fires. World-class food manufacturers maintain 85%+ PMP. OxMaint's dashboard shows this in real time, with trend data that proves the shift from reactive to planned.
Target: 85%+ / Below 65% = reactive maintenance signal
05
Maintenance Cost as % of Replacement Asset Value
Maintenance Cost ÷ Total Asset Replacement Value × 100
The capital allocation signal. Food manufacturing industry average sits at 4–8% of RAV. Below 2% means underinvestment (failures accumulating). Above 8% means reactive spend dominating — money going to repairs that predictive maintenance would have prevented at a fraction of the cost.
Healthy range: 2–4% RAV with predictive maintenance program
06
PM Compliance Rate
Completed PMs on Schedule ÷ Total Scheduled PMs × 100
The discipline metric. Deferred PMs are the single biggest predictor of future unplanned failures — yet most food plants lack a single dashboard that shows PM compliance across all assets. OxMaint tracks this per asset, per line, and per technician, with automatic escalation when compliance drops below threshold.
Target: 95%+ compliance. Below 80% = audit and failure risk
What 74% Preventable Downtime Means for Your ROI
Industry research consistently finds that approximately 74% of food manufacturing downtime is preventable. Understanding the breakdown tells you exactly where maintenance investment delivers the most return.
42%
Aging equipment & missed maintenance
Fixed by: Predictive & preventive maintenance
19%
Operator error
Fixed by: Digital SOPs & training tools
13%
No time to perform maintenance
Fixed by: Automated PM scheduling
26%
Truly unpredictable causes
Unavoidable — manage response time
74%
of food manufacturing downtime is preventable with the right maintenance program and tools
26%
is genuinely unpredictable — but even here, faster MTTR with OxMaint reduces total cost
How OxMaint Tracks Every Dollar of Downtime Cost
Step 1
Stoppage Capture
Every equipment stoppage is logged against the asset record with timestamp, fault type, and production line impact. OxMaint captures stoppages from technician mobile input, sensor alerts, or manual production log — no stoppage goes unrecorded.
Step 2
Multi-Layer Cost Assignment
For each stoppage event, OxMaint calculates production loss (line rate × stoppage duration × product margin), idle labour cost, material scrap value, and emergency parts premium — giving you the full four-layer cost in one record.
Step 3
Work Order Cost Linkage
Every work order is linked to its corresponding stoppage event. Parts costs, labour hours, and contractor spend are assigned to the work order and roll up to the asset's total maintenance cost — making cost-per-asset reporting accurate and audit-ready.
Step 4
Trend Analytics and Reporting
OxMaint surfaces downtime cost trends by asset, by line, by fault category, and by time period. Maintenance leaders get a monthly report that shows cost trend, MTBF movement, PMP compliance, and predictive vs reactive spend ratio — all in one dashboard.
Step 5
ROI Reporting for Leadership
OxMaint generates the maintenance ROI report your plant manager and CFO need to see: investment made vs downtime cost averted vs prior period. When predictive maintenance prevents a $120K incident, that number appears in the ROI report — not just as a line item saved, but as a business outcome delivered.
Step 6
HACCP & Audit Documentation
In food manufacturing, downtime isn't just a cost event — it can be a compliance event. OxMaint links every stoppage to its maintenance response, with timestamped records, technician attribution, and corrective action documentation that HACCP audits and food safety certifications require.
Frequently Asked Questions
How do I calculate the real cost of downtime in my food manufacturing facility?
Start with your hourly production output value and apply a 2.4× multiplier to account for idle labour, material scrap, and customer impact beyond direct production loss. Industry data from Aberdeen Research and ABB benchmarks supports this multiplier for food and beverage facilities.
Sign in to OxMaint to have the platform calculate this automatically from your asset and production data.
What is a realistic ROI timeline for CMMS investment in food manufacturing?
Most food plants reach positive ROI within 60–90 days of going live. The software investment ($15K–$80K annually for most plant sizes) is typically recovered the moment a single major unplanned incident is avoided. At $30K+ per hour of downtime at a mid-sized facility, preventing one four-hour failure generates 6–10× the software cost in a single event.
Which maintenance KPIs are most important for food manufacturing maintenance leaders to track?
OEE, MTBF, MTTR, Planned Maintenance Percentage, maintenance cost as a percentage of RAV, and PM compliance rate are the six KPIs that together give a complete view of maintenance performance and financial impact. OxMaint tracks all six in real time and surfaces them in a single leadership dashboard — with trend data, not just point-in-time snapshots.
Book a demo to see the dashboard.
How does predictive maintenance reduce downtime in food manufacturing specifically?
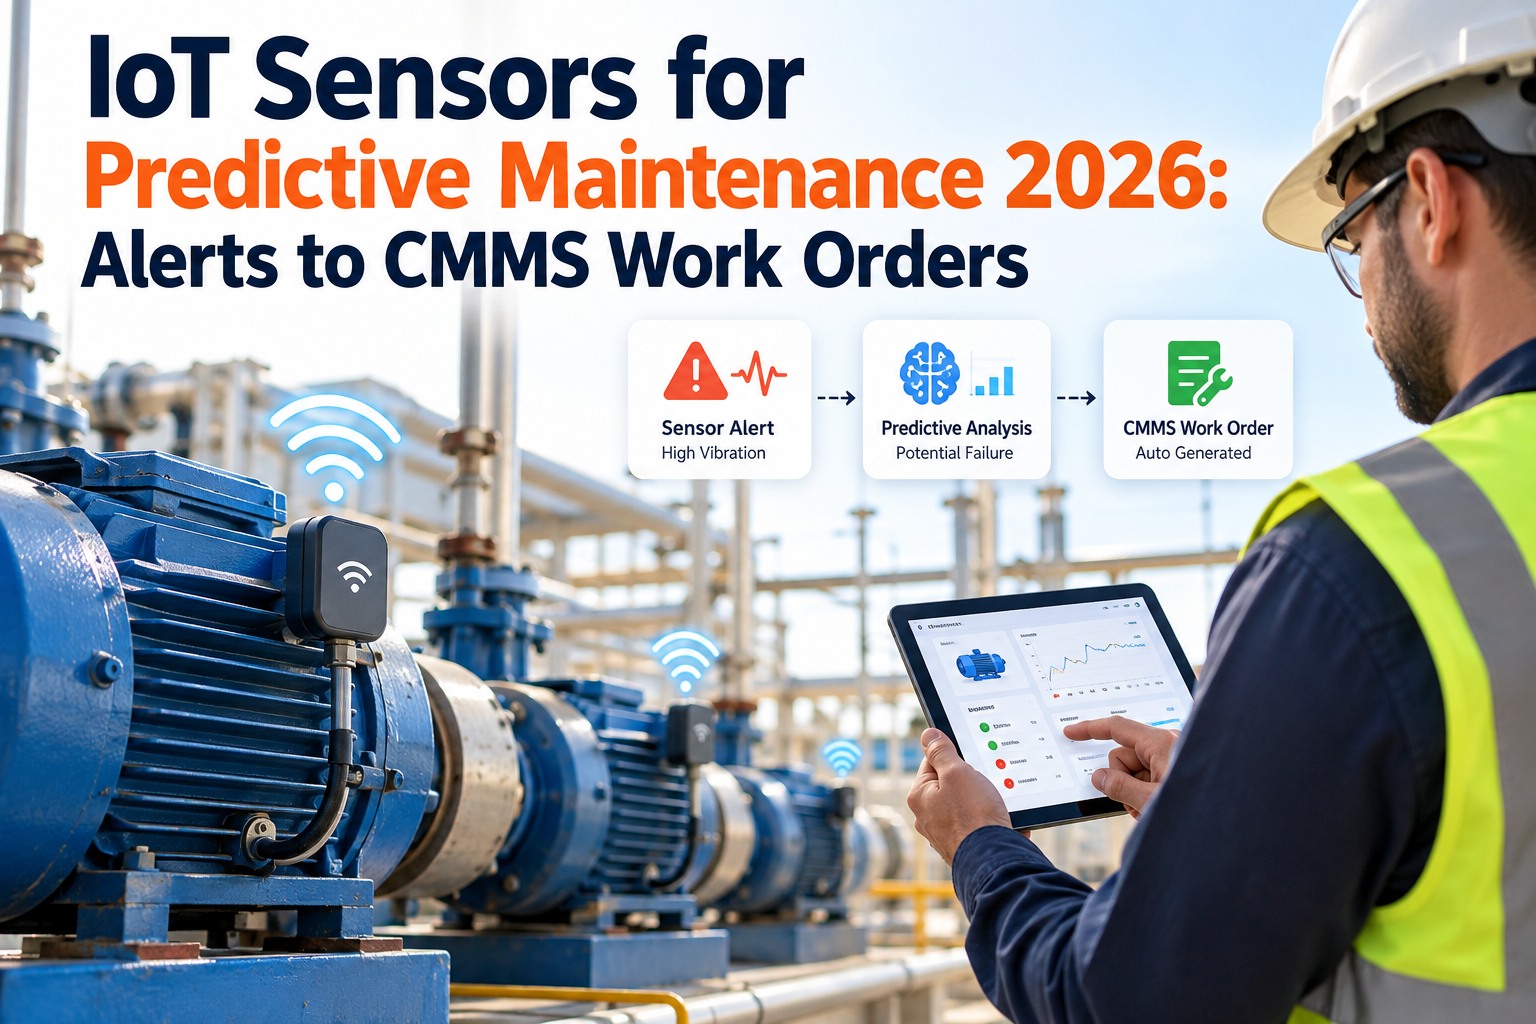
Predictive maintenance uses vibration, temperature, current draw, and runtime data to identify developing failures 7–21 days before they cause a stoppage — giving maintenance teams time to schedule repairs in planned windows rather than responding reactively. Research finds predictive maintenance cuts unplanned downtime by 70–89% in food manufacturing environments where continuous operation is critical.
Can OxMaint track downtime cost per product line, not just per asset?
Yes. OxMaint's cost tracking allows stoppage events and work orders to be assigned to specific production lines, departments, and asset groups — enabling cost reporting at any level of your facility hierarchy. Plant directors can see total downtime cost per product line per month, enabling capital prioritisation decisions based on actual financial impact rather than gut feel.
Your Maintenance ROI, Quantified
Know Exactly What Every Equipment Stop Is Costing You
OxMaint gives food manufacturing maintenance leaders the complete downtime cost picture — every stoppage, every cost layer, every asset — and the predictive tools to prevent the 74% of failures that don't have to happen. Start tracking, start preventing, start proving ROI.