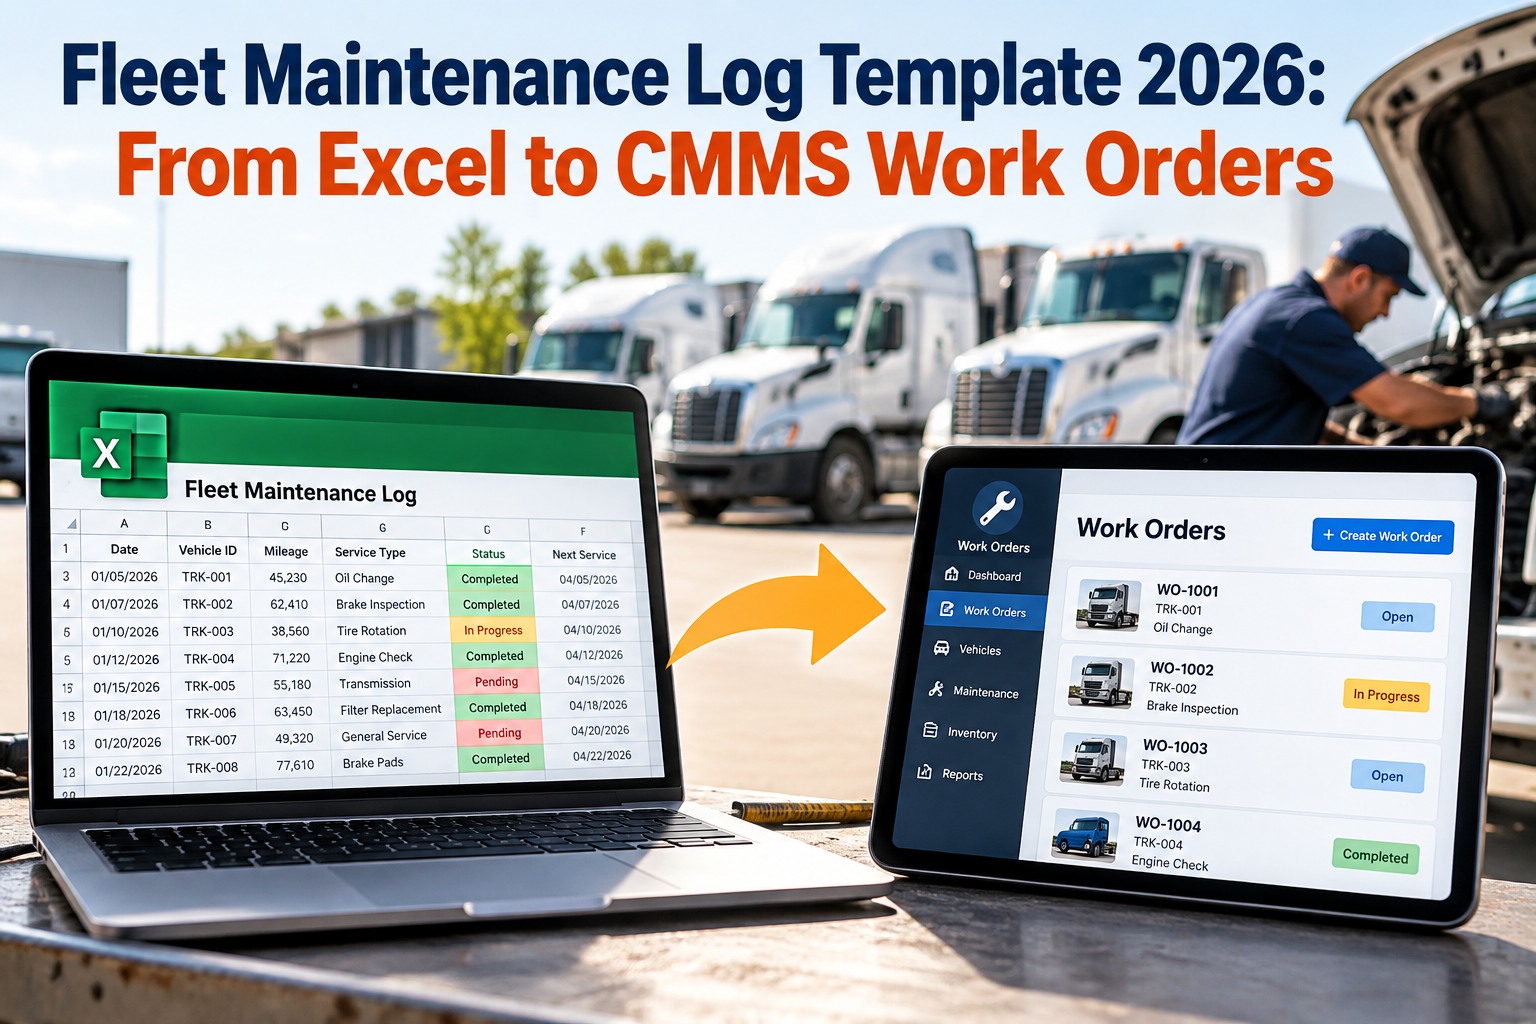
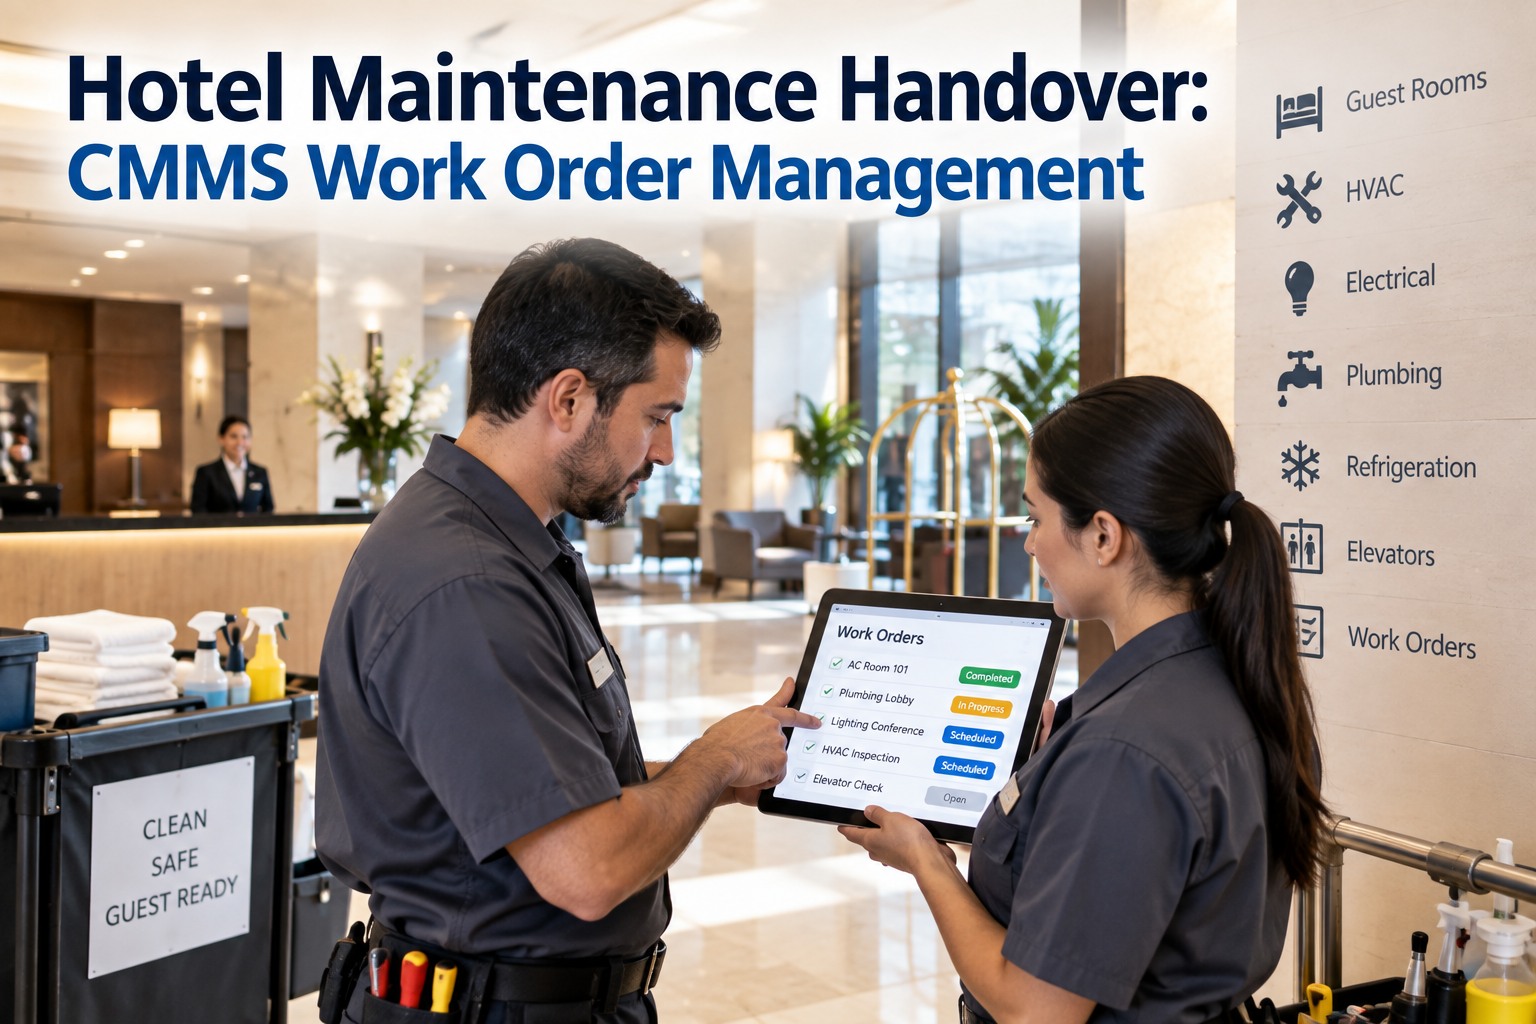
A fleet is either run on a calendar or run on a phone call. Preventive maintenance is a planned swap of a belt, a filter or a fluid during a scheduled shop visit; corrective maintenance is the same part failing on the roadside at 2 AM for four times the cost. Every fleet does both — the question is the ratio. OXMAINT AI is the AI-powered CMMS and maintenance management software that moves fleets off the phone-call ratio by scheduling every PM, routing every defect to a work order and tracking every repair against the vehicle — so your 80:20 PM-to-corrective target stops being a slide and becomes the dashboard.
FLEET MAINTENANCE · PREVENTIVE vs CORRECTIVE · COMPARISON GUIDE 2026
Fleet Preventive Maintenance vs Corrective Maintenance: The Guide
A corrective-heavy fleet looks cheap on the maintenance line and ruinous on the operations line. A preventive-heavy fleet looks the opposite — and uptime, driver safety, resale value and insurance claims all shift accordingly. The OXMAINT AI maintenance management software holds every PM schedule, every DVIR defect and every repair against the vehicle, so the ratio you plan for is the ratio you actually run.
PREVENTIVE
Planned · Scheduled · In-shop
VS
CORRECTIVE
Reactive · Unplanned · Roadside
80:20
target PM-to-corrective work-order ratio for a mature, well-run commercial fleet
4-5×
typical cost multiplier of a reactive roadside repair over the same job planned in-shop
~50%
share of total maintenance spend absorbed by reactive work in corrective-heavy fleets
0
corrective jobs ever get cheaper than the preventive job that would have avoided them
The Full Side-by-Side: Nine Dimensions That Separate the Two
The usual comparison stops at "planned vs unplanned". The real differences are nine and they compound. OXMAINT AI holds the policy against each dimension per vehicle class, so the comparison stops being a slide and becomes an operating standard — schedule a walkthrough of the preventive workflow in OXMAINT AI.
Dimension
Preventive
Corrective
Trigger
Interval reached — mileage, hours or calendar
Failure, defect report or roadside breakdown
Timing
Scheduled into a planned shop window
Whenever the breakdown happens — often off-hours
Location
In-shop with lift, tools, parts and tech on duty
Roadside, mobile call-out, or tow-in
Cost per job
Baseline labor + part at list
4-5× baseline when tow, overtime & expedited parts are added
Downtime
Known — built into the schedule, no revenue loss
Unplanned — cancelled loads, missed SLAs, driver downtime
Parts
On-shelf; kitted to the work order ahead of time
Overnighted or sourced locally at a premium
Driver safety
Issues caught before they become hazards on the highway
Driver exposed to roadside breakdown risk — traffic, weather
Compliance
BIT / DOT inspections stay current; records build naturally
Lapsed inspections surface as DOT violations and CSA score hits
Data trail
Full PM history per vehicle — resale value and warranty intact
Patchy repair records — weak position at resale and in warranty claims
The Cost Curve: Why $1 in PM Beats $4 in Corrective
The oldest number in fleet maintenance is also the most consistently proven: every dollar invested in preventive maintenance avoids roughly four to five dollars of reactive repair, towing, lost revenue and premium parts. The gap is not a sales line — it is the physics of catching a worn brake pad in the shop at 10 AM versus replacing a cracked brake drum on the shoulder at 2 AM.
Same part, same vehicle — where the cost goes
Corrective · same bay, failed in service
Corrective · roadside call-out, overnight parts
Corrective · tow + weekend labor + cancelled load
The Fleet Maintenance Maturity Ladder
Fleets don't jump from reactive to predictive. They climb a five-step ladder — each step shifts the PM:CM ratio further toward planned work. OXMAINT AI holds the policy, cadence and work-order workflow for each step, so moving up is a configuration change, not a re-implementation.
LEVEL 5
Predictive
Condition sensors (tire pressure, oil, telematics fault codes) trigger PMs ahead of failure. PM:CM > 85:15.
LEVEL 4
Scheduled + DVIR-driven
Full PM cadence by mileage/hours/calendar; daily DVIR defects routed to work orders. PM:CM 75-80:25-20.
LEVEL 3
Scheduled
PM cadence is written, mostly followed; DVIR is paper and inconsistently acted on. PM:CM 60:40.
LEVEL 2
Mostly Corrective
PM happens inconsistently when the shop has slack; most work is defect-driven. PM:CM 30-40:60-70.
LEVEL 1
Reactive Only
The fleet runs until something breaks. PM is a word on a slide. PM:CM < 20:80.
The Ratio You Operate at Is the Ratio You Measure.
A fleet without a per-vehicle PM schedule, a DVIR-to-work-order loop, and a live PM:CM ratio on the dashboard will land at Level 2 by default. The OXMAINT AI maintenance management software is built to run every rung of the ladder — so moving from Level 2 to Level 4 is a quarter, not a rebuild.
The One Breakdown That Cascades: Why Corrective Compounds
A single reactive event is rarely a single cost. One roadside breakdown pulls in six downstream costs that never appear on the maintenance line. This is the mechanism behind the 4-5× multiplier — and the reason PM savings compound faster than they look.
1
The failure
Part fails in service. Direct part cost: baseline.
→
2
The tow
Vehicle moved from roadside to shop. Direct cost + driver time.
→
3
The part
Overnight shipping to the nearest shop. Premium over on-shelf.
→
4
The labor
Overtime or weekend rate; tech pulled off scheduled work.
→
5
The load
Cancelled delivery, missed SLA, substitute tractor, customer credit.
→
6
The record
DOT exposure if the failure was inspection-flagged; CSA score hit.
The Preventive Policy Checklist — What a Level 4 Fleet Actually Has
Climbing from Level 2 to Level 4 isn't a culture change; it is a set of controls. Walk this checklist — every unchecked item is a slow leak back toward reactive maintenance. OXMAINT AI holds each one as an auditable configuration against the fleet.
When Corrective Is the Right Choice
Not every asset belongs on a preventive schedule. The right answer for low-impact, cheap-to-replace components is often run-to-failure — and a mature fleet picks that deliberately, not by accident. OXMAINT AI lets you tag an asset or component as run-to-failure so it stays off the PM schedule without becoming an audit gap.
CHEAP & QUICK
A part that fails cheaply, is in stock, and is swapped in minutes with no safety or compliance exposure — PM overhead costs more than the failure.
REDUNDANT
Component with full redundancy on the vehicle or in the fleet — failure doesn't take the vehicle out of service.
UNPREDICTABLE WEAR
Component with no useful wear curve — PM intervals miss failures and swap good parts; monitoring beats scheduling.
COSMETIC / NON-SAFETY
Items with no safety, compliance or operational impact — interior trim, non-structural covers — fix on demand.
How the OXMAINT AI Software Shifts the Ratio
Every control above — the PM cadence, the DVIR loop, the maturity ladder, the PM:CM dashboard — is a feature the OXMAINT AI maintenance management software was built to run on commercial fleets. One system from Level 2 reactive to Level 4 scheduled, and on to Level 5 predictive — spin up a free account and set up your PM cadence in OXMAINT AI.
Per-Vehicle PM Scheduler
Mileage, engine-hours and calendar triggers held per vehicle — the first threshold to hit opens the PM work order automatically.
Mobile DVIR & Defect Loop
Drivers file DVIR from a phone; defects land as prioritized work orders with photos attached, routed to the right tech by end-of-shift.
Parts & Kit Readiness
OXMAINT AI holds PM parts kits and shop stock levels — a PM work order lands with its parts list already reserved.
Repeat-Defect Flagging
Same issue, same vehicle, twice: the system flags it as a repeat and raises a root-cause review ticket instead of a third repair.
PM:CM Ratio Dashboard
The core preventive-vs-corrective KPI tracked by vehicle, terminal and fleet — the number that tells you which level of the ladder you are actually on.
Compliance Records Retained
BIT, DOT 396, state annuals and warranty service history timestamped per vehicle — audits and resale become a search, not a scramble.
Frequently Asked Questions
What is the right PM-to-corrective ratio for a commercial fleet?
80:20 is the long-standing industry benchmark for a well-run fleet — 80% of work orders planned, 20% corrective. Fleets below 60:40 are leaking money to roadside repairs, premium parts and lost loads. OXMAINT AI tracks the ratio by vehicle and terminal as a core KPI.
Start free and see your PM:CM ratio in OXMAINT AI.
Isn't preventive maintenance just planned over-servicing?
Only when PM intervals are copy-pasted from the OEM manual without adjusting for duty cycle. Severe-service fleets need tighter intervals; light-duty fleets can extend them. OXMAINT AI holds the policy per vehicle class so intervals match actual use.
How does DVIR fit the preventive strategy?
DVIR is the single most important corrective-to-preventive bridge in a fleet. A defect caught on a daily inspection and routed to the next scheduled shop visit is preventive by effect. OXMAINT AI runs the mobile DVIR workflow and the defect-to-work-order loop on the same platform.
Can every asset be on a PM schedule?
No, and shouldn't be. Low-impact components with no safety or compliance exposure are often run-to-failure by design. OXMAINT AI lets you tag assets as run-to-failure so they stay off the PM schedule without becoming an audit gap.
How quickly can we shift the ratio once we start?
Most fleets move 10-15 points on the PM:CM ratio in the first quarter after implementing a per-vehicle PM scheduler and DVIR-to-work-order loop. Larger shifts take 6-12 months as parts planning, shop capacity and driver habits catch up.
Pick the Ratio You Want to Operate At.
Put every vehicle on a per-asset PM schedule, every DVIR defect on a routed work order, and the PM:CM ratio on the dashboard — all on the OXMAINT AI maintenance management software. The fleet that runs on a calendar wins the fleet that runs on a phone call every quarter.