Failure codes are one of the most powerful reliability tools in any CMMS — and one of the most abandoned. 58% of maintenance teams that implement failure codes stop using them within 6 months because technicians find them too complex, too time-consuming, or too disconnected from how they actually describe problems. The issue is not the concept — it is the implementation. A failure code system with 400 codes, three mandatory hierarchy levels, and no mobile optimization adds 3-5 minutes per work order closure. Multiply that across 25 work orders per day and you have lost over two hours of wrench time to data entry. Oxmaint uses a streamlined, searchable failure code structure with mobile-optimized selection, smart defaults based on asset type, and trend analytics that turn those codes into actionable reliability insights. If your failure codes are either unused or unusable, start a free trial or book a demo to see how failure coding should work in practice.
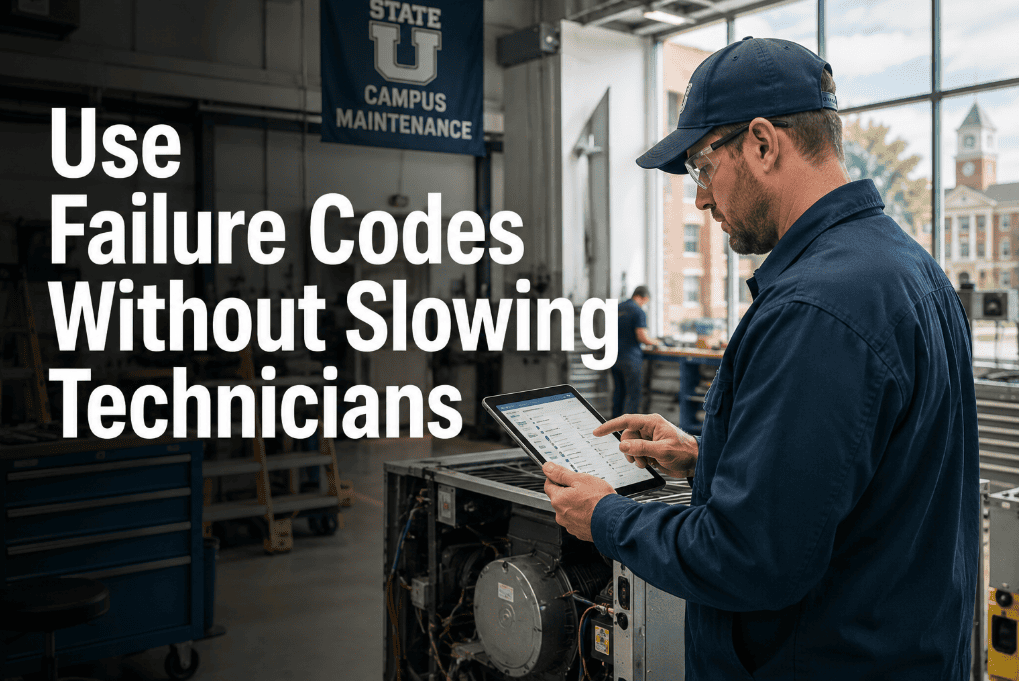
How to Use Failure Codes Without Slowing Technicians Down
58% of teams abandon failure codes within 6 months. Not because the concept is wrong — because the implementation adds friction instead of value. Streamlined codes, mobile selection, and smart defaults change that equation.
Failure Codes Only Work If Technicians Actually Use Them
The best failure code system in the world is useless if 60% of your work orders have "Other" selected or the field left blank. The goal is not comprehensive taxonomic coverage — it is consistent, usable coding that produces trend data within 90 days. Oxmaint keeps failure codes simple, searchable, and asset-type-specific so technicians select the right code in under 10 seconds. See the difference — start a free trial or book a demo to configure failure codes for your operation.
The Three-Layer Failure Code Structure That Technicians Will Use
Effective failure coding uses three layers — Problem, Cause, and Action — each with a short, plain-language list. The key principle: no layer should have more than 15-20 options. Anything beyond that creates scroll fatigue on mobile devices and drives technicians to select "Other" or skip the field entirely.
The observable symptom: Leak, Noise, Vibration, Overheating, No Output, Intermittent Operation, Structural Damage, Calibration Drift. Keep this list to 10-15 items. The problem code answers: "What did the technician observe when they arrived?"
The root cause: Wear, Contamination, Electrical Fault, Misalignment, Lubrication Failure, Corrosion, Operator Error, Design Deficiency. Cause codes answer: "What underlying condition created the problem?" This layer drives the highest-value reliability analysis.
The corrective action: Replaced, Repaired, Adjusted, Cleaned, Lubricated, Calibrated, Temporary Fix, No Action Required. Action codes answer: "What did the technician do to resolve it?" This layer tracks repair patterns and parts consumption trends.
Pumps fail differently than HVAC units. Oxmaint pre-filters failure code options based on the asset type on the work order. A pump work order shows pump-relevant codes. An AHU work order shows HVAC codes. This eliminates 70% of irrelevant options and speeds selection to under 10 seconds.
Why Failure Code Programs Fail
Organizations that launch with 200-400 failure codes see adoption rates below 35% within 3 months. Technicians cannot find the right code, so they select the first thing that seems close — or skip the field. Data quality collapses, and the reliability team stops trusting the output. 40-60 total codes across all three layers is the optimal range for most operations.
Scrolling through a dropdown list of 80 codes on a 6-inch phone screen with greasy gloves is not a realistic expectation. 72% of work order closures now happen on mobile devices. If the failure code interface is not designed for thumb-based, one-hand selection with large tap targets, technicians will not use it.
"Thermodynamic efficiency degradation" means nothing to a technician who describes the same condition as "not cooling." Failure codes must use the language technicians actually speak. If the code label does not match how a tech would describe the problem verbally, it will never be selected accurately.
Technicians code failures for months and never see what happens with the data. No trend reports, no "top 5 failure causes this quarter," no evidence that their input changed anything. Without a visible feedback loop, coding feels like pointless paperwork. Sharing monthly failure trends with the team increases coding accuracy by 38%.
How Oxmaint Makes Failure Codes Fast and Useful
Oxmaint designs failure coding for the technician first and the reliability analyst second. If the technician cannot select the right code in 10 seconds on a phone, the system has failed — regardless of how elegant the taxonomy looks on paper. Teams ready to build a failure code system that actually gets used can start a free trial or book a demo.
A pump work order shows pump failure codes. An elevator work order shows elevator codes. The technician sees 8-12 relevant options instead of 60 generic ones. Selection time drops to under 10 seconds.
Big buttons, search-as-you-type, and recently-used codes at the top. Designed for gloved hands on a phone screen, not for mouse clicks on a desktop monitor in an office.
"Leak," "Noise," "Won't Start," "Overheating" — not "Hydraulic Integrity Compromise" or "Thermal Management Deficiency." Codes match how techs describe problems verbally.
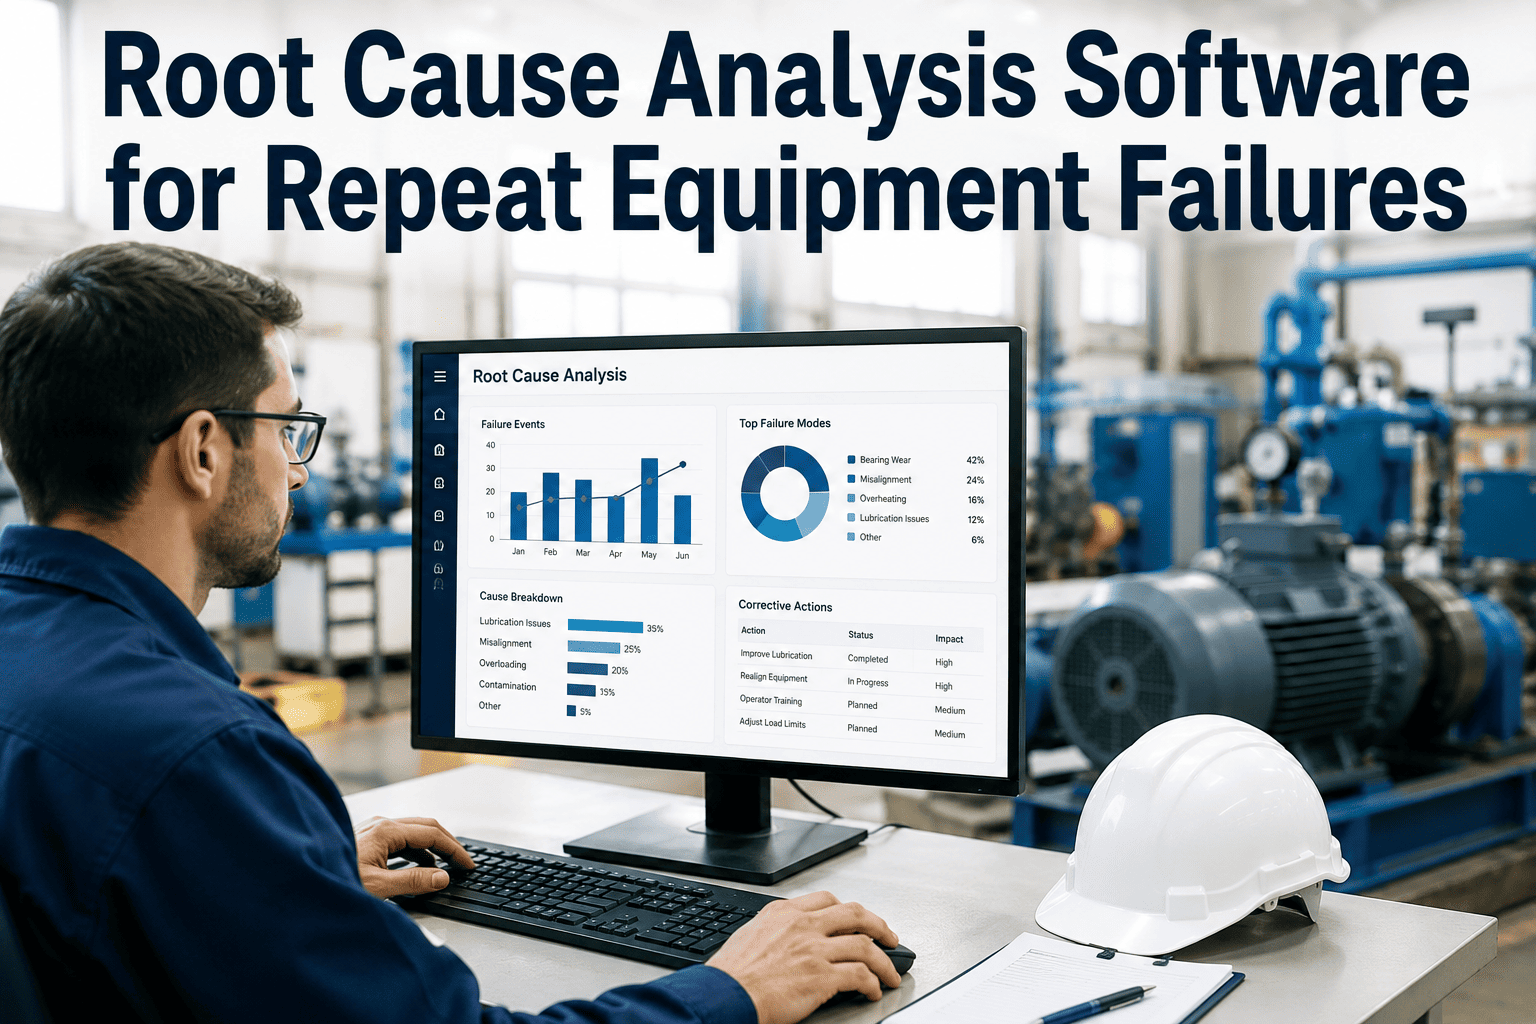
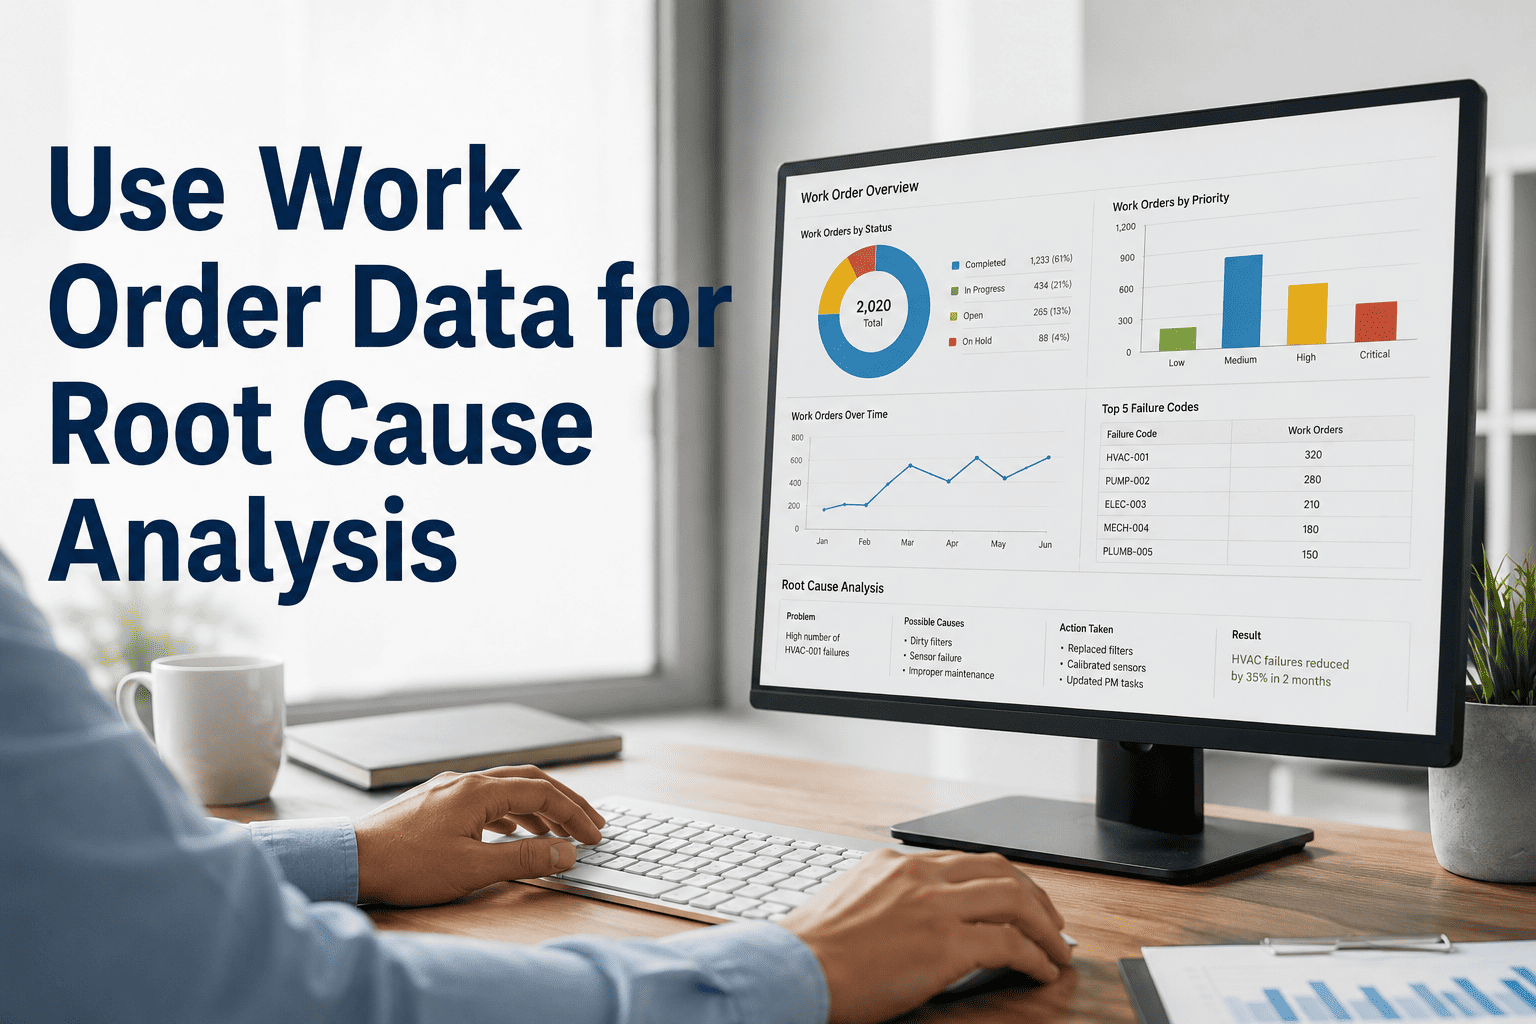
Automatic Pareto charts showing which failure causes are driving the most downtime and cost. Data becomes actionable within 90 days of consistent coding — visible to technicians and managers alike.
Maintenance managers can adjust the code list as operations evolve — no vendor ticket, no IT department involvement, no 6-week change request process.
Monthly failure trend summaries shared with the team: "Bearing wear caused 34% of pump failures this quarter — PM interval adjusted." Technicians see their input driving real decisions.
Overcomplicated Failure Codes vs. Oxmaint Streamlined Coding
What Streamlined Failure Codes Deliver
Compared to 35% with overcomplicated systems — achieved through mobile optimization and asset-type filtering
Down from 3-5 minutes with generic dropdown lists — zero wrench time lost to data entry friction
Pattern detection through coded trend data reveals failure causes invisible in free-text work order notes
Consistent coding produces statistically meaningful trend data within one quarter — enabling PM interval adjustments
Frequently Asked Questions
Should failure codes be mandatory on every work order?+
How do we decide which failure codes to include?+
Can Oxmaint generate Pareto charts from failure code data?+
How do we handle technicians who resist using failure codes?+
Failure Codes That Technicians Use and Reliability Engineers Trust
40-60 codes. Three layers. Mobile-first selection. Asset-type filtering. Trend analytics in 90 days. Oxmaint makes failure coding a 10-second task that produces data worth acting on.