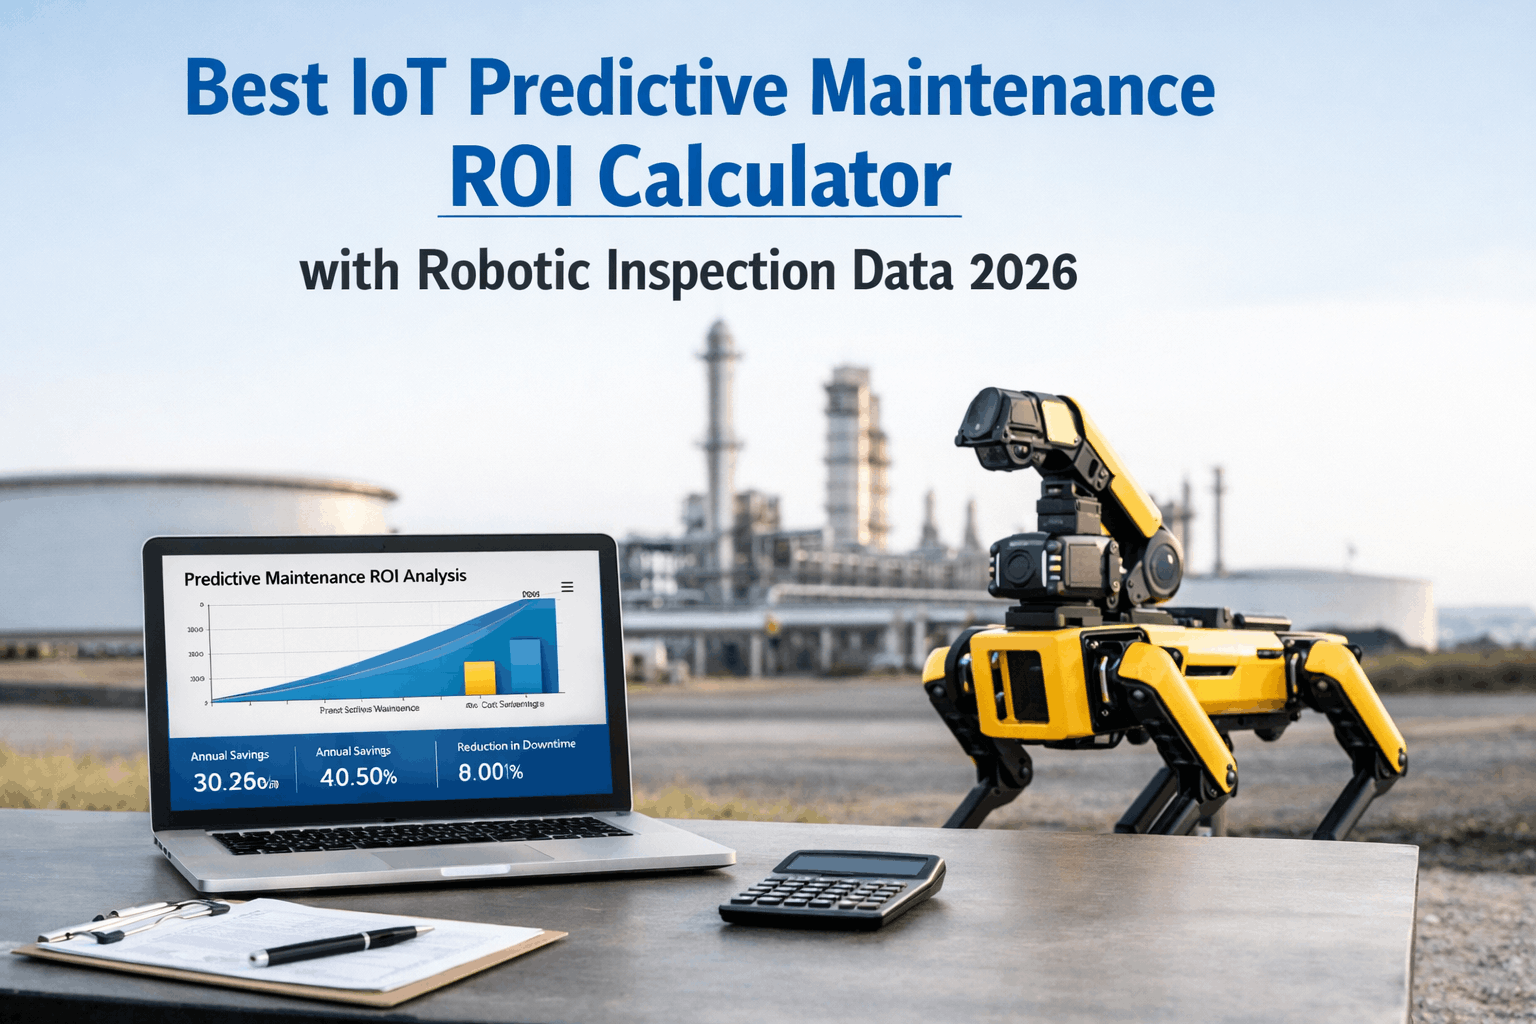
When the CFO asks "What's the actual return on all those sensors we installed?" and the maintenance director can only offer vague estimates about "fewer breakdowns"—the investment case collapses. The truth is, most organizations deploy IoT predictive maintenance without a rigorous financial framework, making it impossible to prove value or justify expansion. Add robotic inspection data—drones surveying tanks, crawlers inside pipelines, autonomous visual scanners on production lines—and the data volume explodes, but the financial clarity doesn't follow. The organizations winning the predictive maintenance game aren't just collecting data; they're converting every sensor reading and robotic inspection finding into a dollar figure through a structured ROI engine integrated with their CMMS.
This guide provides maintenance directors, reliability engineers, and financial controllers with a comprehensive framework for calculating and maximizing IoT predictive maintenance ROI—including the often-overlooked value of robotic inspection data—in 2026. We cover the complete lifecycle from cost baselining and savings attribution to real-time financial dashboards and continuous ROI optimization. Teams ready to prove the financial value of their predictive programs can start their free trial today.
Average ROI on IoT predictive maintenance programs with robotic inspection
Of organizations cannot quantify IoT maintenance savings accurately
Average annual savings for mid-size plants with integrated ROI tracking
From Gut Feeling to Financial Proof
Effective ROI calculation for predictive maintenance is not about cherry-picking success stories; it's about building a systematic financial model that captures every avoided failure, every optimized inspection route, and every hour of prevented downtime. The challenge compounds when robotic inspection data enters the equation—drones, crawlers, and autonomous visual systems generate findings that must be translated into risk-adjusted dollar values. A CMMS with integrated financial analytics becomes the bridge between sensor signals and boardroom decisions.
CMMS ROI EngineFinancial Core
IoT Sensor Layer
Vibration, Thermal, Current
Robotic Inspections
Drones, Crawlers, Vision AI
Cost Baselines
Historical Failure Costs
Savings Attribution
Avoided Costs, Labor Savings
Risk Valuation
Probability × Impact Models
Executive Dashboards
Real-Time ROI, Trend Reports
The core of a defensible ROI model is traceability. Every prediction that leads to a planned repair—instead of an emergency breakdown—must be logged with the associated cost avoidance. When a drone inspection catches corrosion that would have caused a $200K tank failure, that finding must flow from the inspection report through the work order and into the financial ledger automatically. Book a demo to see ROI tracking in action.
Building Your ROI Model — A Maturity Framework
Calculating predictive maintenance ROI isn't a one-time spreadsheet exercise. It requires a progressive approach to financial maturity—from basic cost tracking through risk-adjusted valuation to real-time ROI dashboards that update with every work order closure. The following framework outlines the essential capabilities for world-class maintenance financial management.
HIGHFinancial AccuracyLOW
PREDICTIVE ROI
Real-Time ROI DashboardsRisk-Adjusted ValuationRobotic Inspection Cost ModelsAutomated Savings Attribution
Boardroom-Ready Financial Proof
STRUCTURED TRACKING
Cost-Per-Asset TrackingDowntime Cost CalculationsWork Order Cost CaptureMonthly Savings Reports
Defensible Cost Avoidance Data
BASIC ACCOUNTING
Maintenance Budget vs. ActualVendor Invoice TrackingSimple Failure CountsQuarterly Estimates
Directional Awareness Only
BLIND SPENDING
Lump-Sum Maintenance BudgetNo Cost-Per-Failure DataAnecdotal JustificationsNo Savings Measurement
Cannot Justify Investment
LOWData IntegrationHIGH
The ROI Calculation Lifecycle
Building a credible ROI model follows a structured lifecycle—from establishing cost baselines through deploying sensors and robots, measuring outcomes, and continuously refining the financial model. Each phase builds the evidentiary foundation needed to expand the program and secure ongoing investment from leadership.
Weeks 1-4
Historical failure cost analysis
Asset criticality ranking
Baseline KPI establishment
Baselining Phase
Weeks 5-10
IoT sensor deployment
Robotic inspection scheduling
Cost-capture workflow design
Instrumentation Phase
Weeks 11-20
First predictions & interventions
Cost avoidance logging
Robotic finding valuation
Preliminary ROI report
Measurement Phase
Month 6+
Live ROI dashboards
Program expansion decisions
Model refinement
Executive reporting
Optimization Phase
Prove Your Predictive Maintenance ROI
See how Oxmaint's integrated financial analytics turn every IoT sensor reading and robotic inspection finding into a traceable dollar value—giving you the evidence to justify and expand your program.
The Five ROI Pillars: Where the Money Lives
Predictive maintenance ROI comes from five distinct value streams. Most organizations only measure one or two—typically "avoided downtime"—and miss the majority of their financial impact. A comprehensive CMMS captures all five pillars automatically, building a complete picture that stands up to CFO scrutiny and board-level review. Schedule a demo to see all five pillars tracked in real time.
Production hours saved × hourly revenue loss rate
Planned vs. emergency labor rate differential
Reduced expedited shipping + optimized stock levels
Risk-valued findings from drones, crawlers, and vision AI
Deferred CAPEX from extended equipment lifespan
All savings ÷ total program investment (rolling 12 mo.)
Expert Review: The Case for Integrated ROI Tracking
"
For three years we ran a predictive maintenance program that everyone 'felt' was working, but we couldn't prove it to finance. Our sensor data lived in one system, robotic inspection reports sat in PDF folders, and work orders were in the CMMS—none of them connected financially. When we unified everything under a single ROI framework, the numbers shocked us. We were avoiding $2.4 million in annual failures but only tracking $600K. The drone inspection program alone was preventing three major tank integrity events per year worth $180K each. Once we showed the CFO real numbers with audit trails, our budget for next year's expansion was approved in one meeting.
— VP of Reliability Engineering, Petrochemical Facility
$2.4M
Annually avoided failure costs once fully tracked
4x
More savings discovered than originally estimated
1 Day
Budget approval time with auditable ROI data
The organizations that consistently expand their predictive maintenance programs share one trait: they can prove every dollar saved. By integrating IoT sensor alerts, robotic inspection findings, and work order cost data into a unified CMMS financial engine, these teams turn maintenance from a cost center into a demonstrated profit protector. Sign up for Oxmaint to start building your ROI evidence base.
Conclusion: From Sensors to Savings Proof
The gap between "we think predictive maintenance is working" and "here's the auditable financial proof" is the gap between programs that stagnate and programs that scale. Every IoT sensor reading, every robotic inspection finding, and every predicted failure that leads to a planned repair represents quantifiable financial value—but only if your systems capture it.
Stop guessing at ROI. Build the financial framework that turns your maintenance data into the most compelling business case in the building. When the CFO asks "what are we getting for all these sensors?", your answer should be a real-time dashboard, not a shrug.
Ready to Prove Your Maintenance ROI?
Discover how Oxmaint connects IoT predictions, robotic inspection data, and work order costs into a single ROI engine—giving you the financial proof to protect budgets and expand programs.
Frequently Asked Questions
How do you calculate "avoided cost" for a failure that never happened?
Avoided cost is calculated by establishing a baseline: the historical average cost of the type of failure that was predicted and prevented. For example, if your facility historically experiences 4 compressor failures per year at $120K each, and IoT sensors predict and prevent 3 of them, the avoided cost is $360K. The key is rigorous historical cost data per failure mode—which is why CMMS cost-capture at the work order level is essential. Each prediction-to-intervention chain creates an auditable savings record.
How do robotic inspections factor into the ROI calculation?
Robotic inspections generate findings (corrosion, cracks, heat anomalies, leaks) that are valued using a risk matrix: probability of failure × consequence cost. A drone that spots 15% wall thinning on a storage tank isn't just an inspection finding—it's a risk-valued data point. If that tank's catastrophic failure would cost $500K, and the probability was 30% within 12 months, the risk-adjusted value of that finding is $150K. This methodology turns every robotic inspection report into a financial document.
What data does the CMMS need to capture for accurate ROI tracking?
Five data elements are critical: (1) Total cost per work order (labor, parts, contractors, downtime), (2) Whether the work order was generated by a prediction vs. reactive, (3) The specific sensor or inspection finding that triggered it, (4) The estimated cost of the failure had it not been prevented, and (5) Actual repair cost vs. estimated emergency repair cost. With these five fields populated consistently, the CMMS can automatically calculate cost avoidance, labor savings, and program ROI in real time.
What is a realistic ROI timeline for IoT predictive maintenance?
Most programs achieve measurable positive ROI within 6-9 months of deployment. The first 90 days are typically spent establishing baselines and collecting initial data. Months 4-6 produce the first wave of successful predictions and avoided failures. By month 9, most organizations have sufficient data for a statistically defensible ROI calculation. Programs that include robotic inspection data often see faster ROI because robotic findings tend to catch high-consequence issues (structural, tank integrity) with very high per-event value.
Can we retroactively calculate ROI if we didn't track costs from the start?
Yes, but with caveats. You can use industry benchmarks and historical maintenance records to reconstruct baseline failure costs. Insurance claims, emergency purchase orders, and overtime records are valuable proxies. However, retroactive calculations are inherently less defensible than prospective tracking. The best approach is to establish rigorous cost capture now—even if your first ROI report is modest, it becomes the foundation for increasingly accurate and compelling financial proof over subsequent quarters.