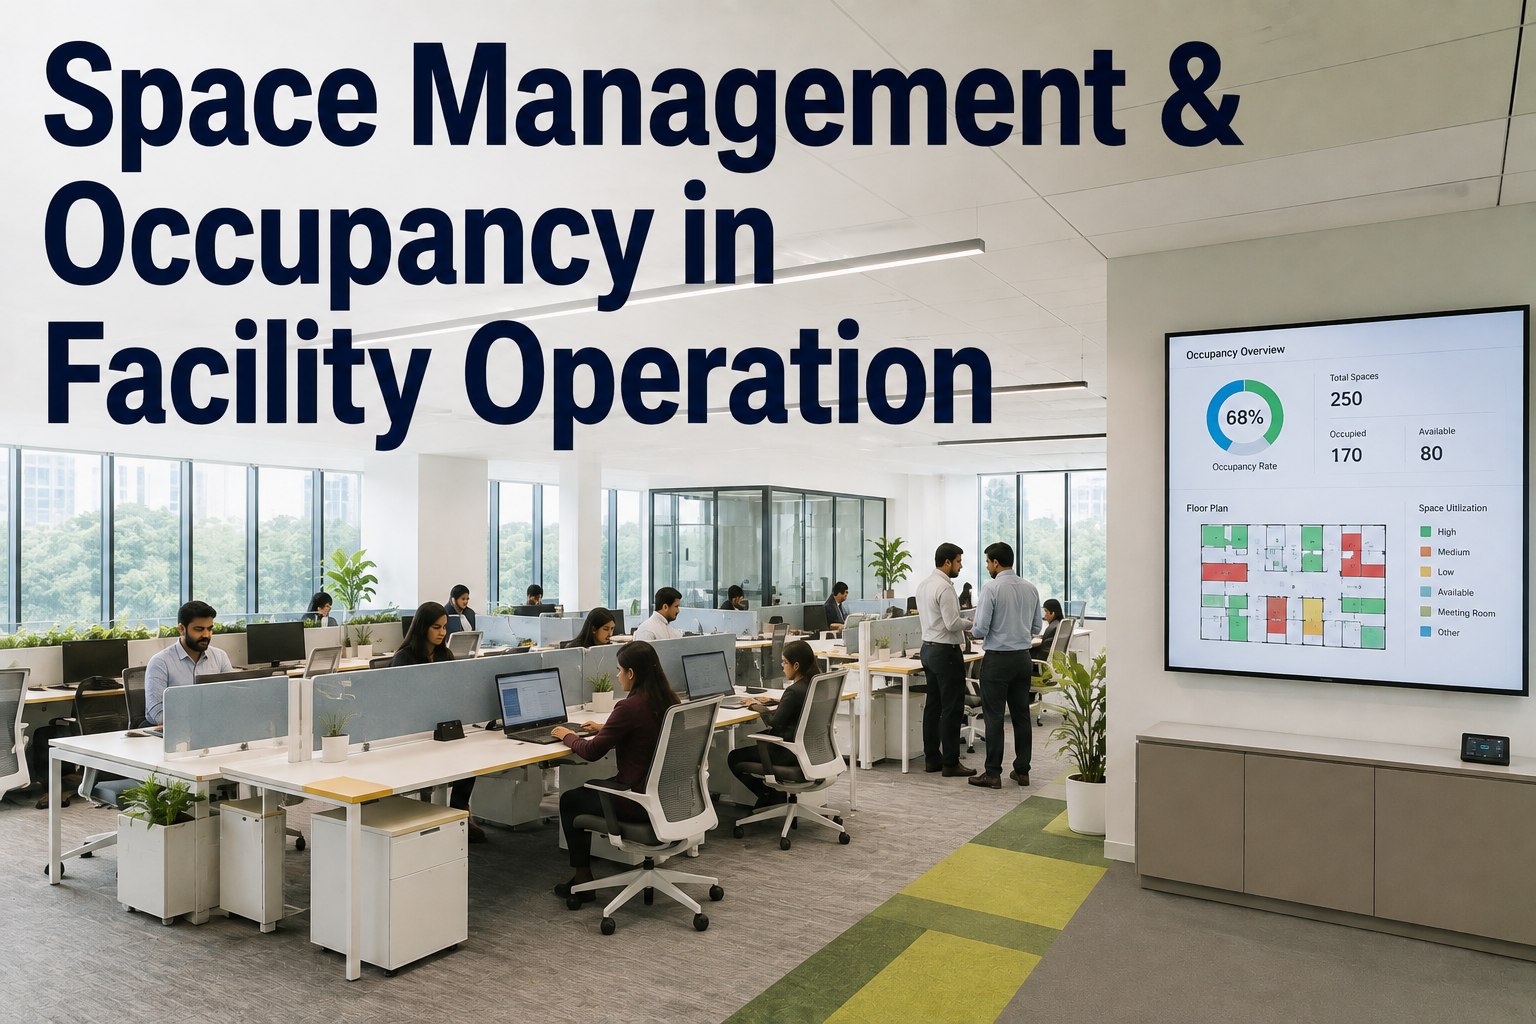
Space management and occupancy data now drive every decision in modern facility operations — from how often a conference room HVAC filter is changed to how much square footage a department is charged back each quarter. With hybrid work models leaving 30–50% of desks empty on any given day, building occupancy patterns have shifted so dramatically that static maintenance schedules and fixed service contracts are bleeding maintenance budgets. Facility space management is no longer just a real-estate concern; it is a maintenance and reliability problem that demands occupancy-driven scheduling, real-time space utilization data, and a CMMS that connects workplace occupancy directly to work-order execution. OxMaint brings space data integration, occupancy-driven maintenance scheduling, and chargeback workflow into one AI-powered platform — and you can Start Free Trial to see it on your portfolio today.
Every Underutilized Square Foot Is Recoverable Maintenance Budget
Building occupancy dropped 40–60% post-pandemic, yet preventive maintenance cycles, cleaning routes, and HVAC run-times never adjusted. OxMaint connects space utilization data to your CMMS so facility teams right-size services, schedule maintenance by actual usage, and charge back costs with audit-ready precision.
Why Building Occupancy Data Is Now a Maintenance Operations Problem
Pre-2020, a 200,000 sq ft corporate campus ran at 85–92% capacity. Preventive maintenance schedules, custodial routes, and HVAC setpoints were all calibrated to that density. Today, the same building averages 38–55% workplace occupancy on any given day — yet most facility teams still service conference rooms, restrooms, and air handlers on fixed 30-day cycles regardless of whether anyone used the space.
Worked Example: A 180-Asset Corporate Campus
A 180-asset facility spending $42,000 annually on preventive maintenance discovered that 34% of scheduled PMs targeted zones operating below 20% utilization. By integrating occupancy sensors with their CMMS, they deferred non-critical maintenance on low-use floors, reduced filter and lamp replacements by 28%, and reallocated $11,800 per year — without a single comfort complaint or SLA breach. That is the power of occupancy-driven maintenance scheduling.
Where Facility Space Optimization Leaks Money Without Anyone Noticing
Facility space optimization fails silently. There is no alarm when a janitorial team services a restroom that had four visitors instead of forty, or when an AHU conditions an empty wing for 12 hours. These are the five most common leakage points — and each one maps directly to a CMMS workflow OxMaint can automate.
Fixed-Cycle PM on Low-Occupancy Zones
HVAC filters, belt inspections, and coil cleanings run on calendar intervals even when a floor is 15% occupied. OxMaint usage-triggered PMs defer or accelerate maintenance based on actual runtime hours pulled from occupancy data.
Over-Serviced Restrooms & Common Areas
Custodial teams service restrooms on a fixed route regardless of visitor count. Occupancy-triggered work orders in OxMaint generate cleaning tasks only when footfall thresholds are crossed, cutting labor 20–35%.
HVAC Conditioning Empty Space
Air handlers run 24/5 on BMS schedules that predate hybrid work. OxMaint integrates with BMS data to flag zones where conditioning continues despite zero occupancy, triggering adjustment work orders automatically.
No Chargeback Visibility
Without occupancy data tied to maintenance costs, facility teams cannot bill departments accurately. OxMaint chargeback workflows tie work-order labor and material costs to space utilization by department or floor.
Reactive Moves & Reallocation Chaos
When teams shift floors, asset records and PM schedules lag for weeks. OxMaint asset-tracking links equipment to physical zones, so a department move automatically reassigns maintenance responsibility and updates service-level targets.
Blind Spots in Space Planning
Facility space planning relies on annual walkthroughs instead of continuous data. OxMaint analytics dashboards surface utilization trends by week, floor, and zone so teams can consolidate, downsize, or repurpose space with evidence.
How Much Is Static Facility Space Management Costing You?
The math is straightforward. If a 250,000 sq ft facility runs at 45% average occupancy but maintains 100% of its space at full service levels, roughly 55% of preventive maintenance labor, custodial labor, and energy-aligned maintenance is effectively wasted on unoccupied zones. Here is a simplified payback model for a typical mid-size corporate facility.
Total Sq Ft × Vacancy % × $/Sq Ft Maintenance Cost = Annual Recoverable Spend
250,000 sq ft × 55% vacancy × $2.80/sq ft = $385,000 in potentially redirectable maintenance and service spend
OxMaint Occupancy Module Implementation Cost ÷ Year-One Recovered Spend = Payback Period
A typical $14K implementation ÷ $115,000 first-year savings (30% capture rate) = 1.5 months to full payback
| Maintenance Cost Category | Static (No Occupancy Data) | Occupancy-Driven (OxMaint) | Annual Savings |
|---|---|---|---|
| Preventive Maintenance Labor | $48,000 | $33,600 | $14,400 |
| Custodial & Janitorial Services | $62,000 | $41,000 | $21,000 |
| HVAC Maintenance & Filter Replacement | $18,500 | $12,200 | $6,300 |
| Spare Parts & Consumables (Low-Use Zones) | $9,800 | $5,900 | $3,900 |
| Energy-Linked Maintenance (AHU, Lighting) | $14,200 | $8,800 | $5,400 |
| Total Annual Cost | $152,500 | $101,500 | $51,000 |
Figures represent a 250,000 sq ft corporate facility at 45% average occupancy. Savings assume a 30–35% capture rate on recoverable spend — conservative versus industry benchmarks from IFMA and CoreNet Global studies.
See How OxMaint Turns Occupancy Data Into Maintenance Savings
Book a 30-minute demo and we will map your portfolio's utilization gaps to a custom occupancy-driven maintenance plan — live on your floor plans.
Occupancy-Driven Maintenance Scheduling Built Into Your CMMS
OxMaint is not a standalone space-management dashboard bolted onto a CMMS. It is a single AI-powered platform where occupancy data flows directly into work-order generation, preventive maintenance triggers, asset tracking, and chargeback reporting. Here is how four core capabilities map to your space management and facility operations challenges — and the measurable outcome each one delivers.
Space Data Integration
Ingest occupancy sensor data, badge-swipe counts, and desk-booking feeds directly into OxMaint. Every asset, zone, and floor is tagged with real-time utilization so maintenance decisions are always based on how space is actually used.
Occupancy-Triggered Work Orders
Instead of a fixed 30-day PM cycle, OxMaint generates work orders when a zone crosses a usage threshold — 500 restroom visits, 200 desk check-ins, or 1,000 AHU runtime hours. Maintenance happens when it is actually needed, not when a calendar says so.
Chargeback & Cost Allocation
OxMaint ties every work-order's labor hours, spare parts, and contractor costs to the zone and department occupying that space. Monthly chargeback reports are generated automatically — no spreadsheets, no manual allocation, no end-of-quarter surprises.
Space Utilization Analytics
Dashboards surface utilization by floor, zone, department, and time-of-day. Trend lines reveal which spaces are consistently over capacity (needing more frequent service) and which can be consolidated, repurposed, or removed from the maintenance footprint entirely.
From Occupancy Data to CMMS-Driven Space Management in 90 Days
Switching from static schedules to occupancy-driven facility space management does not require a rip-and-replace. OxMaint's phased rollout gets your first building live in 30 days and your full portfolio optimized within one quarter. Here is the month-by-month timeline.
Integrate Data Sources & Tag Assets
Connect OxMaint to your occupancy sensors, badge systems, and desk-booking platform. Import your asset register and tag every asset to a floor, zone, and department. Baseline current PM schedules and identify the top 20% of assets in low-occupancy zones.
Go-Live: First BuildingDeploy Occupancy-Triggered Work Orders
Replace fixed-cycle PMs on the top 50 low-utilization assets with usage-triggered work orders. Configure custodial routes to fire on footfall thresholds. Activate chargeback rules so labor and parts costs begin flowing to the correct department codes automatically.
First Savings RealizedOptimize & Scale Across Portfolio
Roll out to remaining buildings. Use OxMaint analytics to identify consolidation candidates, right-size service contracts, and present a data-backed space optimization plan to leadership. Quarterly reviews become automatic with scheduled utilization reports.
Full Portfolio OptimizedStatic Scheduling vs. Occupancy-Driven Facility Operations
| Facility Operations Dimension | Static CMMS Scheduling | OxMaint Occupancy-Driven |
|---|---|---|
| PM Trigger | Fixed calendar interval (30/60/90 days) | Usage threshold + runtime hours + condition data |
| Restroom & Common Area Servicing | Fixed custodial route, same frequency daily | Footfall-triggered work orders, variable frequency |
| HVAC Maintenance Alignment | Independent of BMS occupancy data | Integrated with BMS; AHU work orders adjust to zone density |
| Chargeback Accuracy | Manual spreadsheet allocation, 2-day reconciliation | Automatic per work-order, real-time department visibility |
| Space Consolidation Decisions | Annual walkthrough or lease-renewal triggered | Continuous analytics; flagged when utilization drops below threshold |
| Compliance & Audit Readiness | Paper logs, scattered spreadsheets | Digital trail: every PM tied to occupancy evidence, exportable in one click |
| Reactive Maintenance Volume | High — low-use assets still fail unexpectedly | 30–50% lower — predictive AI flags failures before they happen |
Facility Teams Recover Budget With OxMaint Occupancy Integration
"We were running PMs on three floors that had been at 12% occupancy for six months. OxMaint flagged it in the first week. We deferred 42 work orders, saved $8,200 in labor and parts that quarter, and reinvested it in our plant room upgrade. The chargeback module alone paid for the platform."
"Our custodial contractor was servicing restrooms on a fixed route regardless of traffic. We tied footfall sensors to OxMaint work orders and cut 22 labor hours per week. The vendor dashboard means we hold them accountable with data, not arguments."
Space Management & Occupancy in Facility Operations: Common Questions
What is occupancy-driven maintenance scheduling?
Occupancy-driven maintenance scheduling replaces fixed calendar-based PMs with work orders triggered by actual space usage data. Instead of servicing a conference room AHU every 30 days regardless of use, OxMaint generates the work order only when the zone crosses a defined utilization threshold — such as 500 occupancy hours or 200 booking events. This cuts maintenance labor 25–35% on low-occupancy zones while ensuring high-traffic areas receive more frequent service, not less.
How does facility occupancy tracking work with a CMMS?
Facility occupancy tracking feeds sensor counts, badge-swipe data, and desk-booking records into the CMMS, where each data point is mapped to a zone, floor, and asset. OxMaint ingests these feeds via API integration and uses them to trigger work orders, adjust PM frequency, and allocate costs. You can Book a Demo to see a live integration walkthrough on a real floor plan.
Can OxMaint handle chargebacks based on space utilization?
Yes. Every work order in OxMaint carries a zone and department tag. Labor hours, spare parts, and contractor costs are automatically allocated to the department occupying that space. Monthly chargeback reports are generated without manual reconciliation, giving finance teams an audit-ready breakdown of maintenance spend by occupant — typically produced in minutes versus the 1–2 days spreadsheet allocation takes.
How long does it take to implement occupancy-driven facility space management?
A single building can go live in 30 days: week one for data source integration, week two for asset tagging and zone mapping, week three for occupancy-triggered work-order configuration, and week four for go-live and baseline calibration. A full multi-building portfolio is typically optimized within 90 days. OxMaint's onboarding team handles data migration, sensor integration, and PM-schedule conversion so your technicians are not burdened with setup.
What occupancy data sources does OxMaint integrate with?
OxMaint integrates with IR occupancy sensors, badge/access control systems (Lenel, AMAG, HID), desk-booking platforms (Robin, Teem, SpaceIQ), and BMS platforms (Johnson Controls, Siemens, Honeywell, Tridium Niagara). If your sensor or system exposes an API or can export CSV data, OxMaint can ingest it. You can Start Free Trial to test integration with your specific stack.
Stop Maintaining Empty Space. Start Optimizing What You Actually Use.
Book a 30-minute demo and we will show you exactly how OxMaint connects your occupancy data to maintenance execution — live on your floor plans, your assets, and your work-order history.
Free 14-day trial · No credit card



.png)

