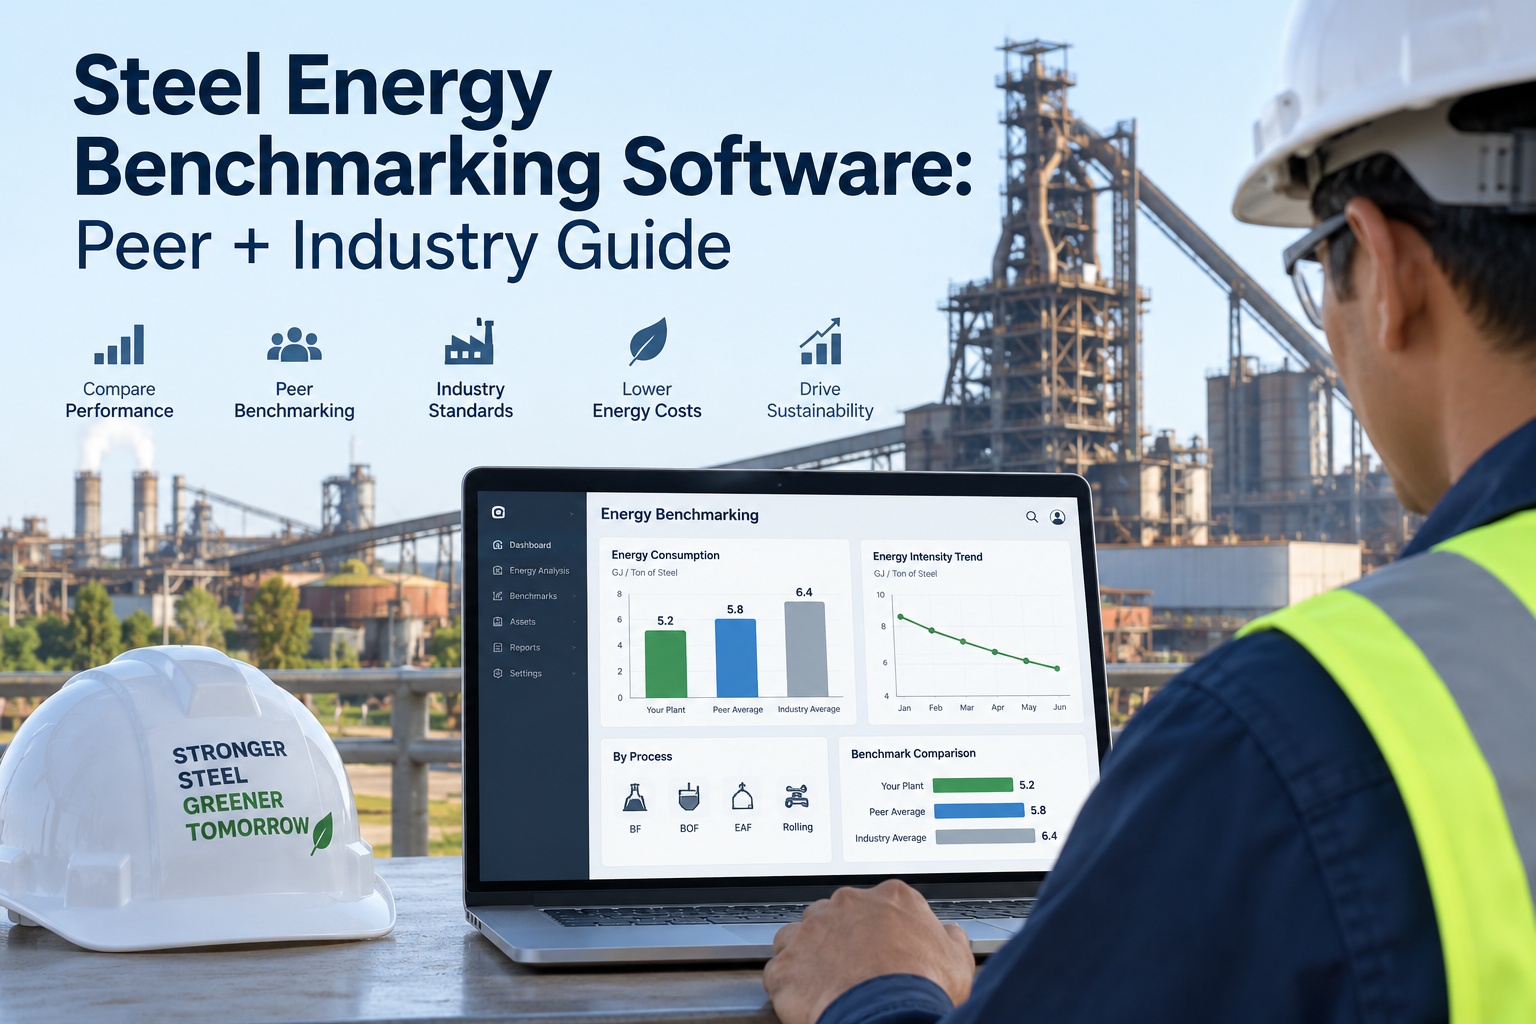
A steel plant's energy intensity is its most-watched number after safety and yield and the plants that defend it treat benchmarking as a monthly discipline, not an annual report. This guide covers steel energy benchmarking with a CMMS: where the integrated (BF-BOF) and electric-arc (EAF) routes sit against real intensity bands, how to position a site against both its own history and its peer group, and how the work-order data already in your maintenance system becomes the benchmark you defend. Start free on OxMaint to set your baselines, or book a demo.
BF-BOF · EAF · Peer + Industry Benchmarking
Steel Energy Benchmarking Software
Position every furnace against its route's intensity band and its peer percentile — then hold the gap closed with CMMS-driven maintenance.
~21
GJ/t global average steelmaking energy intensity — down 58% since the 1960s
400–600
kWh/t typical process-energy band for the integrated BF-BOF route
400–450
kWh/t total electricity best-practice band for a scrap-fed EAF
3:1
Carbon-intensity ratio, BF-BOF vs scrap-EAF — why the benchmark carries cost weight now
Two Routes, Two Benchmark Curves
You cannot benchmark a steel plant against "the industry" as a single number — the integrated and electric-arc routes are physically different processes with different energy stories. The integrated route carries the reduction of iron ore in the blast furnace, so its intensity is dominated by coke and injected fuels. The EAF route skips ironmaking entirely and melts scrap with an electric current, so its number is dominated by kWh at the furnace. Benchmark each route against its own curve; comparing a BOF shop to a mini-mill tells you nothing.
Integrated · BF-BOF
Ore → Blast Furnace → BOF
Dominant loadCoke + injected fuel (reduction)
Process band~400–600 kWh/t
Indirect (raw materials)~10% of total
Carbon intensity~2.0–2.3 t CO₂e/t
Benchmark levers live in the blast furnace, stoves, and gas-recovery loop — top gas, hot blast, and by-product fuel export dominate the picture.
Electric Arc · EAF
Scrap / DRI → Electric Arc Furnace
Dominant loadArc electricity at the furnace
Arc power range~350–700 kWh/t
Best-practice total elec.~400–450 kWh/t
Carbon intensity (scrap)~0.6–0.7 t CO₂e/t
Benchmark levers live in tap-to-tap time, scrap preheating, power-on efficiency, and electrode + refractory condition. DRI feedstock raises the kWh floor.
The bands above are practical positioning ranges drawn from published industry benchmarking, not a compliance target. Your defensible number is your own site's data trended against its route peers — which is exactly what a CMMS baseline gives you.
Where Your Furnace Sits · The Percentile View
A benchmark curve ranks every plant in a route from most to least efficient. The single most useful question a steel energy program can answer is not "what's our kWh/t" — it's "what percentile is that, and which direction is it moving." The band below is how a benchmark platform frames position, using the EAF electricity curve as the example.
Top decile
< 400 kWh/t
Best-practice frontier. Scrap preheat, tight power-on, disciplined electrode + refractory PM. The number peers chase.
2nd quartile
400–450 kWh/t
Competitive. A well-run scrap-fed shop with normal feedstock and no chronic downtime lands here.
3rd quartile
450–550 kWh/t
Improvement runway. Usually feedstock mix, power-off losses, or degraded assets bleeding kWh per heat.
Bottom quartile
> 550 kWh/t
Structural gap. DRI-heavy charge, long tap-to-tap, or equipment condition dragging every heat's consumption.
Set Your Furnace Baseline — Free Forever
Sign up on OxMaint's free plan and register each furnace as an asset with its own kWh/t baseline. Trend consumption per heat, tag the maintenance events that move the number, and see your position shift quarter over quarter. No card, no time limit.
Why a CMMS Is the Right Home for the Benchmark
Energy dashboards show you the number. A CMMS shows you why the number moved — because it holds the maintenance events, asset conditions, and downtime records that drive kWh/t up between benchmark reports. Benchmarking that lives in a spreadsheet drifts; benchmarking wired to work orders explains itself.
The Number Has a Cause
A jump in kWh/t is a degraded burner, a fouled recuperator, a worn electrode regulator, or lengthening tap-to-tap. The CMMS already logs those — benchmarking just reads them.
Per-Asset Baselines
Each furnace, reheat furnace, and blower carries its own energy baseline. Deviation from baseline is an early failure signal, not just an efficiency line item.
Maintenance ↔ Energy Link
Tie every PM and repair to the consumption trend it affected. That's the audit trail that survives a "why did Q3 slip" conversation with the group energy lead.
One Version of the Truth
Peer comparison across a multi-site group needs a common data structure. A shared CMMS makes site A and site B's benchmark comparable by construction.
The Benchmark Loop · Four Steps a Steel Group Actually Runs
Every durable steel energy benchmarking program runs the same loop. Skip the last step and it becomes a reporting exercise nobody acts on; keep it closed and the benchmark drives real kWh out of the process.
01
Meter & Normalize
Capture energy per heat / per tonne by asset and route. Normalize for product mix and feedstock so comparisons are like-for-like.
02
Position
Place each furnace against its own history (internal benchmark) and its route peers (industry benchmark). Report percentile, not just the raw number.
03
Diagnose
Trace deviation to its cause in the work-order and condition history — asset degradation, process drift, or feedstock change.
04
Act & Verify
Fire the corrective work order, then verify the consumption trend returned to baseline. Closed loop, logged, repeatable.
The KPIs a Steel Energy Program Reports Up
The tight set below is what a group energy lead and a plant reliability manager both watch — the numbers that prove the benchmark is moving the process, not just filling a slide.
Specific Energy (kWh/t)
By route · by furnace
The headline number, segmented so a BOF shop and a mini-mill are never averaged into one meaningless figure.
Peer Percentile
Direction > absolute
Where the site ranks in its route curve and whether it's climbing. The number that survives the board meeting.
Baseline Deviation %
Per asset, per period
Drift from each asset's own energy baseline — the earliest, cheapest signal that condition is degrading.
Energy per Downtime Event
Restart + idle losses
Unplanned stops carry hidden kWh — reheat, idle, restart. Ties the reliability program directly to the energy number.
By-Product Gas Recovery
Integrated route
Top-gas and by-product fuel recovered vs flared. On the BF-BOF route this is one of the largest movable levers.
Tap-to-Tap Time
EAF route
Every extra minute of power-on and power-off adds kWh per heat. The single most benchmarked EAF operating metric.
How OxMaint Runs the Steel Energy Benchmark
Metering, per-asset baselines, peer positioning, and the corrective work-order loop all run on one platform — furnaces carried as energy-tracked assets, deviations flagged against baseline, and every kWh excursion traceable to the maintenance event behind it.
Register
Furnaces as Energy Assets
Each BF, BOF, EAF, and reheat furnace registered with its route, its kWh/t baseline, and its own consumption history.
Trend
Consumption Per Heat / Tonne
Energy trended per heat and per tonne, normalized for product and feedstock so the benchmark stays like-for-like.
Position
Internal + Peer Percentile
Each asset against its own history and, across a group, against sibling sites on the same route curve.
Flag
Baseline Deviation Alert
Drift above the asset baseline auto-opens a diagnostic work order before the quarterly report ever shows it.
Trace
Energy ↔ Work Order
Every consumption move linked to the PM, repair, or downtime event behind it — the why, not just the what.
Report
Group Benchmark Rollup
Site-by-site percentile and baseline-deviation rollup for the group energy lead, built from one common data structure.
Turn Your Maintenance Data Into a Benchmark You Defend
Free forever plan — no card, no time limit. Register your furnaces, set each one's kWh/t baseline, and let every deviation trace back to the work order behind it. Or book 30 minutes and we'll map your route mix and peer structure onto the platform end to end.
Frequently Asked Questions
What's a good energy benchmark for a steel plant?
It depends entirely on route. The integrated BF-BOF route typically sits in a ~400–600 kWh/t process-energy band because it carries iron-ore reduction, while a scrap-fed EAF's best-practice total electricity lands around 400–450 kWh/t. Global average steelmaking intensity is roughly 21 GJ/t. The useful benchmark is always your own site trended against its route peers, not a single industry figure.
Why can't I compare my BOF shop to a mini-mill?
Because they're different processes. Integrated steelmaking reduces iron ore in a blast furnace — coke and injected fuel dominate. An EAF melts scrap with electricity — no ironmaking step at all. Their energy numbers aren't on the same scale, so each route gets its own benchmark curve. Comparing across routes produces a number that means nothing.
Why run energy benchmarking inside a CMMS instead of an energy dashboard?
A dashboard shows the number; a CMMS explains it. kWh/t moves because of degraded burners, fouled recuperators, worn electrode regulators, or lengthening tap-to-tap — all of which already live as work orders and asset conditions in the CMMS. Wiring the benchmark to that data means every deviation traces to a cause you can act on.
How does peer benchmarking work across a multi-site steel group?
Peer comparison needs a common data structure so site A and site B are measured the same way. When every site runs the same CMMS with furnaces registered by route and normalized per tonne, the group energy lead gets a real percentile rollup instead of reconciling incompatible spreadsheets.
Book a demo to see the group view.
Can maintenance data really move the energy number?
Directly. Unplanned downtime carries hidden reheat, idle, and restart kWh; degraded assets raise consumption every heat; missed PM lets efficiency drift silently. Tying the benchmark to per-asset baselines turns each deviation into an early failure signal — so reliability and energy improve on the same work order.
Start free to link the two.