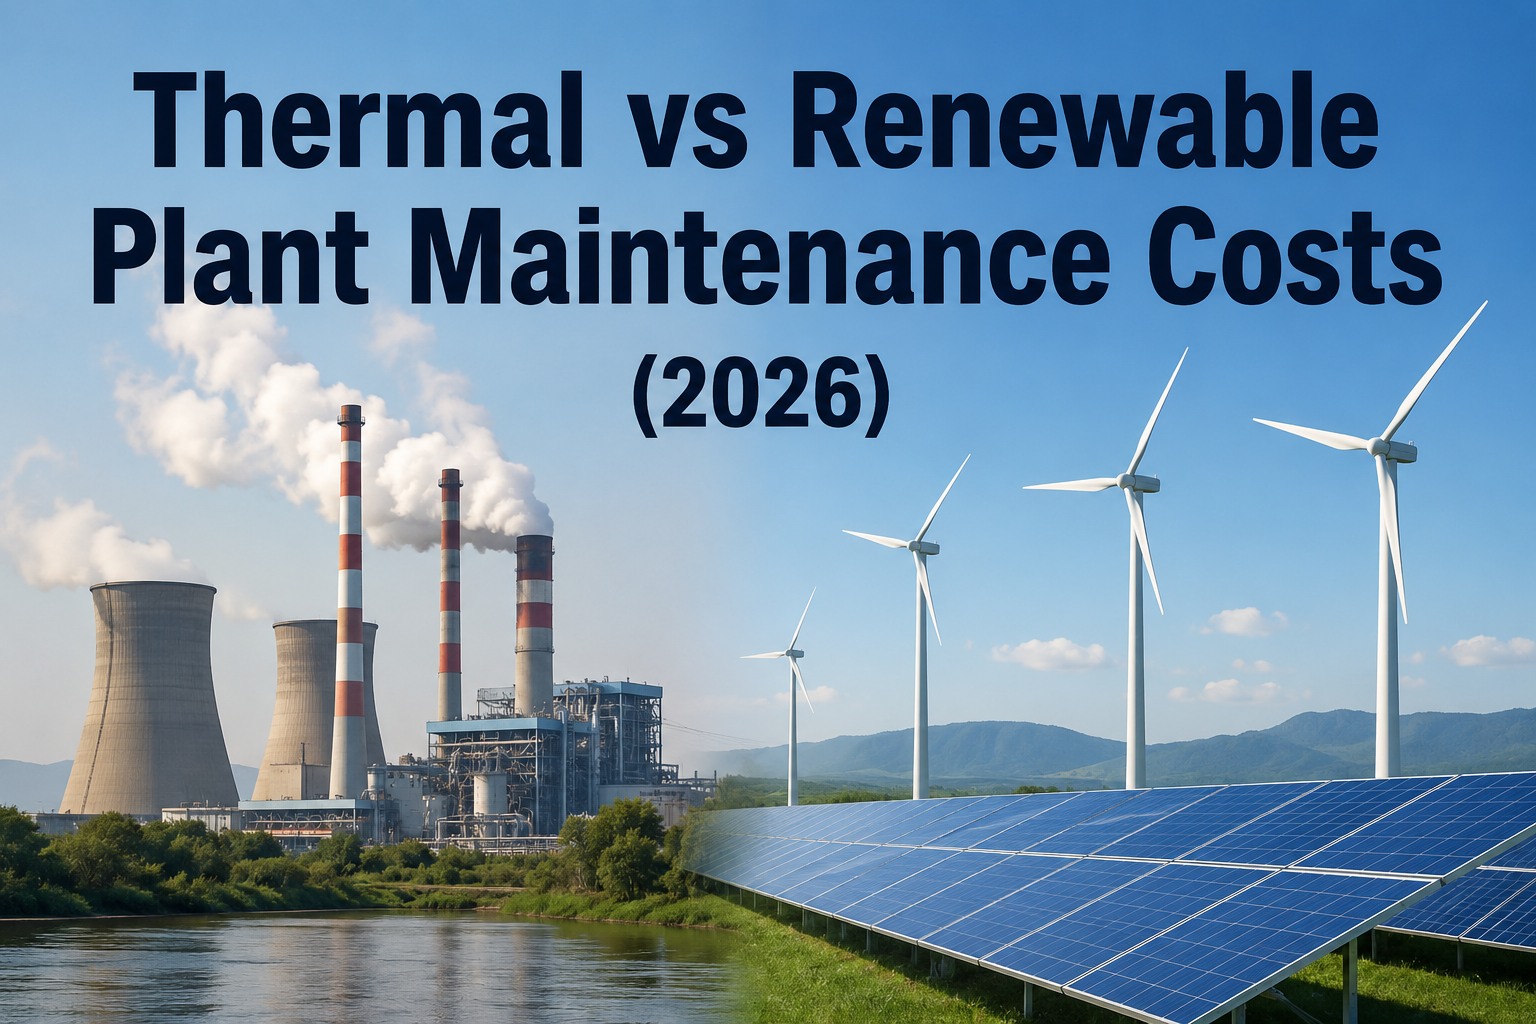
Maintenance economics across power generation assets are diverging fast: a 500 MW coal unit routinely spends $28–42 per MWh on operations and maintenance, while utility-scale solar PV runs $6–11 and onshore wind $9–15. As fleets mix thermal baseload with renewable peakers, operators who track O&M by asset class — not by plant — find the real savings. OxMaint centralizes preventive libraries, cost coding, and benchmarking across every generation type in one CMMS. Start Free Trial to see your portfolio's true maintenance cost picture in under 14 days.
Thermal assets cost up to 4× more to maintain than renewables — is your portfolio budget reflecting that?
A mixed 2 GW fleet carrying 600 MW of legacy thermal can absorb $11–18M in avoidable O&M every year. The gap between coal, gas, solar, and wind maintenance is widening through 2026, and the operators who restructure PM strategy by asset class — not by plant — capture the spread first.
Where the maintenance dollars actually go
Levelized O&M figures normalized across U.S. EIA and IEA 2024 datasets, projected to 2026 labor and materials inflation. Ranges reflect plant age, capacity factor, and PM discipline.
| Asset Class | O&M ($/MWh) | Annual PM Hours/MW | Top Cost Driver | Unplanned Downtime Risk |
|---|---|---|---|---|
| Coal thermal | $28–42 | 18–26 | Boiler tube & ash handling | High |
| Gas CCGT | $15–22 | 10–15 | HRSG tube fouling | Medium-High |
| Gas peaker (OC) | $22–31 | 8–12 | Combustor hardware | Medium |
| Onshore wind | $9–15 | 4–7 | Gearbox & blade leading-edge | Medium |
| Utility solar PV | $6–11 | 1–3 | Inverter & soiling loss | Low |
| Battery BESS | $8–14 | 2–4 | Cell imbalance & HVAC | Low-Medium |
The $4.2M hiding between two asset ledgers
Consider a regional operator running 600 MW coal, 400 MW CCGT, 500 MW onshore wind, and 300 MW solar. Splitting O&M by asset class exposes where every PM hour returns — or burns — capital.
Why thermal and renewable maintenance behave differently
The cost gap isn't just about fuel — it's about failure physics. Thermal plants concentrate wear in high-temperature, high-pressure rotating equipment. Renewables distribute wear across thousands of passive components and one or two active conversion points.
Concentrated, high-velocity wear
- 1
Boiler & HRSG tube creep — 1,200+ tube leaks/yr in a typical 500 MW coal unit; each forced outage averages 78 hours and $1.1M in lost margin.
- 2
Steam turbine overhauls — major inspections every 8–10 years, $4–9M per rotor pull, plus 21-day outage windows.
- 3
Ash & emissions handling — scrubbers, ESPs, and baghouses add 14–19% to O&M and need daily PM attention.
- 4
Combustion hardware — gas turbine nozzles and buckets every 24–32k factored hours; $1.8–3.4M per major.
Distributed, predictable wear
- 1
Wind drivetrain & blades — major component swap every 7–10 yrs; crane mobilization alone runs $180–340k per turbine.
- 2
Solar inverters — mean time to replacement 10–13 yrs; central inverter swap = $110–180k, string-level = $4–8k.
- 3
Soiling & vegetation — uncleaned fixed-tilt PV loses 4–6% yield; optimized washing recovers $11–19k/MW-yr.
- 4
BESS cell balance — rack-level imbalance at 2–4% triggers derating; HVAC drives 40% of system O&M.
Stop budgeting thermal and renewable O&M in the same spreadsheet.
OxMaint gives mixed-portfolio operators asset-class-specific PM libraries, cost tracking, and benchmarking in one integrated CMMS — live in 14 days, not 6 months.
What operators ask before restructuring O&M budgets
See your portfolio's true O&M picture in 14 days.
Import last year's work orders, map them to asset-class PM libraries, and benchmark every plant against its true peer group — before next year's budget locks in.
Free 14-day trial · No credit card