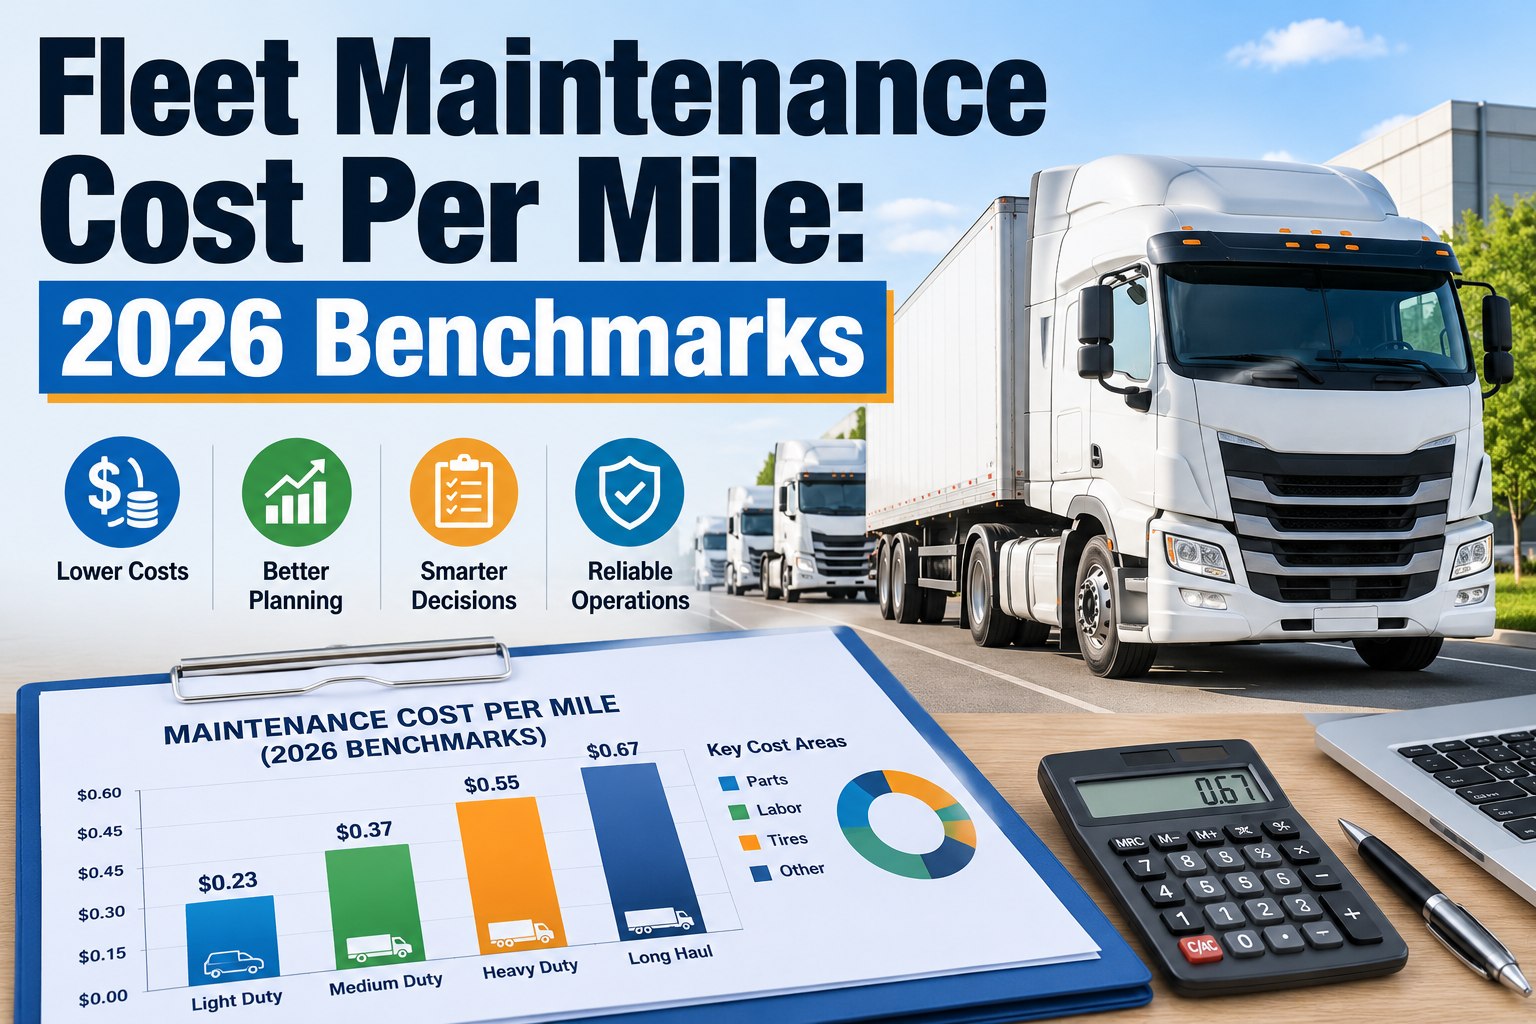
Fleet maintenance cost per mile is the single most revealing KPI in fleet operations — it tells you whether every dollar spent on parts, labor, fuel, and compliance is translating into useful, revenue-generating miles. In 2026, benchmarks continue to shift as labor rates climb 4–6% annually, parts inflation persists, and predictive maintenance technology separates top-quartile fleets from the rest. Industry leaders keep maintenance cost per mile between $0.15 and $0.22 for Class 8 trucks, while reactive fleets watch that number spiral past $0.35. OxMaint helps fleet managers benchmark, track, and drive down cost per mile with AI-powered CMMS analytics — cost tracking by vehicle and route, preventive maintenance automation, and the maintenance cost analytics that turn a mystery number into a managed operational KPI. You can Start Free Trial today or book a personalized demo to see the platform on your own fleet data.
2026 Fleet Benchmarks
Is your fleet maintenance cost per mile above the 2026 benchmark?
Top-quartile fleets hold maintenance cost per mile under $0.18 for Class 8 tractors. Most fleets don't know their real number until they track parts, labor, and downtime by vehicle — and by then, thousands of dollars have already leaked out. OxMaint CMMS shows you the number, the drivers, and the levers to bring it down.
$0.17
Top-Quartile CPM
Class 8 Truck Maint.
$0.28
Industry Average
All Fleet Types
32%
Cost Reduction
After OxMaint PM
Cost Per Mile Formula
How to calculate fleet maintenance cost per mile
Fleet maintenance cost per mile is calculated by dividing total maintenance spend — parts, labor, outsourced repairs, tires, fluids, and compliance-related servicing — by the total miles driven in the same period. The formula is simple, but the data collection is where most fleets fail. Missing work orders, untracked parts, and lump-sum repair invoices distort the number and hide the real cost drivers.
A 45-truck regional fleet benchmarking its 2026 spend
A regional delivery fleet running 45 Class 7–8 trucks spends $198,000 annually on maintenance — $112K in parts and tires, $71K in labor, and $15K in outsourced repairs. The fleet logs 780,000 miles per year. That yields a maintenance CPM of $0.254 — above the 2026 industry average of $0.22 and well above the top-quartile benchmark of $0.17. After implementing OxMaint preventive maintenance scheduling and parts inventory tracking, the same fleet reduced unplanned breakdowns by 38%, cut parts spend 14% through bulk ordering and stock visibility, and brought CPM down to $0.19 within nine months — saving over $49,000 annually.
2026 Benchmarks
Fleet maintenance cost per mile benchmarks by vehicle type
Cost per mile varies significantly by vehicle class, duty cycle, and age. A 3-year-old Class 8 over-the-road tractor naturally costs less per mile than a 9-year-old box truck doing urban delivery stops. Use these 2026 benchmarks — drawn from FMCSA data, ATRI trends, and OxMaint aggregate fleet analytics — to find your gap and prioritize which vehicles or routes are pulling your fleet average up.
| Vehicle Type | Top Quartile CPM | Industry Avg CPM | Bottom Quartile | Annual Maint. Spend |
|---|---|---|---|---|
| Class 8 OTR Tractor | $0.15 | $0.22 | $0.34+ | $18K–$26K |
| Class 8 Regional Truck | $0.17 | $0.24 | $0.36+ | $16K–$23K |
| Class 6 Box Truck | $0.19 | $0.26 | $0.38+ | $9K–$14K |
| Class 3–5 Van | $0.12 | $0.18 | $0.28+ | $5K–$8K |
| Reefer Trailer (Maintenance) | $0.04 | $0.06 | $0.10+ | $4K–$7K |
| Dry Van Trailer | $0.02 | $0.035 | $0.06+ | $1.5K–$3K |
Benchmarks reflect 2026 operating conditions: parts inflation +3.2%, technician labor +5.1%, tire costs +2.8%. Reefer and trailer CPM calculated per trailer-mile, not tractor-mile.
Cost Drivers
What drives fleet maintenance cost per mile up — and how to pull it down
Five levers account for 85% of the variance between top-quartile and bottom-quartile fleet maintenance costs. Fleets that manage all five through a CMMS see 25–35% lower cost per mile than those managing maintenance reactively on spreadsheets and paper work orders.
Reactive vs. Preventive Maintenance Ratio
Fleets with more than 40% unplanned repairs pay 2.3x more per mile than PM-driven fleets. OxMaint automates PM scheduling by mileage, hours, or calendar — keeping your reactive ratio under 20%.
Parts Inventory Visibility
Without real-time stock data, fleets over-order by 18–25% and expedite-ship parts at 3x cost. OxMaint tracks every part by asset, triggers reorder points, and eliminates emergency purchasing.
Asset Age & Lifecycle Timing
Maintenance CPM typically doubles after year 6. OxMaint tracks total cost of ownership per asset, flagging when a truck's CPM crosses the replacement threshold so you trade before costs spiral.
Downtime & Lost Revenue
Every unplanned downtime day costs $400–$760 in lost revenue per truck. OxMaint predictive maintenance uses AI on sensor and work-order history to catch failures 5–15 days early.
Driver-Influenced Costs
Hard braking, idle time, and missed DVIRs drive 12–18% of maintenance cost. OxMaint links driver behavior and inspection data to per-vehicle CPM, so you can coach the drivers costing you the most.
Compliance & DOT Violations
A single CSA maintenance violation averages $1,200 in fines plus towing and lost loads. OxMaint maintains full audit-ready maintenance histories and automated inspection scheduling.
How OxMaint Helps
How OxMaint CMMS brings fleet cost per mile down
OxMaint is an AI-powered CMMS and EAM platform built for maintenance and reliability teams that need to turn fleet maintenance cost per mile from a lagging accounting number into a real-time operational KPI. Here's how four core capabilities map directly to lowering your fleet operating cost:
Automated PM Scheduling
OxMaint triggers preventive maintenance automatically by mileage, engine hours, or calendar date — no missed oil changes, no overdue inspections. Fleets using automated PM cut unplanned breakdowns 30–50% and hold reactive ratios under 15%.
Cost Tracking by Vehicle & Route
Every work order, part, and labor hour is tied to a specific asset and route. OxMaint CMMS analytics surface which trucks, routes, or driver assignments are pulling your fleet CPM above benchmark — so you act on data, not guesswork.
Predictive Maintenance AI
OxMaint predictive algorithms analyze sensor data, DTC codes, and work-order history to flag potential failures 5–15 days before they happen. That shifts repairs from roadside emergency to scheduled shop visit — cutting repair costs up to 40%.
Spare Parts Inventory & TCO
Real-time parts tracking with auto-reorder points eliminates stockouts and emergency purchasing. OxMaint also calculates true fleet TCO per asset — parts + labor + downtime + depreciation — so you trade at the right moment, not too late.
Fleet Budgeting
Fleet budgeting: turning CPM from a lagging number into a forward KPI
Most fleets calculate maintenance cost per mile at the end of the quarter — after the money is spent and the damage is done. The 2026 shift is toward real-time CPM visibility, where maintenance managers see cost-per-mile trending by vehicle, route, and driver week over week, and can intervene before a single truck pulls the fleet average above benchmark. OxMaint CMMS analytics makes this possible by automatically rolling up work orders, parts issues, and labor entries into live CPM dashboards.
$0.09
CPM Gap
Avg fleet vs. top quartile — $70K+ annual loss on 50 trucks
9 months
Typical Payback
Time to recover OxMaint CMMS investment through CPM reduction
3–5x
ROI Multiple
Average 3-year ROI for fleets switching from spreadsheets to OxMaint
85%
Compliance Pass Rate
DOT inspection pass rate with automated PM & digital records
"We didn't know our real cost per mile until OxMaint showed us. Turned out three older trucks were costing $0.42 per mile — we traded them and dropped fleet CPM from $0.26 to $0.19 in one quarter."
— Director of Maintenance, 62-truck regional carrier
See It On Your Fleet
Book a 30-minute demo and see your real cost per mile
Stop guessing at fleet maintenance cost. In a 30-minute live demo, we'll show you how OxMaint CMMS tracks CPM by vehicle, automates preventive maintenance, and surfaces the cost levers that move your number — on your own asset data.
FAQ
Fleet maintenance cost per mile: frequently asked questions
What is a good fleet maintenance cost per mile in 2026?
A good fleet maintenance cost per mile in 2026 is $0.15–$0.18 for Class 8 over-the-road tractors and $0.12–$0.16 for lighter Class 3–5 vans. Top-quartile fleets hold total maintenance CPM — parts, labor, tires, and compliance — under $0.20 across mixed fleets. Anything above $0.28 for a Class 8 truck signals reactive maintenance patterns, aging assets, or untracked parts spend that a CMMS like OxMaint can identify and correct within one maintenance cycle.
How do you calculate fleet maintenance cost per mile?
Divide total maintenance spend (parts + labor + outsourced repairs + tires + fluids + compliance servicing) by total miles driven in the same period. For example, $18,000 in maintenance across 100,000 miles equals $0.18 CPM. The challenge isn't the math — it's capturing every cost line. OxMaint CMMS automatically ties every work order, part issue, and labor entry to the asset and mileage, so your CPM is accurate and real-time. You can Start Free Trial to calculate it on your fleet today.
What is included in fleet maintenance cost per mile?
Fleet maintenance CPM includes all parts (filters, belts, brakes, tires, fluids, DEF), in-house and outsourced labor, shop supplies, compliance inspections (DOT, emissions, annuals), and minor body repairs. It does not include fuel, insurance, depreciation, or financing — those belong in total operating cost per mile. Downtime cost is sometimes excluded from maintenance CPM but should be tracked separately, as it often exceeds the repair cost itself.
How can I reduce my truck maintenance cost per mile?
The fastest levers are shifting from reactive to preventive maintenance (cuts unplanned repairs 30–50%), gaining real-time parts inventory visibility (eliminates 18–22% overspend), and tracking CPM by vehicle to trade high-cost assets before they drain the fleet. OxMaint CMMS automates all three — PM scheduling, parts tracking, and per-vehicle cost analytics — so fleets typically see 20–32% CPM reduction within 6–9 months. Book a demo to see the levers on your data.
How does fleet maintenance software lower cost per mile?
CMMS software like OxMaint lowers CPM by automating preventive maintenance scheduling (fewer roadside breakdowns), tracking parts inventory in real time (no emergency purchases), digitizing work orders (no lost labor or parts data), and providing per-vehicle cost analytics (spot cost outliers fast). Fleets switching from spreadsheets and paper to OxMaint typically achieve 3–5x ROI over three years, with payback in under 12 months driven primarily by reduced unplanned downtime and parts spend optimization.
Start Reducing Your Fleet CPM Today
Stop losing money to untracked maintenance costs
Every mile above benchmark is money leaking from your fleet budget. OxMaint CMMS shows you the number, the drivers, and the path to top-quartile cost per mile — with AI-powered preventive maintenance, real-time parts tracking, and per-vehicle cost analytics. Start your free trial or book a live demo on your fleet data.
Free 14-day trial · No credit card