71% of FMCG maintenance professionals claim preventive maintenance as their primary strategy. 58% still spend less than half their time executing it. That execution gap is where OEE collapses. Total Productive Maintenance closes it — not by adding more maintenance headcount, but by involving every operator as the first line of equipment defence, automating PM scheduling through a CMMS, and tracking OEE in real time so improvement is visible and repeatable. A leading FMCG snack manufacturer running 62% OEE across four packaging lines eliminated $170,000 in annual unplanned breakdown losses and recovered 2,400 additional production hours per line within 14 months of structured TPM deployment. The equipment did not change. The system around it did. Sign up free on Oxmaint to digitise your TPM programme across all eight pillars from day one, or book a demo to see the TPM Module and OEE Dashboard configured for your production lines.
Guide
TPM Implementation in FMCG Manufacturing: Autonomous Maintenance and OEE Improvement
10 min read
85%
World-class OEE benchmark. Most FMCG plants start at 45 to 65%. The gap is recoverable production capacity hidden in equipment you already own.
4.8x
Cost of reactive emergency repairs versus the same repair completed as a planned PM event — the core financial case for every TPM programme
3-4 mo
Timeframe for first measurable OEE improvement on a pilot line after structured TPM deployment. 10 to 15% OEE gain typical within first 6 months.
71%
Reduction in unplanned downtime achieved by an FMCG manufacturer within 14 months of full 8-pillar TPM deployment with CMMS support
Oxmaint TPM Module + OEE Dashboard | FMCG Manufacturing
Stop Measuring OEE. Start Improving It. Oxmaint Connects Every TPM Pillar to Real-Time OEE Data.
8 PillarsAll digitised
85-95%AM compliance with digital checklists
14 daysTo OEE baseline
ZeroPaper checklists
What is TPM
Total Productive Maintenance: The FMCG Production System That Targets Zero Breakdowns
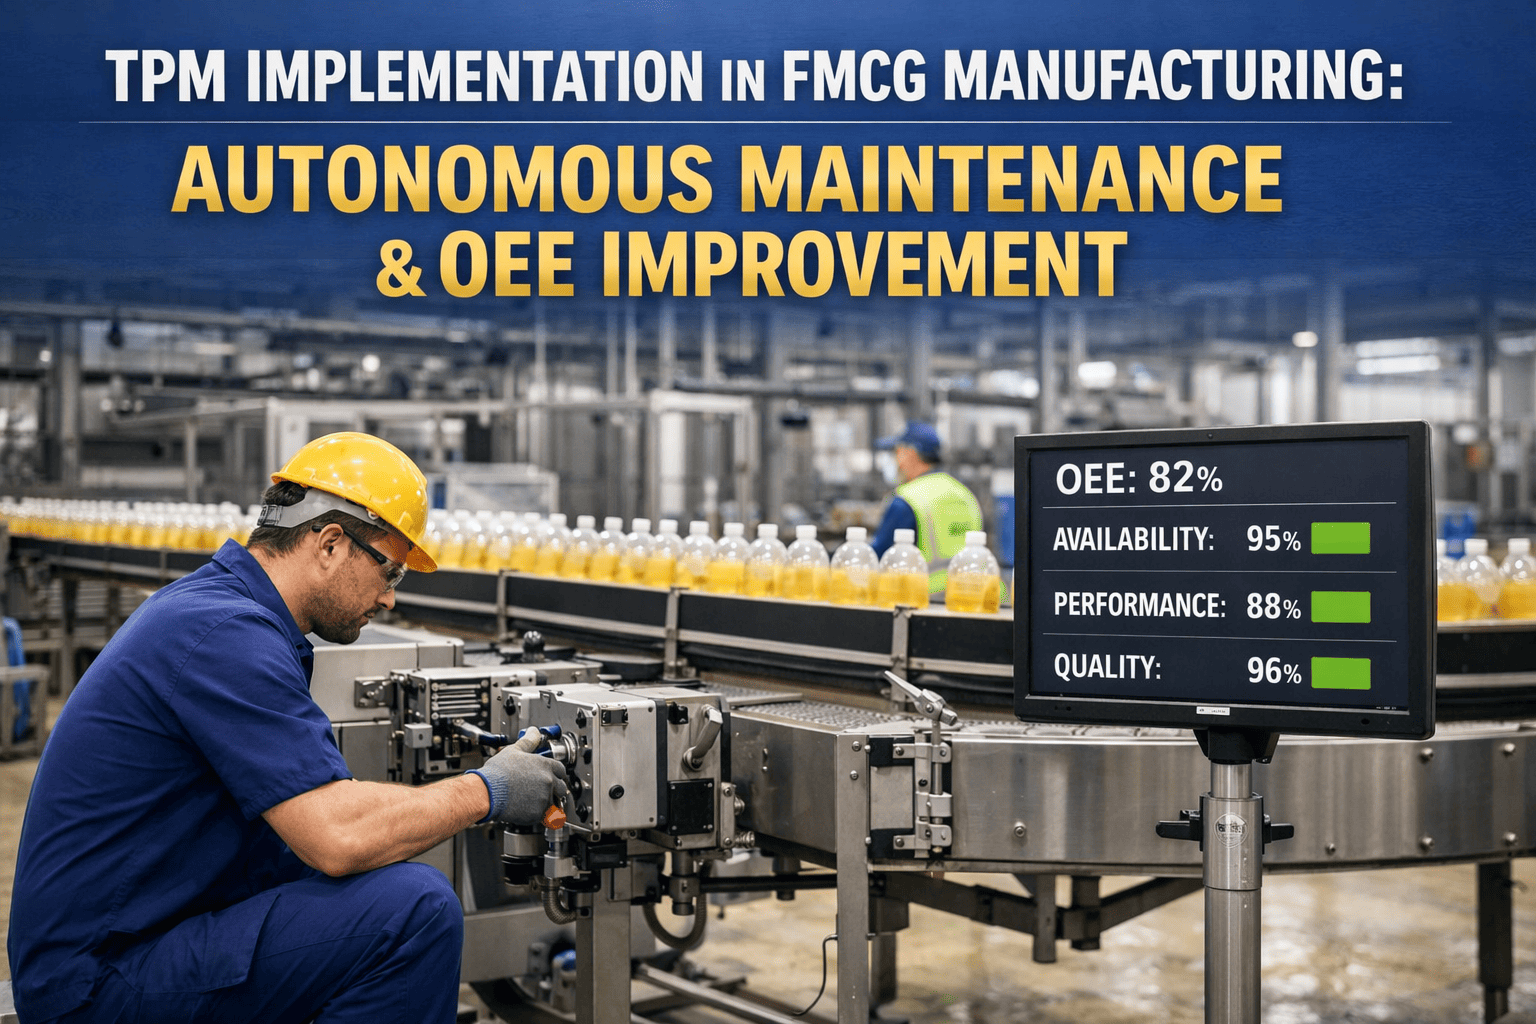
OEE = Availability x Performance x Quality
OEE is the single number that summarises TPM performance. World-class is 85%. Most FMCG plants operate at 55 to 70% without structured TPM. Every percentage point below 85% represents recoverable production capacity sitting inside equipment you already own. A beverage filler running at 1,200 bottles per minute loses 20,000 units in a 17-minute unplanned stop.
Typical FMCG OEE without TPM: 55 to 70%
The 6 Big Losses TPM Systematically Eliminates
Breakdowns (5 to 15% of available time), setup and adjustment (5 to 20% in high-SKU plants), minor stoppages and idling (17%+ of total production time loss), reduced speed, startup rejects, and in-process defects. Each loss maps to specific TPM pillars. Each pillar has measurable improvement targets. Without a CMMS tracking OEE and work order data, none of these losses are visible until the month-end report reveals the damage.
Minor stops and reduced speed: 17%+ of total production time loss
TPM vs Reactive Maintenance: The Financial Gap
Reactive maintenance programmes in FMCG plants carry 40 to 60% OEE and consume 70 to 80% of their maintenance budget on emergency repairs at 4.8 times the planned cost. TPM programmes that reach maturity shift the reactive ratio to under 20%, recover the 4.8x cost premium on every prevented event, and generate measurable production volume from equipment that already exists. The pilot-line business case closes within 90 days for most FMCG operations.
Reactive ratio target after TPM maturity: under 20%
Why FMCG Operations Need Digital TPM Infrastructure
Paper autonomous maintenance checklists produce 40 to 60% completion rates because non-completion is invisible to supervisors. Digital AM checklists on mobile with supervisor visibility reach 85 to 95% compliance within 30 days. Without CMMS-calculated OEE, TPM improvement is anecdotal. Without automated PM scheduling, planned maintenance reverts to reactive within 3 months of programme launch as production pressure overrides manual planning.
Paper AM checklist compliance: 40 to 60% vs 85 to 95% with digital
8 TPM Pillars
All 8 TPM Pillars Digitised in Oxmaint: What Each Pillar Does and How It Improves OEE
01
Autonomous Maintenance
Operators own equipment condition through daily cleaning, inspection, and lubrication. Oxmaint mobile checklists ensure AM tasks are completed and visible to supervisors in real time. Abnormalities flagged by operators generate work orders automatically.
OEE impact: +Availability
02
Planned Maintenance
Scheduled PM work orders generated automatically from asset criticality and failure history. Oxmaint transitions from time-based intervals to condition-based triggers as IoT data accumulates. Maintenance teams focus on system reliability, not firefighting.
OEE impact: +Availability
03
Focused Improvement (Kaizen)
Cross-functional kaizen teams tackle the biggest OEE losses using Oxmaint stoppage reason codes and downtime data. A 2025 ScienceDirect study documented 14% OEE improvement from structured kaizen targeting breakdown losses. Kaizen actions tracked to closure in Oxmaint.
OEE impact: +All three factors
04
Quality Maintenance
Equipment conditions that produce defects are identified and eliminated through inspection standards, not quality inspection after the fact. Defect-to-equipment correlation tracked in Oxmaint links quality failures to specific asset condition events.
OEE impact: +Quality rate
05
Early Equipment Management
Lessons from existing equipment failures applied to new equipment commissioning. Oxmaint captures failure modes and PM standards from operating equipment and exports them as design input for new line specifications, reducing commissioning time and early-life failures.
OEE impact: Faster ramp-up
06
Training and Education
Multi-skilled operators who understand both the why and how of equipment care. Oxmaint captures repair procedures and SOP attachments against asset records — delivering the right knowledge to the right technician at the point of work through mobile access.
OEE impact: +Performance rate
07
Safety, Health and Environment
Zero accidents through proactive hazard identification embedded into every TPM activity. Oxmaint LOTO work order gates, safety inspection records, and compliance documentation ensure every AM and PM task has safety protocol built into the digital workflow.
OEE impact: Zero accident stops
08
Administrative TPM
TPM principles extended to support functions — procurement, planning, and quality lab. Oxmaint spare parts reservation, vendor performance tracking, and PM-driven parts forecasting eliminate the administrative waste that delays maintenance response and extends MTTR.
OEE impact: -MTTR
Implementation Roadmap
The Proven TPM Deployment Sequence: Pilot Line First, Expand Only When Results Are Proven
Launching all eight pillars across an entire plant on day one is the most reliable way to fail at TPM. The correct sequence proves value on one line before replicating — slower on paper, dramatically faster in practice. Oxmaint digitises this sequence from day one.
5S and OEE Baseline on Pilot Line
Select one pilot line using three criteria: easiest to improve for early wins, plant bottleneck for maximum impact, or worst OEE performer for the most dramatic improvement story. Deep-clean and restore the equipment to its designed operational condition — this is the practical introduction to Autonomous Maintenance. Configure Oxmaint OEE tracking for the pilot line. Measure OEE for a minimum of two full production weeks before launching any TPM activity. Without a documented baseline, improvement is invisible to management and the business case cannot be made for expansion.
Deliverable: Documented OEE baseline per Availability, Performance, Quality on the pilot line
Autonomous Maintenance Steps 1 to 4 and First Kaizen
Launch AM training on the pilot line — start with 5-minute tasks, not 30-minute routines. Let operators choose their first AM tasks to build ownership. Deploy Oxmaint mobile AM checklists with supervisor visibility. Configure Oxmaint stoppage reason codes per the Six Big Loss framework. Form the first kaizen team using OEE data to identify the top three breakdown causes. Track kaizen actions to closure in Oxmaint. Show operators where their AM work directly moved the OEE number — this is the moment buy-in accelerates from compliance to ownership.
Deliverable: AM compliance above 80% on pilot line, first kaizen actions closed, measurable OEE movement
Planned Maintenance Formalisation and Results Validation
Formalise planned maintenance schedules in Oxmaint using criticality scores and failure mode data collected during the baseline period. Automate PM work order generation per interval. Configure IoT sensor connections for critical assets to enable condition-based triggers. Validate OEE results against the pre-TPM baseline — by month 4 to 6, pilot lines typically show 10 to 15% OEE improvement. These documented results become the business case for expansion to the next line and the evidence presented to leadership. Document every result with before and after data, not anecdote.
Pivotal: Present documented OEE results to secure approval for plant-wide expansion
Plant-Wide Expansion Across All 8 Pillars
Replicate the proven pilot process on subsequent lines using the same five-step sequence — one line at a time, with documented results at each step before the next line begins. Progressively introduce the remaining six pillars: Quality Maintenance, Early Equipment Management, Training, Safety, and Administrative TPM. Establish monthly TPM review meetings with Oxmaint OEE dashboards as the meeting data source. World-class OEE of 85% or above is achievable by months 18 to 24 with sustained leadership commitment and CMMS discipline.
Deliverable: Full plant OEE dashboard live, all lines on Oxmaint TPM programme, monthly review rhythm established
Oxmaint Calculates OEE Automatically From Your Work Orders and Downtime Logs. Your TPM Baseline Is Ready in 14 Days — No Manual Calculation, No Spreadsheet.
OEE Deep Dive
How Each OEE Factor Is Improved by TPM Pillars in FMCG Operations
Availability
+Pillar 1+2
Autonomous and Planned Maintenance
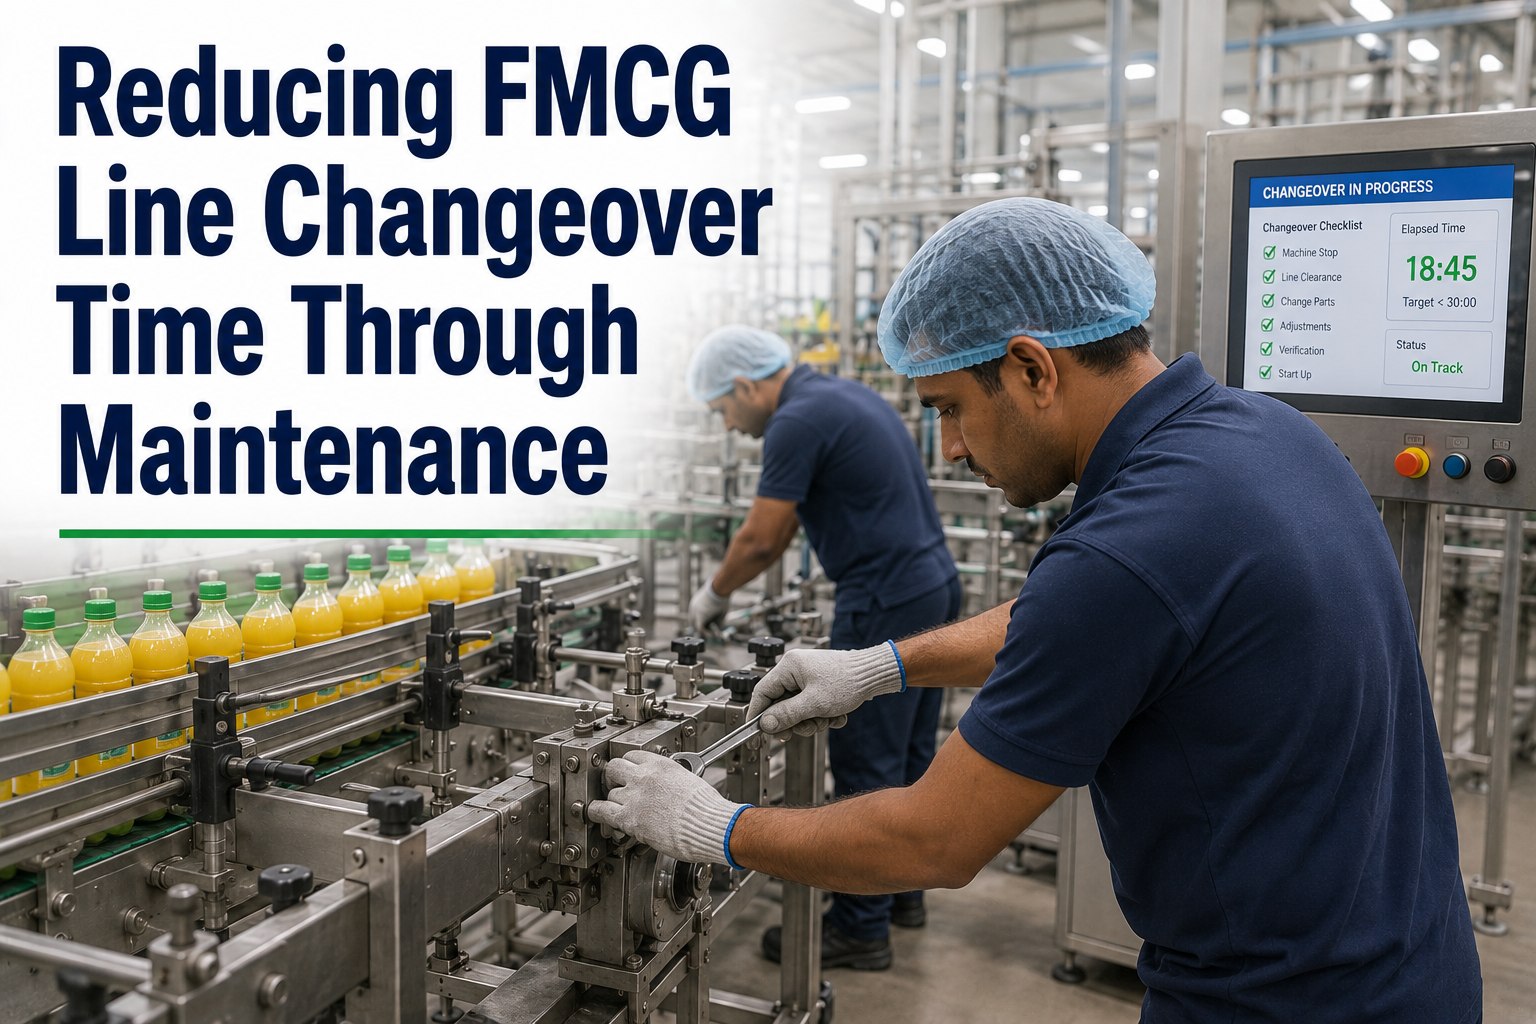
Breakdowns and changeovers reduce availability. AM eliminates the minor defects that become major failures. Planned maintenance prevents the unplanned stoppages that dominate availability loss. TPM can reduce breakdowns by 15 to 30% through preventive operator actions. Changeover reduction via SMED under Focused Improvement directly improves availability in high-SKU FMCG plants where setup time accounts for 5 to 20% of available production time.
Performance
+Pillar 3+6
Focused Improvement and Training
Minor stops and reduced speed account for 17% or more of total production time loss in typical manufacturing operations. These losses are invisible in most plants because they are too short to trigger formal downtime reporting. Focused Improvement kaizen teams using Oxmaint stoppage reason code data identify and eliminate these micro-losses. Documented kaizen gains of 10 to 20% throughput increase without capital investment are achievable on production lines approaching capacity saturation.
Quality
+Pillar 4+5
Quality Maintenance and Early Equipment Management
Startup rejects and in-process defects reduce quality rate. In FMCG, equipment condition drift — worn seal jaws, contaminated fill heads, degraded label applicator rollers — produces quality defects before any process alarm triggers. Quality Maintenance identifies the specific equipment conditions that generate defects and builds inspection standards that catch them before product is lost. A 2024 pharmaceutical TPM study showed quality rate improvement to 90.5% from a baseline below 80%.
Combined OEE
55% to 85%
Typical FMCG TPM journey
The compound OEE improvement from all three factors is the reason TPM is the highest-ROI production initiative available to FMCG manufacturers without capital expenditure. A plant moving from 55% to 85% OEE on a single line capable of $48 million annual output recovers $14.4 million in production capacity from equipment already owned. Oxmaint provides the measurement infrastructure that makes each improvement step visible, attributable, and repeatable across every line in the plant.
Documented Results
What FMCG Plants Achieve After Structured TPM Deployment with Oxmaint
OEE Improvement
+24pp
62% to 86% OEE across four FMCG packaging lines within 14 months of 8-pillar TPM deployment
Downtime Reduction
71%
Reduction in unplanned breakdown frequency within 14 months of TPM deployment on a high-SKU snack manufacturing plant
Changeover Time
-69%
From 90 minutes to 28 minutes per SKU changeover through SMED kaizen under Focused Improvement pillar on packaging lines
Maintenance Cost
$70K
Annual maintenance cost reduction at a single FMCG plant from reactive premium elimination after full TPM programme deployment
85 to 95%
AM checklist compliance rate achieved with Oxmaint digital mobile checklists versus 40 to 60% with paper-based systems
14% OEE
Improvement documented in a 2025 ScienceDirect study from structured kaizen targeting breakdown losses across 24 focused improvement actions
2,400 hrs
Additional production hours recovered per packaging line annually by an FMCG plant that deployed TPM without adding equipment or floor space
18 to 24 mo
Timeline to world-class 85%+ OEE with sustained TPM leadership commitment and CMMS-enforced PM discipline across all production lines
Frequently Asked Questions
TPM Implementation in FMCG: What Plant Managers Ask Before Starting
QWhat is the fastest way to see measurable OEE improvement from a TPM programme in FMCG?
Start with a single pilot line. Establish an Oxmaint OEE baseline for two weeks, then deploy 5S and Autonomous Maintenance Steps 1 to 4. Use Oxmaint stoppage reason code data to form one focused kaizen team targeting the top breakdown cause. Most FMCG plants see 10 to 15% OEE improvement within the first 3 to 4 months using this sequence. Show the results to leadership before expanding.
Sign up free to establish your OEE baseline today, or
book a demo to see the TPM Module configured for your line equipment.
QHow does Oxmaint support Autonomous Maintenance without increasing supervisor workload?
Oxmaint mobile AM checklists give supervisors real-time visibility into operator task completion without manual checking. Non-compliance is visible immediately, not discovered at a weekly audit. When an operator flags an abnormality during an AM inspection, Oxmaint auto-generates a work order with the photo and description attached. Supervisor time shifts from chasing completion to managing exceptions.
Book a demo to see the AM module, or
sign up free to deploy AM checklists on your first pilot line.
QHow does Oxmaint calculate OEE automatically from work order and production data?
Oxmaint captures planned production time, downtime event records with stoppage reason codes, actual throughput versus ideal cycle time, and quality reject counts from closed work orders and operator mobile inputs. Availability, Performance, and Quality are calculated automatically per shift, per line, and per asset class. No spreadsheet formulas, no manual compilation. The OEE dashboard shows both current performance and the trend since programme launch.
Sign up free to see automated OEE in action, or
book a demo to configure OEE tracking for your specific line equipment types.
QWhat is the realistic ROI timeline for a TPM programme in an FMCG plant?
Within 90 days on a pilot line: OEE baseline visible, first kaizen actions closed, first prevented breakdown event identifiable. Within 6 months: 10 to 15% OEE improvement on the pilot line, reactive repair ratio trending down, changeover time measurably reduced. Within 14 to 18 months of plant-wide deployment: documented cases show $70,000 or more annual maintenance cost reduction and 2,400 additional production hours recovered per line.
Book a demo to model TPM ROI for your plant, or
sign up free to start your OEE baseline today.
Oxmaint TPM Module + OEE Dashboard | FMCG Manufacturing | Deploy in 14 Days
71% of FMCG Plants Claim TPM as Their Priority. Most Are Still Running at 55% OEE. Oxmaint Provides the Digital Infrastructure That Converts TPM Intent Into Measurable OEE Improvement.
8 TPM Pillars Digitised
Autonomous Maintenance Mobile Checklists
Automated OEE Calculation
Kaizen Action Tracking
IoT Condition Monitoring
SMED Changeover Tracking