An MRO base runs a shift with fifty aviation maintenance technicians. Payroll for that shift is a fixed cost. What is not fixed is how many of those hours a wrench actually touches an aircraft. Industry data — including McKinsey's 2026 analysis of the global AMT workforce — puts frontline wrench time at 15% to 45%, with an industry average around 25–35% and top-quartile MROs reaching 55% or higher. That means the difference between a good base and an average one is not more technicians. It is the same technicians producing 60% more output because a mobile CMMS killed the parts hunt, the paperwork trip, and the authorization wait. This is why airlines and MRO operators are rebuilding their productivity programs around four core metrics — wrench time, work order cycle time, first-time fix rate, and technician utilization — and running them live inside the maintenance software. Oxmaint is the aviation CMMS that captures every one of those metrics from mobile work orders, benchmarks them against industry targets, and gives the maintenance director the dashboard to move all four numbers in the right direction. Start a free Oxmaint trial to see AMT productivity metrics live on the mobile CMMS, or book a demo to see the KPI dashboard mapped to your MRO or airline operation.
Aviation · MRO Operations · AMT Productivity Software
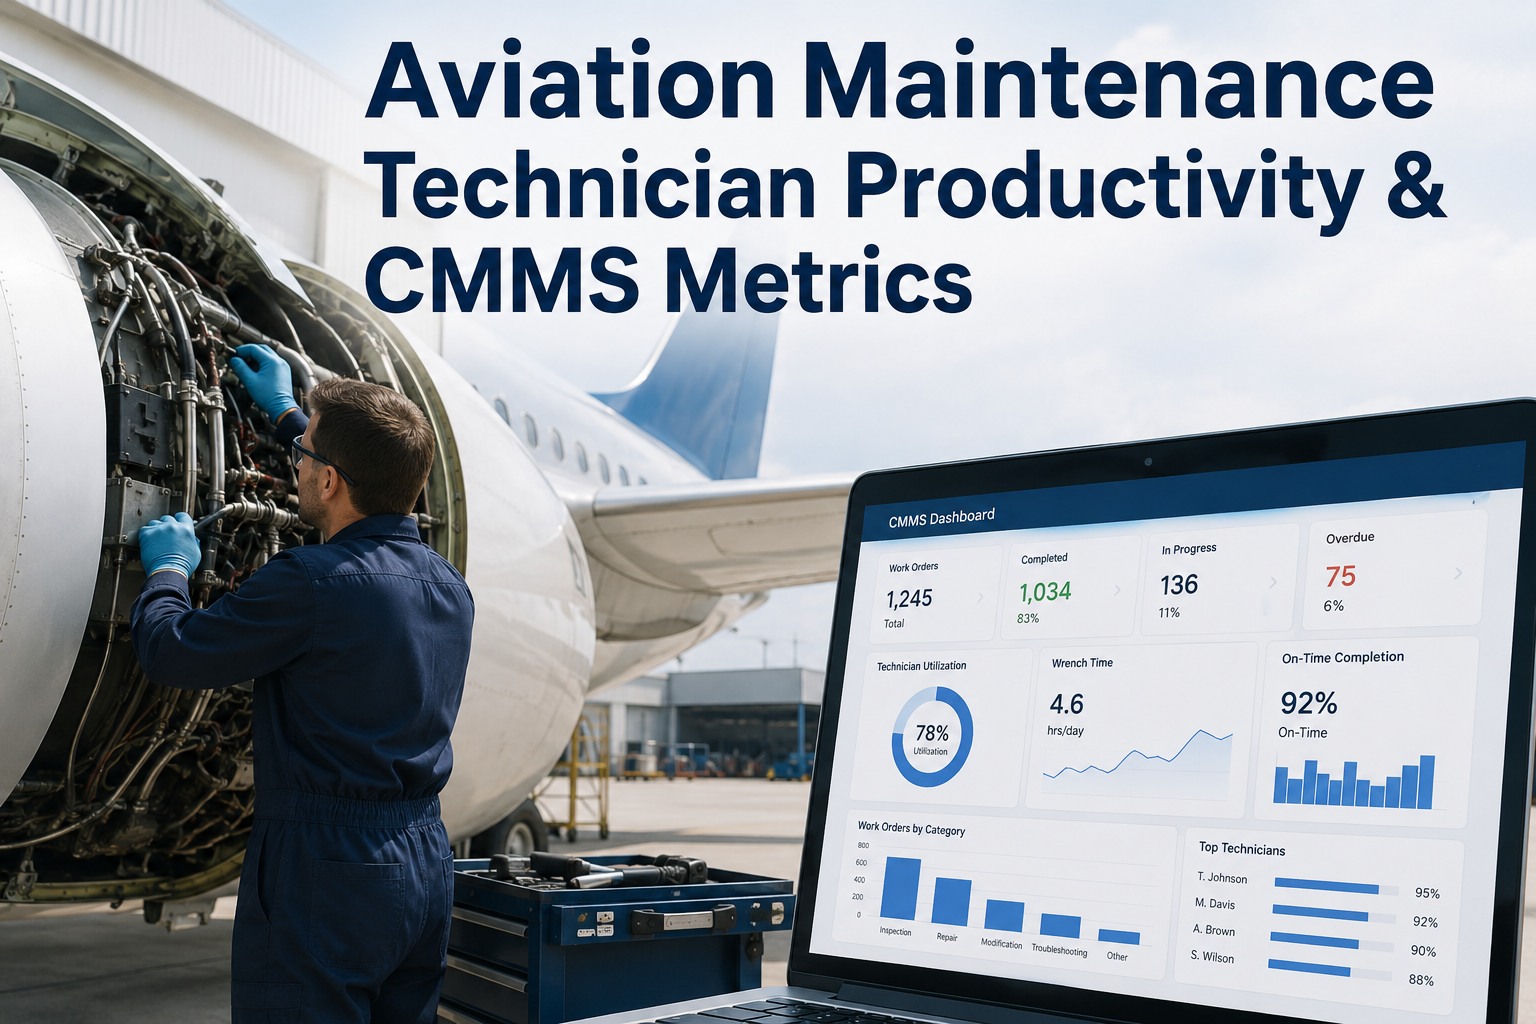
Aviation Maintenance Technician Productivity & CMMS Metrics — The 2026 Guide
The four productivity metrics every airline and MRO tracks — wrench time, work order cycle time, first-time fix rate, technician utilization — how they are calculated, what world-class targets look like, and how mobile CMMS moves each of them.
-
25–35%
industry-average AMT wrench time — world-class MROs hit 55%+
-
6.3 hrs
weekly non-productive time per technician on paper-based work orders
-
40%
faster work-order sign-off cycles once mobile CMMS replaces clipboards
-
80%
of the projected 2029 AMT shortage McKinsey says productivity gains could mitigate
The Four Core Metrics
The Only Four Numbers That Actually Measure AMT Productivity
Every aviation maintenance KPI dashboard converges on the same four metrics. Get these four right and every downstream number — cost per flight hour, AOG duration, PM compliance — moves with them. Below is each metric with its definition, industry benchmark bands, and how Oxmaint pulls it live from mobile work-order data without adding an ounce of administrative burden on the hangar floor.
Wrench Time
Percentage of shift time spent hands-on with the aircraft — excluding travel, parts collection, paperwork, and waits.
- Poor: below 20%
- Typical: 25–35%
- World-class: 55%+
Work Order Cycle Time
Total elapsed time from work order creation to technical closure — creation, authorization, execution, sign-off.
- Paper-based: baseline
- Hybrid: -15 to -25%
- Mobile CMMS: -40%
First-Time Fix Rate
Percentage of jobs completed on the first visit — no rework, no repeat visit, no return to hangar for parts.
- Poor: below 60%
- Strong: 70–75%
- Top-quartile: 80%+
AMT Utilization
Percentage of available hours a technician spends on any productive activity — includes travel and admin, unlike wrench time.
- Under-scheduled: below 65%
- Healthy: 80–85%
- Over-scheduled risk: 90%+
Utilization and productivity are not the same thing. A technician at 90% utilization with a 55% first-time fix rate is highly utilized and underproductive. Track both, and the story becomes clear.
Wrench Time Deep Dive
How the Industry Actually Ranks on Wrench Time
Wrench time is the single most diagnostic number in an MRO base. It is the ratio between direct hands-on hours and total shift hours — a technician who logs 3 hours of hands-on work on a 10-hour shift has a 30% wrench time. Every point of improvement compounds across the entire technician headcount, which is why McKinsey estimates top-quartile productivity gains could cover 80% of the projected 2029 AMT shortage. This is where your operation sits relative to the industry.
A 10-percentage-point wrench-time improvement across a 50-technician base is the equivalent of adding 5 technicians at zero additional payroll — and it typically shows up in under six months of mobile CMMS deployment.
Where the Time Actually Goes
The Other 65–75% — What Consumes Non-Wrench Time
When wrench time is low, the wrong instinct is to question technician effort. The productive question is: what is consuming the other 65–75%? A structured wrench-time study across MRO facilities points to the same six sinks every time — and every one of them is a planning, materials, or workflow gap the CMMS can close.
-
18%
Waiting for Parts
Aircraft is open, technician is on the floor, the part is on a shelf two buildings over — or worse, not on any shelf. Mobile CMMS shows parts status before the panel comes off.
-
15%
Travel & Movement
Walking between aircraft, hangar office, parts store, and tool crib. The bigger the base, the bigger the tax — and the more mobile task assignment saves.
-
12%
Paperwork & Sign-off
Handwritten task cards, transcription into back-office systems, hunt for the RII inspector. Mobile e-signature cuts this by 34% in the first month.
-
10%
Waiting for Authorization
Every serial wait state — planner approval, engineering disposition, non-conformance sign-off — burns technician time. Digital routing eliminates every one.
-
8%
Looking for Info
Trips to the office for AMM references, IPC lookups, or a previous work-order to see what was done. Mobile task cards carry every reference inline.
-
7%
Tooling & Access
Waiting for a stand to move, sharing a torque wrench across the bay, hunting for the right dolly. Small individually, big collectively.
The Compound Effect
Every 10-Point Wrench-Time Gain on a 50-Tech Base = 5 Extra Technicians for Free
The AMT workforce shortage is not going away. Airlines and MROs that solve it through productivity rather than headcount are the ones that will hold the line on cost per flight hour. Oxmaint delivers the mobile CMMS, parts visibility, and digital authorization that turn wrench-time gains into a repeatable operating model — not a one-time consulting project.
Work Order Cycle Time
Five Stages Where a Work Order Actually Loses Hours
Work order cycle time is the elapsed clock from creation to technical closure. Most maintenance directors focus on the middle — execution — because that is where the work happens. But cycle time compresses fastest at the two ends: authorization at the front and sign-off at the back. Below is a typical five-stage cycle, with the time each stage loses on paper systems and what a mobile CMMS actually recovers.
-
01
Creation & Prioritization
Ticket entered, priority assigned, routing to correct planner. Paper: hours. Mobile: seconds — digital creation from defect capture on the tablet.
-
02
Authorization & Assignment
Planner review, skill match, availability check, dispatch. Paper: half a shift. Mobile: instant skill-based auto-routing.
-
03
Execution & Documentation
Hands-on work, in-line photo capture, part-consumption logging, discrepancy notes. Paper: transcription later. Mobile: at the point of work.
-
04
Inspection & RII Sign-off
Required Inspection Items signed by independent inspector. Paper: physical hunt for inspector. Mobile: routed notification with e-signature.
-
05
Closure & Records Feed
Technical closure, actual-vs-planned hours logged, KPIs updated, records archived. Paper: back-office keying. Mobile: automatic.
First-Time Fix Rate
The Metric That Separates Good MROs From the Rest
A first-time fix rate above 80% is what separates top-quartile MROs from the industry average. It compounds every other metric — reduces cycle time, cuts AOG duration, protects wrench time from being consumed by repeat visits. Four disciplines drive the number up, and every one is a CMMS configuration problem, not a workforce problem.
-
Driver 01
Skill-Based Assignment
Routing every work order to a technician whose certifications match the task type. CMMS-enforced skill match improves first-time fix rates by 18–25%.
-
Driver 02
Complete Asset History On Hand
Previous defects, open discrepancies, applied ADs — visible on the mobile task card before the panel comes off. No repeat root causes, no missed context.
-
Driver 03
Parts Confirmed Before Dispatch
CMMS-integrated inventory verifies parts are on-hand before the technician walks to the aircraft. No opened panels waiting on a missing bearing race.
-
Driver 04
Mandatory Step Completion
Digital task cards do not let a technician close a step without completing every required check. No skipped verifications, no repeat callouts.
Before / After Mobile CMMS
What Actually Moves When Clipboards Retire
The productivity gains attributed to mobile CMMS are not marketing numbers — they are the measured deltas across MRO operations that have made the transition. This is what the four core metrics look like on a paper-and-clipboard baseline versus after a mobile CMMS like Oxmaint goes live.
Paper / Clipboard Baseline
Before
- Wrench time: 25–35%
- 6.3 hours weekly non-productive per technician
- Supervisor spends 40 min/shift walking the floor for status
- 1 transcription error per 300 keystrokes
- First-time fix rate typically 55–65%
- 4.8× cost multiplier on every unplanned work order
Mobile CMMS in Place
After
- Wrench time: 45–55% within 6 months
- Non-productive time cut by 3–4 hours per technician
- Supervisor sees live status without leaving the office
- Transcription errors near zero — capture at source
- First-time fix rate rises to 75–85%
- Planned-work ratio flips from reactive to preventive
Built for Aviation Maintenance
How Oxmaint Software Moves All Four Metrics at Once
-
Live KPI Dashboard
Wrench Time, Cycle Time, FTFR & Utilization Live
All four core metrics calculated live from mobile work-order data. Filter by base, aircraft type, shift, or technician. The number a Maintenance Director walks into a review with — not extracted after the fact.
-
Mobile Task Cards
Every Task Card on a Tablet at the Aircraft
AMM references, IPC diagrams, previous defect history, and parts status attached inline. Offline-capable for hangar dead zones. FAA and EASA electronic-records compliant.
-
Skill Routing
Skill-Based Auto-Assignment
Work orders route only to technicians whose certifications match. First-time fix rate rises 18–25% on skill-matched assignment alone — with the audit trail every ramp check demands.
-
Parts Integration
Parts Verified Before Panel Comes Off
CMMS-integrated inventory confirms every required part on-hand at work-order creation. Aircraft-on-ground events from missing parts drop sharply within the first quarter.
-
Digital Sign-off
E-Signature and RII Routing Built In
RII inspectors receive routed notifications. LAME sign-offs carry timestamp, license reference, and authorization scope. Task sign-off cycles run 34% faster than paper.
-
Fleet Counter Data
Flight-Hour and Cycle Data Drive PM Generation
Live flight data auto-generates PM work orders on hour, cycle, and calendar triggers. No manual entry. Planned-vs-reactive ratio flips as PM compliance climbs above 95%.
Measured Outcomes
What Airlines and MROs Gain With Oxmaint on the Floor
-
15–35%
Productivity Uplift
McKinsey benchmarks the productivity contribution of digital and AI solutions to AMT operations at 15–35% — inside the first year of deployment.
-
40%
Faster Work-Order Sign-off
Mobile e-signature workflows and inline sign-off routing cut task closure cycles 34–40% versus paper.
-
25–35%
Fewer Preventable AOG Events
Digital work-order management with parts reservation and defect-history visibility reduces AOG groundings by 25–35% in year one.
-
$2.1M
Annual Savings, Mid-Size MRO
Average measured annual savings per mid-size MRO on labor efficiency, error reduction, and administrative overhead elimination.
Frequently Asked
AMT Productivity & CMMS Questions
What is a realistic wrench time target for a well-run MRO base?
Top-quartile MRO operations hit 55–65% wrench time. Industry average sits at 25–35%. A move from 30% to 50% wrench time is achievable inside six months of a mobile CMMS rollout — and functionally equivalent to adding two technicians for every ten already on payroll. Sign up for Oxmaint to see wrench time tracked live from mobile work orders.
How is wrench time calculated in Oxmaint?
Direct hands-on hours divided by total available shift hours. Mobile task cards capture start and stop times per task; the CMMS aggregates by technician, shift, or base and benchmarks against industry ranges. No stopwatch, no observation study — the data comes from the task card itself.
What is the difference between utilization and productivity?
Utilization measures the share of available hours a technician spends on productive activity — including travel and paperwork. Productivity measures the output of that activity. A technician at 90% utilization with a 55% first-time fix rate is highly utilized and underproductive. Both belong on the KPI dashboard. Book a demo to see the full aviation KPI dashboard in Oxmaint.
How fast do MROs see measurable productivity gains from mobile CMMS?
Task sign-off cycles show measurable improvement inside 30 days. Wrench time typically climbs 10–15 percentage points inside 6 months. Full payback on the software investment averages 8–14 months across mid-size MROs. Sign up for Oxmaint to start the 30-day baseline capture.
Measure · Move · Sustain
The AMT Shortage Will Not Be Solved by Hiring. It Will Be Solved by Productivity.
Wrench time. Cycle time. First-time fix rate. Utilization. Four numbers, one dashboard, one mobile CMMS that captures them live from the hangar floor. Airlines and MROs running Oxmaint move all four at once — and hold the gains as the standard operating model, not a project.