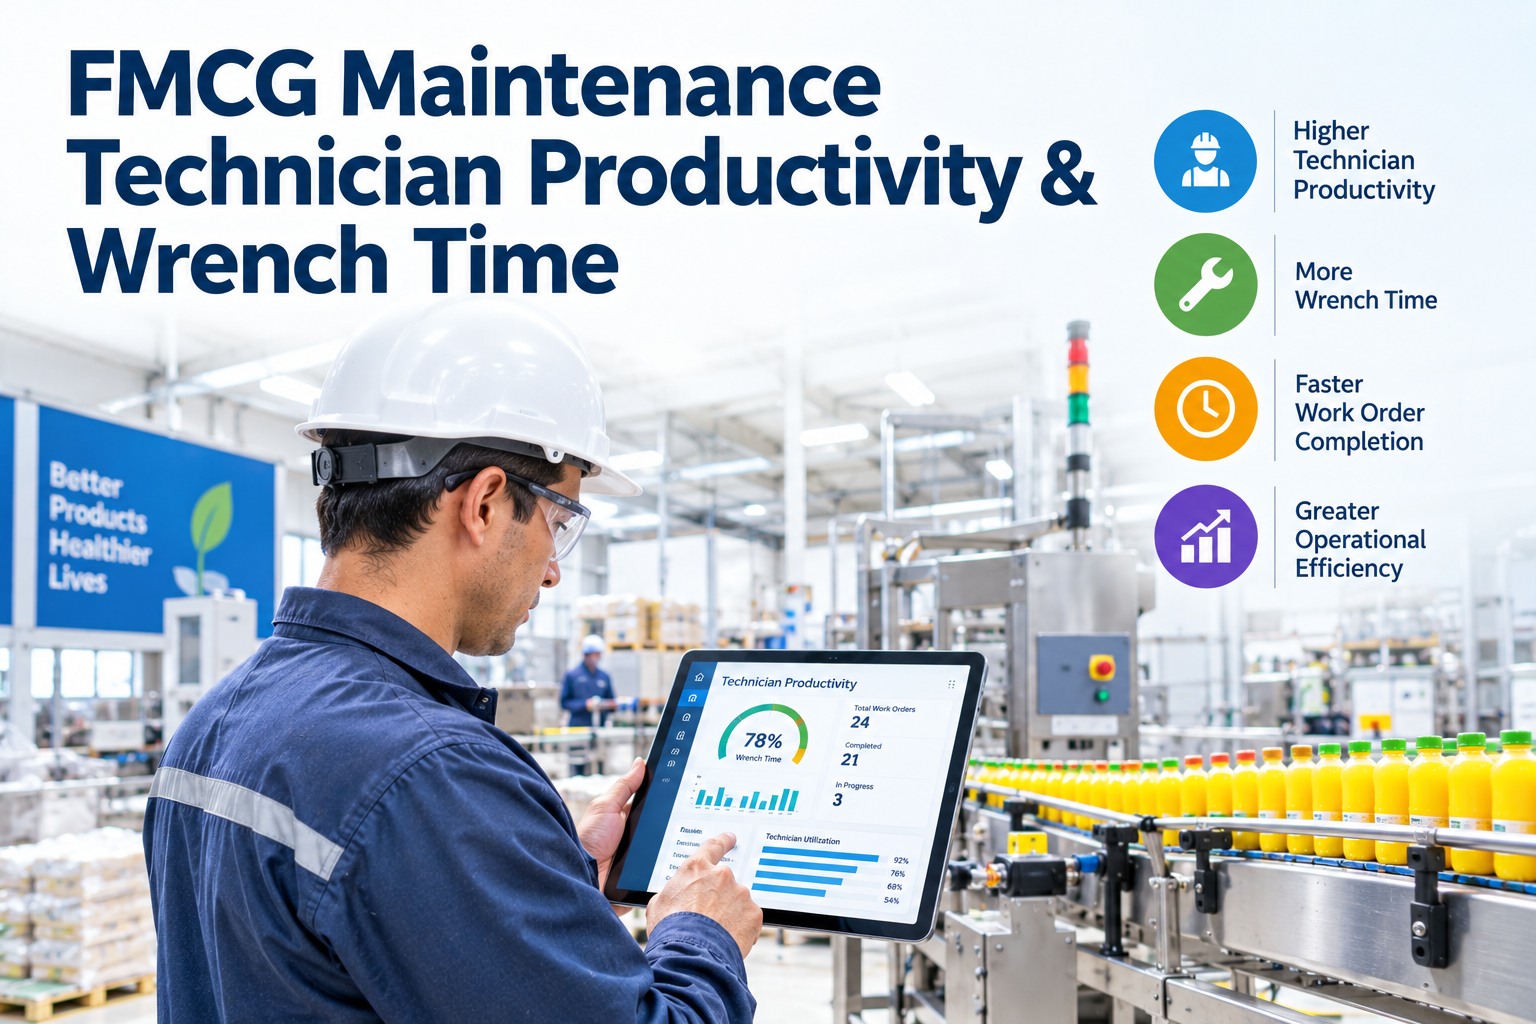
Here's a number that should stop any FMCG maintenance manager cold: on a typical team, technicians spend only 30–40% of their paid shift actually turning wrenches. The other 60–70% goes to walking to the store room, waiting for parts, hunting for the asset manual, filling in paperwork, and figuring out what the job even is. That isn't a people problem — your technicians are working the whole shift. It's a systems problem, and it means you're paying for a ten-person team while getting the output of three or four. The good news is that this is the most recoverable capacity in the entire plant: lifting wrench time toward 55–65% is the equivalent of hiring several technicians without adding a single one to payroll. This guide covers FMCG maintenance technician productivity and wrench time — where the hours actually go, the five levers that recover them, and how a mobile CMMS turns the gains into something that sticks. Start free on OxMaint or book a demo.
FMCG Maintenance Technician Productivity & Wrench Time
You already employ a hidden second workforce — it's the 60% of paid hours nobody spends on a wrench.
30–40%
typical wrench time — the share of a paid shift spent on actual hands-on work
55–65%
the achievable target with CMMS workflow changes — no added headcount
+57%
productivity gain going from 35% to 55% wrench time — like 500 → 785 work orders
~1 hr/day
per technician recovered by mobile work-order close alone — multiply by your team
Where the Shift Actually Goes
Before you can recover wrench time, you have to see where it leaks. A work-sampling study of almost any unoptimized FMCG maintenance team lands in roughly the same place: a third of the shift on tools, and the rest scattered across a handful of predictable, fixable wastes. In FMCG the leaks bite harder than most industries — high-speed lines mean every minute a tech spends walking to the crib is a minute of packaged product not coming off the line.
Waiting & instructions · ~12%
These proportions are illustrative of a typical baseline — your real split comes from a work-sampling study. But the pattern holds everywhere: the single biggest block after wrench time is almost always travel and parts, and those two are the most fixable.
The Wrench Time Benchmark Ladder
Wrench time isn't pass/fail — it's a ladder, and knowing which rung you're on tells you how much capacity is sitting unclaimed. These are the widely used industry benchmarks. Most FMCG plants start lower than managers expect.
30–35%
Typical / Unoptimized
Reactive-heavy, paper work orders, no kitting. Two-thirds of paid labour producing no direct maintenance value. Where most teams sit before they measure.
45%
Good
Planning and mobile execution in place, some kitting. The reactive-to-planned shift is underway and the capacity gain is already visible on the board.
55–65%
World-Class
Planned, kitted, mobile, standardised. Techs arrive at a job with parts, instructions, and history in hand. The realistic ceiling for general FMCG manufacturing.
A useful rule of thumb: every 5-point gain in wrench time on a 10-person team adds roughly half a full-time technician of productive capacity — recovered from hours you're already paying for.
The Five Levers That Recover Wrench Time
Each major waste category maps to a specific, proven intervention. You don't fix wrench time with a motivational speech — you fix it by removing the friction between a technician and the job. These five levers stack, and the first two carry most of the gain.
01
Parts Kitting & Pre-Staging
Kills: parts & tools waste
Pre-stage every part, tool, and consumable for a job in one kit before dispatch. The tech picks up one container and goes — no repeat trips to the crib. With most delays caused by missing parts, this is the single most reliable lever.
02
Mobile Work Orders
Kills: paperwork & admin
Receive the job, read instructions, see asset history, log time, capture photos, and close out — all from a phone on the floor. The trips to the office and the paper write-ups simply disappear, recovering close to an hour per tech per day.
03
Planned vs Reactive Work
Kills: waiting & improvising
Planned jobs run wrench times 20–30 points higher than reactive ones, because the improvising and return trips are engineered out in advance. Every reactive job converted to a planned one is executed under better conditions.
04
QR Asset Tags & Digital History
Kills: information hunting
Scan the asset, get its manual, schematics, and full repair history instantly — no walk to the binder, no calling a senior tech. Especially valuable in FMCG plant rooms where the answer used to live in one person's head.
05
Standard Work & Pre-Assigned Jobs
Kills: morning confusion & travel
Start every shift with jobs already assigned and sequenced by location, so techs aren't waiting for direction or crossing the plant twice. Pre-assigned work orders alone can lift wrench time noticeably from day one.
Recover the Capacity You're Already Paying For — Free Forever
Sign up on OxMaint's free forever plan and put work orders, asset history, and kitting on every technician's phone — mobile execution, QR scanning, offline mode for plant rooms with no signal, and a manager dashboard that tracks wrench time weekly. No card, no time limit.
The Math That Makes the Case
Wrench time is the rare productivity metric where the business case writes itself — because the capacity already exists on your payroll, just unclaimed. Here's what a modest, achievable improvement looks like in real terms.
35% → 55%
a realistic wrench-time lift over ~12 months
=
+57%
productivity — like going 500 → 785 work orders a month
=
~2+ techs
of capacity added at zero additional labour cost
One honest caveat: wrench time is a team-and-system diagnostic, not an individual scorecard. Used to rank or micromanage technicians it breeds resentment and gaming. Used to find where the system wastes their time, it's one of the most powerful levers in maintenance.
How OxMaint Lifts FMCG Wrench Time
Every wrench-time lever depends on the technician having what they need at the job instead of walking to get it — and that's exactly what a mobile CMMS delivers. OxMaint puts the whole work-order lifecycle on the floor and measures the gain, so the improvement is both real and visible.
Mobile
Whole Job on a Phone
Dispatch, instructions, asset history, checklists, photos, and close-out on the technician's device — with offline mode for basements and plant rooms with no signal.
Kitting
Parts Staged Before Dispatch
Bill of materials tied to the work order so parts are pulled and kitted before the tech leaves — ending the repeat trips to the store room that kill momentum.
Scan
QR Asset Access
Scan a tag to pull the asset's manual, schematics, and full history on the spot — no walk to the office, no hunt for the one person who remembers.
Plan
Reactive to Planned
PM scheduling and weekly planning shift work from firefighting to planned jobs — the 20–30 point wrench-time difference between the two.
Assign
Shift Starts Sequenced
Jobs pre-assigned and ordered by location so techs start with purpose and cross the plant once, not three times.
Measure
Wrench Time on a Dashboard
Track wrench time weekly from the manager view — see which waste category is the next opportunity, and prove the capacity recovered.
Turn Two-Thirds Wasted Into Capacity Recovered
Free forever plan — no card, no time limit. Give every FMCG technician mobile work orders, kitted parts, and instant asset history — and watch wrench time climb toward world-class without a single new hire. Or book 30 minutes and we'll run the numbers on your team.
Frequently Asked Questions
What is wrench time and what's a good benchmark?
Wrench time is the percentage of a technician's paid shift spent on actual hands-on maintenance — excluding travel, waiting for parts, searching for tools, and paperwork. Industry benchmarks put roughly 35% as average, 45% as good, and 55% or higher as world-class. Most FMCG plants start around 30–40% before they optimize.
How can we raise wrench time without hiring more technicians?
By removing the friction between the technician and the job. Kit parts before dispatch, put work orders and asset history on a phone, convert reactive jobs to planned ones, use QR tags for instant information, and pre-assign the shift. These recover hours you're already paying for — going from 35% to 55% is roughly a 57% productivity gain, the equivalent of adding technicians at no labour cost.
Which single change gives the biggest wrench-time gain?
For most teams it's a tie between kitting and mobile work orders. Kitting attacks the parts-and-tools waste that causes the majority of job delays; mobile execution removes the office trips and paperwork. Together they're the combination most cited for lifting wrench time toward and past 50%.
Why does wrench time matter more in FMCG specifically?
Because FMCG runs high-speed lines with tight maintenance windows and hygiene constraints, so every minute a technician spends walking or waiting during a line stop is packaged product not being made. The waste that a slower industry might absorb shows up directly in throughput, making recovered wrench time convert straight into output.
Is it fair to measure individual technicians on wrench time?
No — and doing so backfires. Wrench time is a diagnostic of the system, not a performance score for individuals. Used to rank people it drives resentment and gaming; used to find where the workflow wastes their time, it's a powerful improvement tool. Measure the team and the process, and let the CMMS data show where the friction is.
Start free or
book a demo.