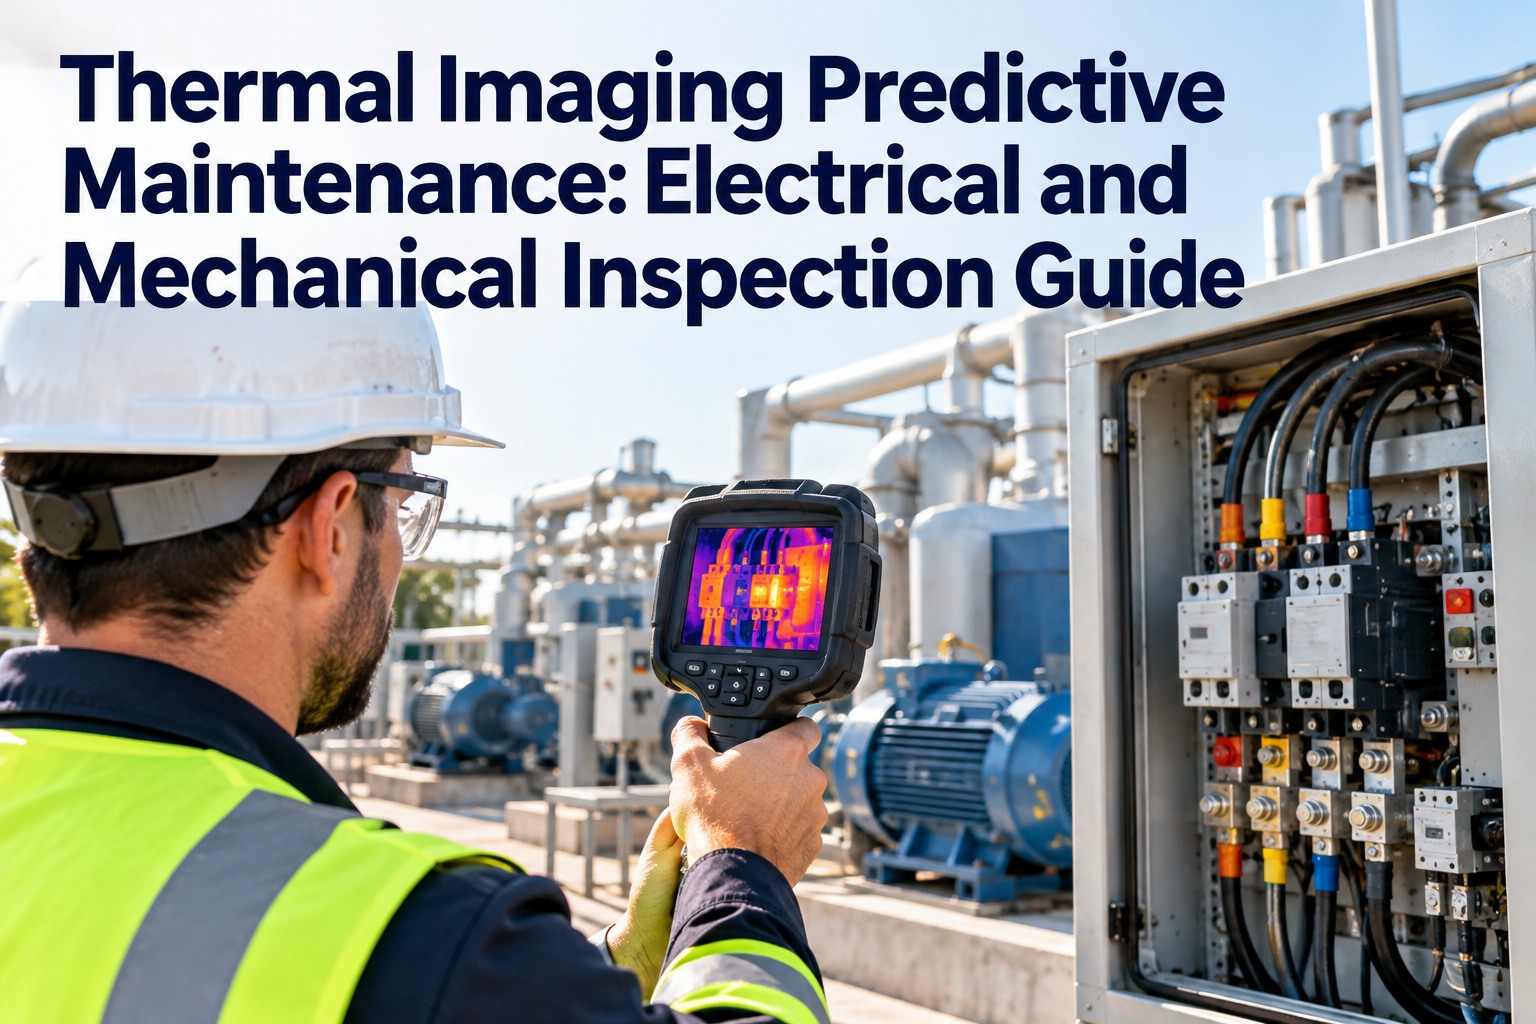
A 200-amp electrical panel running 12 degrees Celsius above normal operating temperature costs $840 per month in energy waste before the connection failure — the thermal signature appears 90 days before catastrophic failure, visible only through infrared inspection. In manufacturing and commercial facilities, 43 percent of unplanned equipment shutdowns trace back to electrical component failures that showed heat signatures weeks before breakdown. The equipment was running. The panels were energized. The motors were operational. The failure was building invisibly — in thermal patterns that standard visual inspection cannot detect. That gap is exactly what thermal imaging maintenance closes. Book a demo to see how infrared inspection integrates with your preventive maintenance program or start a free trial to capture thermal data directly into your asset maintenance records.
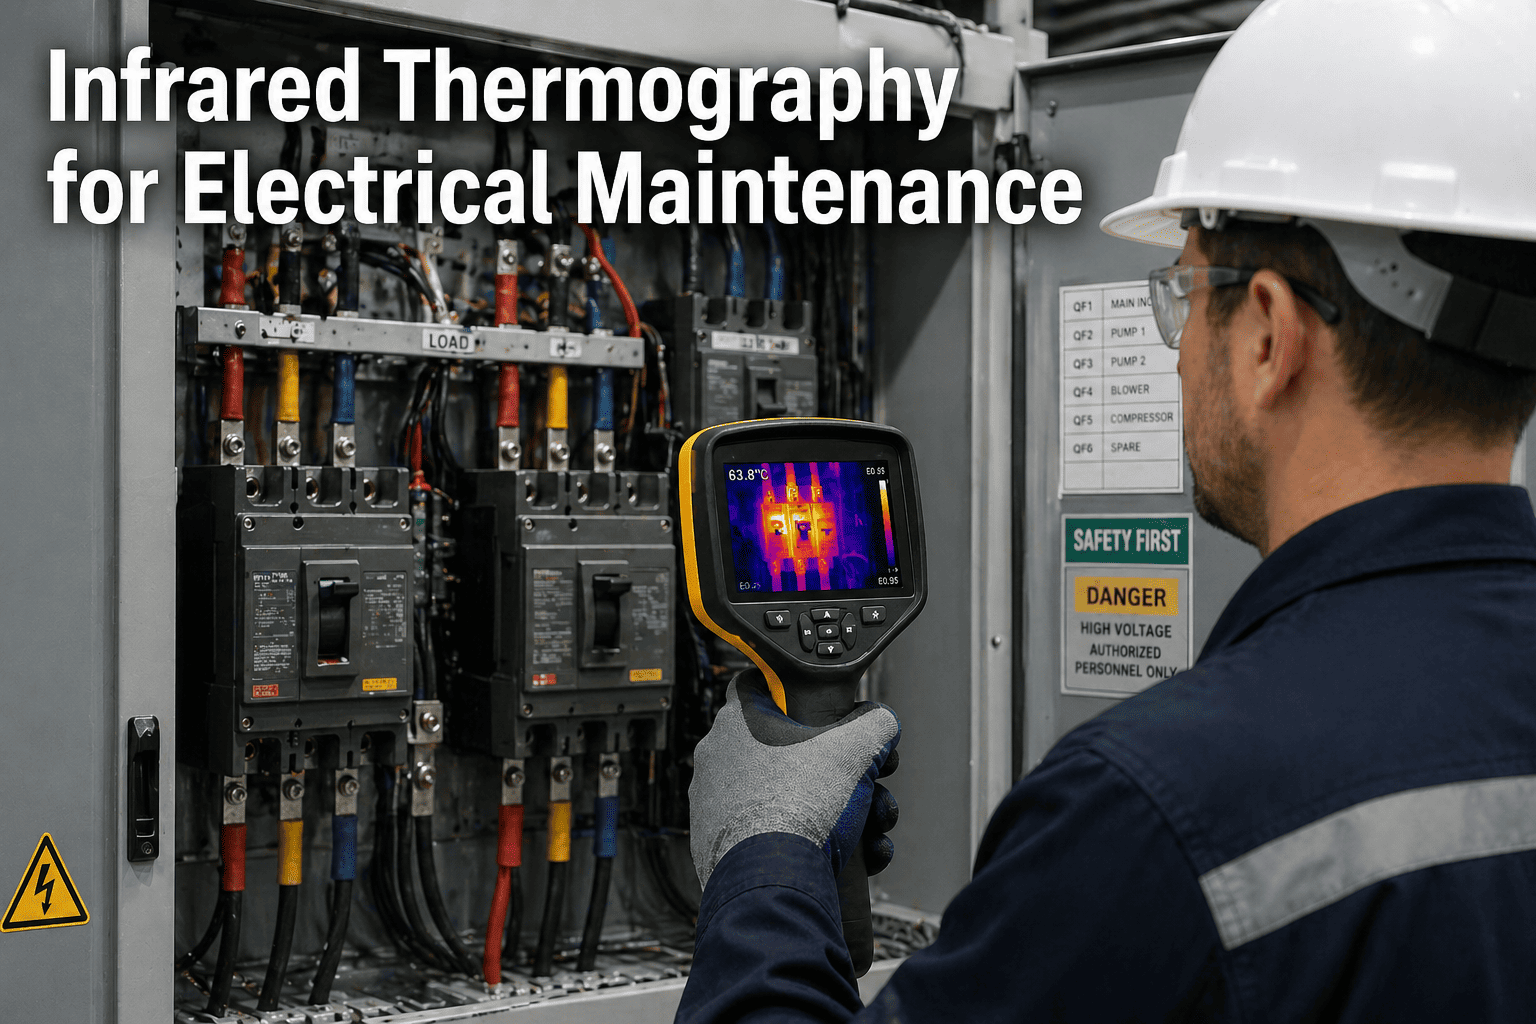
Thermal imaging maintenance uses infrared cameras to detect temperature anomalies in electrical panels, motor connections, circuit breakers, and power distribution systems before visual damage appears. Hot spots indicate loose connections, overloaded circuits, imbalanced phases, or component degradation. Digital CMMS platforms capture thermal images directly at the asset, link temperature readings to equipment records, and schedule corrective maintenance based on thermal severity ratings. This transforms electrical inspection from calendar-based guesswork to condition-based precision. Ready to see thermal data integrated with your maintenance workflow? Book a demo or start a free trial today.
What Thermal Imaging Detects in Electrical Systems
Infrared cameras visualize heat patterns invisible to standard inspection — revealing electrical failures building beneath panel covers, inside motor terminal boxes, and across distribution switchgear weeks before breakdown. Each thermal anomaly type indicates a specific failure mode and maintenance intervention. Want to standardize thermal inspection across your facility? Book a demo or start a free trial to digitize your thermography program.
Panel bus bars, circuit breaker terminals, motor terminal blocks, and power distribution lugs show elevated temperatures when connection torque degrades. Resistance increases, heat builds, failure accelerates.
Circuit breakers, conductors, and distribution panels carrying current beyond design capacity exhibit sustained elevated temperatures. Load redistribution required before insulation degradation begins.
Three-phase systems show unequal phase temperatures when loads are unevenly distributed or connections degrade on single phases. Neutral conductor overheating follows phase imbalance.
Capacitors, contactors, relays, and motor windings show progressive temperature increase as internal components age or fail. Comparative thermal analysis identifies failing units before total breakdown.
Neutral conductors, transformers, and distribution panels serving variable frequency drives or non-linear loads exhibit elevated temperatures from harmonic current. Requires power quality analysis and filtering.
Cable insulation breakdown, motor winding insulation degradation, and transformer internal faults create localized hot spots distinct from connection or load issues. Immediate electrical testing required.
Capture Thermal Data at the Asset — Not in Disconnected Files
Digital maintenance systems link infrared images, temperature readings, and thermal severity ratings directly to equipment records. Each thermal inspection becomes a permanent asset history entry — not a photo buried in email. Book a demo to see thermal imaging integrated with your CMMS or start a free trial today.
Thermal Imaging Inspection Workflow for Electrical Systems
A structured thermography program follows a repeating cycle — baseline thermal imaging establishes normal operating temperatures, periodic inspections detect temperature changes, severity ratings trigger maintenance actions, and corrective work returns equipment to baseline. Digital systems automate this workflow from inspection scheduling to work order creation. See how thermal workflows integrate with your existing maintenance process — book a demo or start a free trial to test it yourself.
Capture infrared images of all electrical panels, motor control centers, distribution switchgear, and power equipment under normal operating load. Record temperature values for each connection point, circuit breaker, and component. Establish baseline thermal profile for comparative analysis.
Quarterly or semi-annual thermal scans compare current temperatures to baseline. Identify components showing temperature increase, connection points exceeding normal operating range, and equipment developing hot spots. Digital systems flag deviations automatically.
Classify thermal anomalies by temperature differential and failure risk. Critical findings (15°C+ differential) trigger immediate maintenance. Major findings (10-15°C differential) schedule within 30 days. Minor findings (5-10°C differential) monitor on next cycle. Digital systems auto-assign severity and priority.
Digital work orders created from thermal findings include infrared image, temperature reading, severity rating, and recommended corrective action. Technicians access thermal data on mobile, complete repairs, and capture post-repair thermal verification. Equipment returns to baseline temperature range.
Electrical Hot Spot Detection: Thermal Imaging vs Visual Inspection
Visual inspection detects electrical failures after physical damage appears — discoloration, melting, arcing marks, or smoke. Thermal imaging detects failures 60 to 90 days earlier when temperature patterns change but visual damage has not yet occurred. This lead time difference is the economic value of thermography programs.
Critical Electrical Assets Requiring Thermal Imaging
Bus bars, main breakers, feeder connections, and phase conductors. Failure causes facility-wide shutdown.
Motor starters, contactors, overload relays, and control circuit connections serving production equipment.
Power connections to motors over 50 HP. Connection failures cause motor burnout and production loss.
High voltage connections, transformer terminals, and distribution switchgear. Critical infrastructure with long lead times for replacement.
Lighting distribution panels, circuit breakers, and branch circuit connections. Lower criticality but high failure frequency.
Uninterruptible power supply connections, battery terminals, and DC distribution. Connection resistance causes battery performance degradation.
Schedule Thermal Inspections Based on Asset Criticality — Automatically
Digital CMMS platforms generate thermography work orders based on equipment criticality, inspection frequency, and last thermal scan date. Critical assets inspected quarterly, standard assets annually — without manual calendar management. Book a demo to configure thermal inspection scheduling for your facility or start a free trial to test it.
Thermal Imaging Results from Manufacturing and Commercial Facilities
These outcomes represent thermography programs implemented in industrial and commercial facilities where electrical failures previously caused unplanned downtime and emergency repair costs. Ready to implement thermal imaging in your maintenance program? Book a demo or start a free trial today.
Integrating Thermal Imaging with Digital Maintenance Management
Thermal cameras detect hot spots. CMMS platforms turn those detections into maintenance actions. The integration captures infrared images at the asset, links temperature data to equipment history, auto-generates work orders from severity ratings, and tracks thermal trends over time. This is how thermography becomes preventive maintenance — not just inspection reports.
Scan asset QR code, capture infrared image, record temperature reading, and assign severity rating — all in the CMMS mobile app at the equipment location. No photo transfers or manual data entry.
Thermal image and temperature data linked to equipment asset record automatically. Historical thermal readings create temperature trend charts showing degradation patterns over time.
Severity ratings trigger work order generation automatically. Critical findings create immediate-priority work orders. Major findings schedule within 30 days. Minor findings flag for next inspection cycle.
After corrective maintenance, technician captures verification thermal scan showing temperature returned to baseline. Before/after thermal images archived in work order history for compliance documentation.
Thermal Imaging Best Practices for Electrical Inspection
Electrical connections only show thermal signatures when carrying current. Schedule thermal scans during normal operating hours when equipment runs at typical load levels — not during shutdowns or light-load periods.
Initial thermal survey creates reference temperatures for all equipment under normal conditions. Subsequent inspections compare to baseline — identifying temperature increases that indicate developing problems.
Compare similar components to identify outliers. Three-phase connections should show equal temperatures. Parallel conductors should match. Circuit breakers on the same panel should be similar. Hot outliers indicate problems.
Capture ambient temperature, load level, and environmental conditions during each thermal scan. Temperature readings are relative to conditions — winter inspections show different absolute values than summer inspections.
Use industry-standard severity ratings for temperature differentials. NFPA 70B and NETA standards provide guidance on temperature rise classifications and recommended response times for electrical thermal anomalies.
Single thermal readings identify current problems. Temperature trends over multiple inspection cycles predict future failures. Digital systems chart thermal history automatically, showing degradation patterns developing over months.
Frequently Asked Questions
Detect Electrical Failures 90 Days Before Breakdown
Thermal imaging transforms electrical maintenance from reactive emergency repair to proactive condition-based intervention. Digital maintenance platforms capture infrared images at the asset, link temperature data to equipment records, auto-generate work orders from thermal findings, and track degradation trends over time. This is predictive maintenance built on thermal intelligence — not calendar guesswork. Book a 30-minute demo to see thermal imaging integrated with your maintenance workflow, or start a free trial to test it at your facility.