Your cooling tower is quietly telling you it's getting sick weeks before the chiller starts struggling and the message is written in one number almost nobody tracks: approach temperature. Approach is the gap between the water leaving your tower and the ambient wet-bulb temperature, and it's the single most sensitive leading indicator of tower health there is. When approach creeps up 2°F, a 500-ton chiller loses roughly 6–8% of its efficiency — energy you're paying for in every kilowatt-hour, long before anyone logs a fault. Fouling, scale, drift and airflow loss all announce themselves through rising approach first. This 2026 guide explains how to calculate approach, why it predicts efficiency loss so reliably, and how OxMaint's maintenance management software turns a rising trend into a work order before the energy bill notices. Start free or book a demo.
Facilities · Cooling Towers · Approach Temperature KPI · 2026
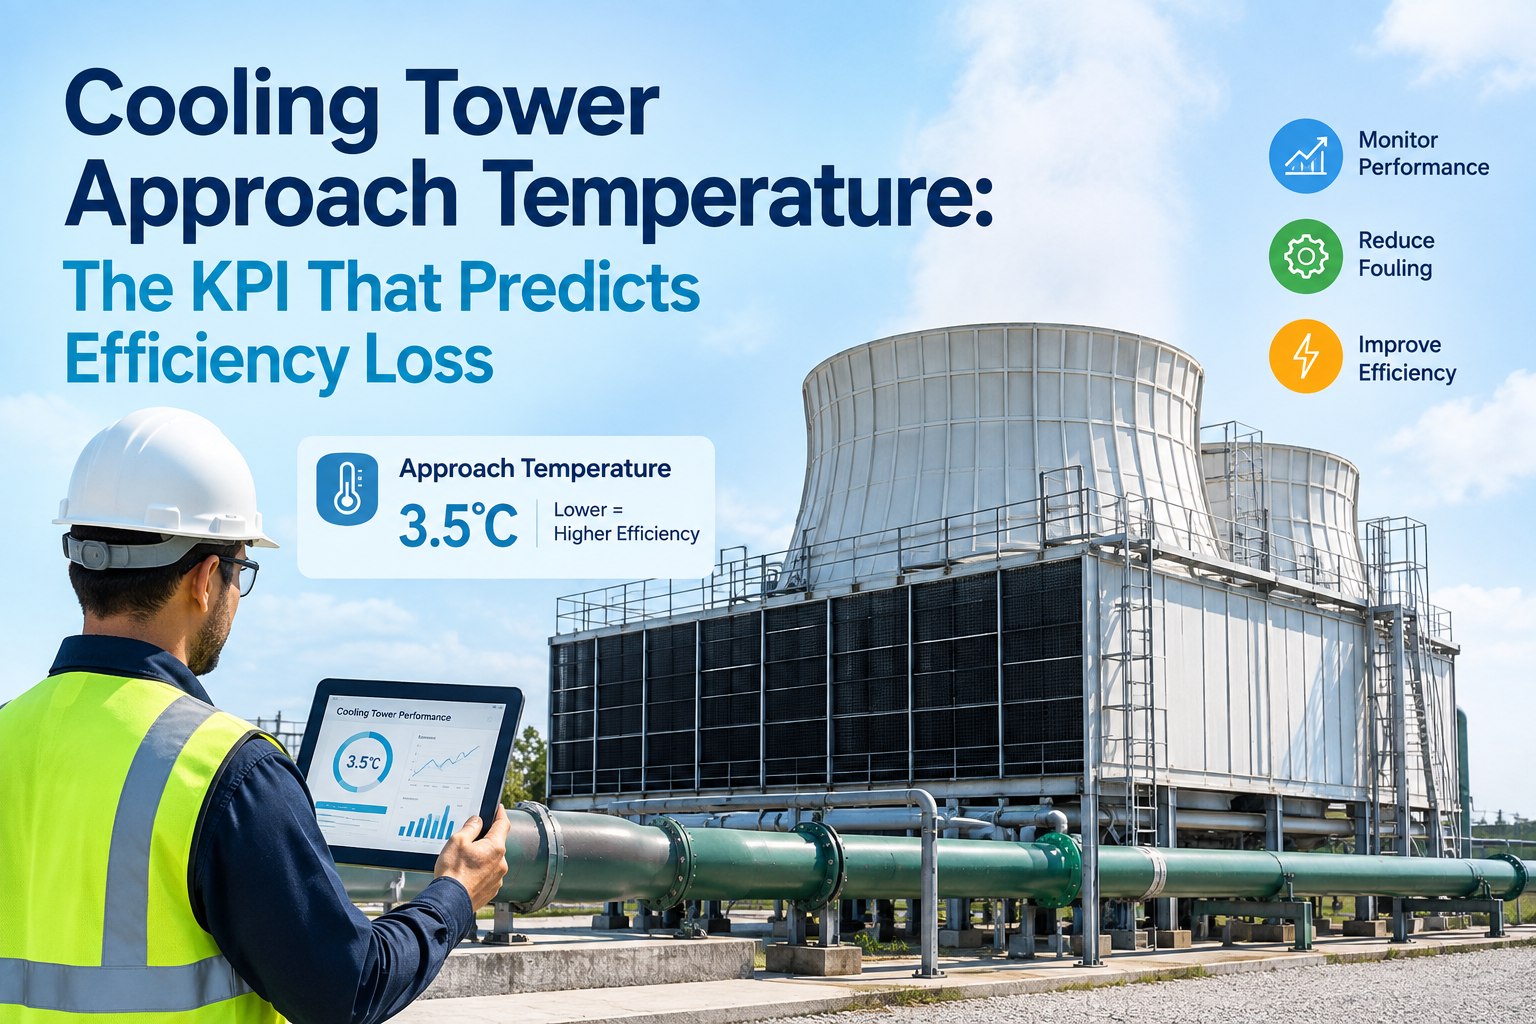
Cooling Tower Approach Temperature: The KPI That Predicts Efficiency Loss
Approach is the earliest, most sensitive signal of tower health. A 2°F rise can cost a 500-ton chiller 6–8% efficiency — weeks before a fault appears. Track it, and you catch fouling and drift while they're still cheap to fix.
What "approach" actually is
Wet-bulb temp
75°F
The physical floor — the tower can't cool below this
Cold water out
82°F
What the tower actually delivers to the chiller
Approach = cold water temp − wet-bulb temp. A tight approach (small gap) means a healthy, efficient tower. A widening gap is the first sign something's wrong — and it moves before any alarm does.
Why Approach Predicts Efficiency Loss So Well
Approach is a leading indicator, not a lagging one — it degrades first, while the symptoms downstream take weeks to surface. That's what makes it worth tracking above every other tower metric. Sign up free and OxMaint watches the trend so the early signal never gets missed.
It moves before the fault
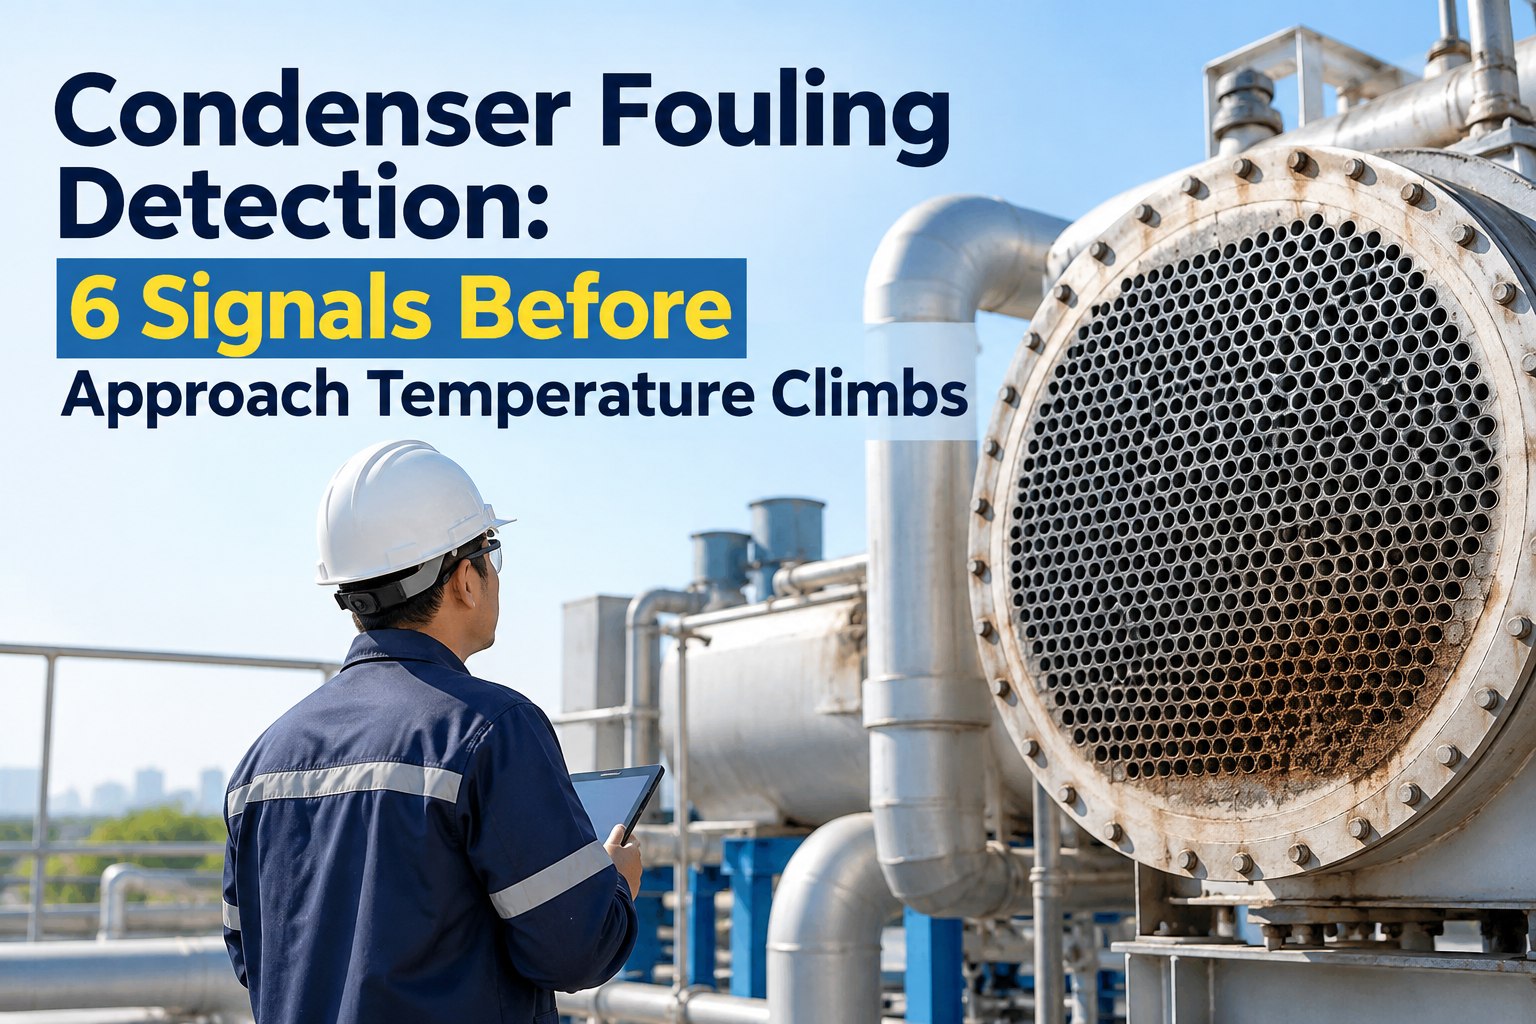
Fouling and scale raise approach gradually — the number drifts up for weeks before anything trips an alarm or a technician notices.
It's a direct efficiency proxy
Warmer water to the chiller forces it to work harder for the same cooling. Approach and chiller energy draw rise together, tightly.
It self-corrects for weather
Because it's measured against wet-bulb, a hot day doesn't fake a problem. A rising approach is real degradation, not just summer.
It's cheap to measure
Two temperatures — cold water out and wet-bulb — give you the most predictive tower KPI there is. No exotic sensors required.
The Cost of a Rising Approach
The reason approach deserves a place on your dashboard is money. Small degrees translate into real efficiency loss on a big chiller — here's the scale of it. Book a demo to model it on your plant.
Baseline
Design efficiency
+2°F approach
~6–8% efficiency lost
+4°F approach
Loss compounds, energy climbs
+6°F approach
Serious capacity & cost penalty
Figures are illustrative of the well-documented relationship on a ~500-ton chiller — the exact numbers depend on your plant, but the direction is universal: every degree of approach you let slip is efficiency you're buying back at the meter.
What Drives Approach Up — and the Fix
A rising approach is a symptom; these are the four causes behind it, each with the maintenance action that brings it back down. Read approach as the alarm, then look here for the source. Start free and OxMaint links the trend to the right PM automatically.
Scale & fouling on fill
▶
Water treatment check, fill cleaning/replacement
Poor water distribution
▶
Clear nozzles, inspect spray pattern & basin
Reduced airflow
▶
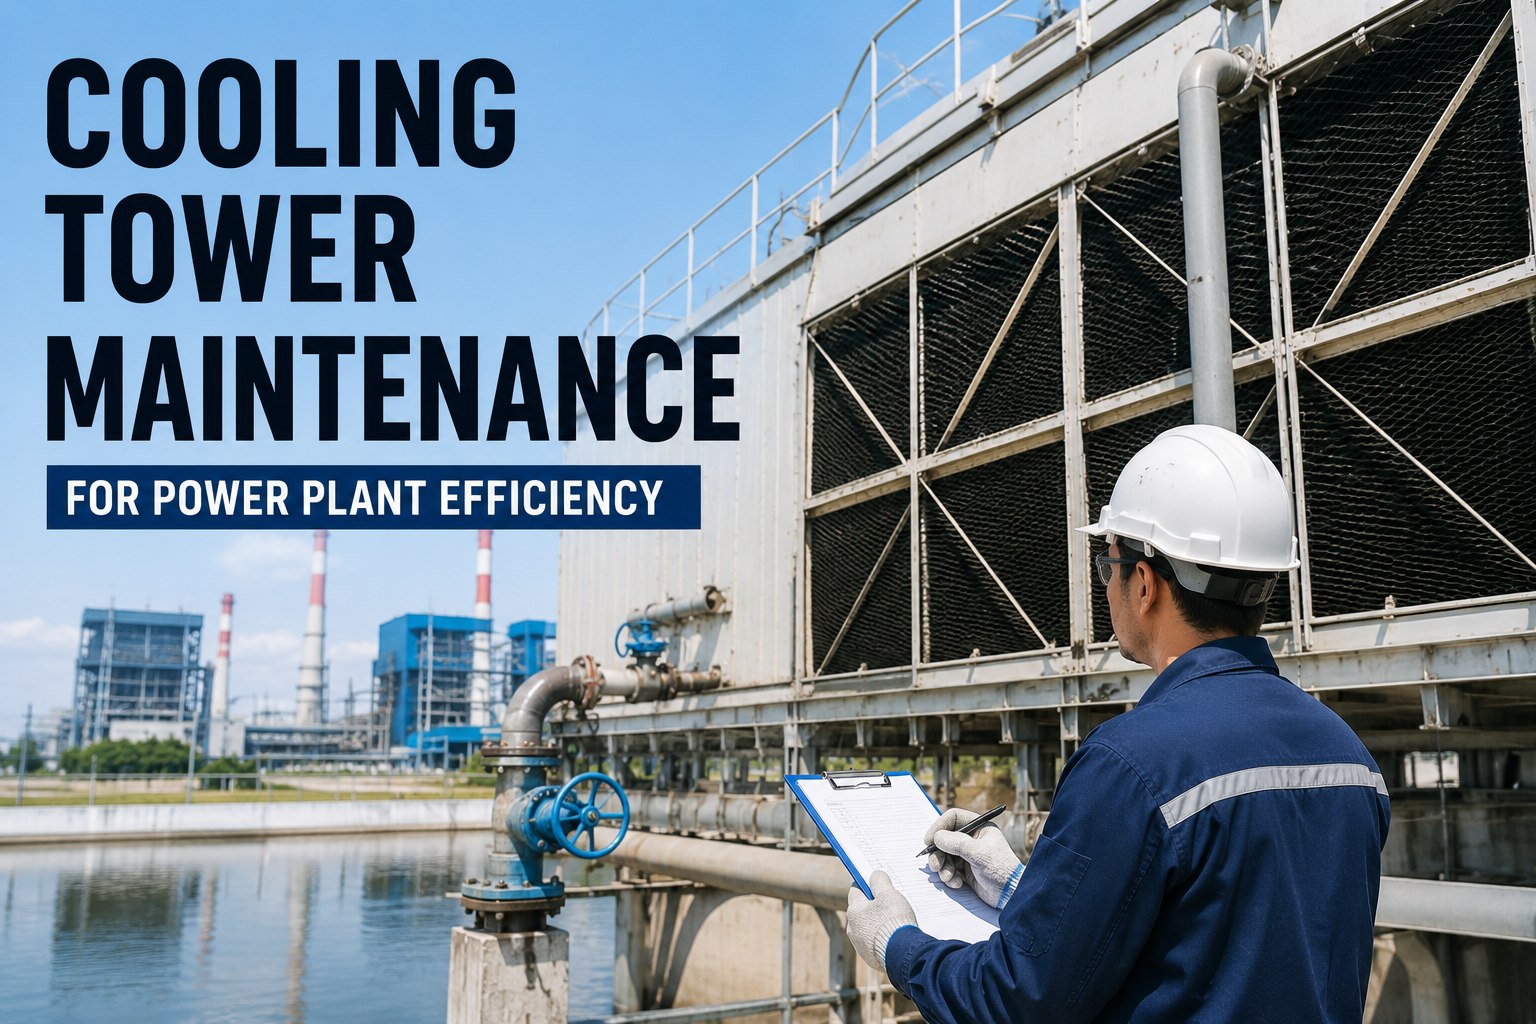
Fan, belt/gearbox & louver inspection; clear debris
Drift & low water quality
▶
Drift eliminators, bleed/blowdown & treatment tuning
The Tower Warns You for Weeks. Something Has to Be Listening.
Approach is only a leading indicator if someone is actually reading it over time. Logged by hand once a month, the trend is invisible and the warning is wasted — you find out at the energy bill. Tracked continuously, a 1°F drift raises a flag while the fix is still a nozzle clean, not a fill replacement. OxMaint turns approach from a number nobody plots into a trend that raises the work order itself, so degradation gets caught at 1°F instead of 6°F.
Log-It-Monthly vs. OxMaint Approach Tracking
Approach only pays off as a live trend. Here's the difference between recording it occasionally and letting it drive maintenance. Start free and run the tracked version.
How OxMaint Turns Approach Into Action
Making approach a working KPI takes a system that logs it, trends it, and converts a drift into the right maintenance. Here's what does the work. Sign up free to build it on your towers.
Approach Trend Monitoring
Logs cold-water and wet-bulb readings and plots approach over time, so a slow drift becomes a visible, actionable line.
Threshold Alerts
Set a rise trigger — say +1.5°F above baseline — and get flagged the moment a tower starts degrading, not months later.
Auto Work-Order Generation
A crossed threshold raises the right PM — fill cleaning, nozzle clear, fan check — routed to a technician before efficiency bleeds.
Sensor & BMS Integration
Ingests temperature data from IoT sensors or your building management system, so tracking is hands-off and continuous.
Water-Treatment & PM Scheduling
Keeps treatment, blowdown and inspection on cadence — attacking the root causes of rising approach before they start.
Multi-Tower Dashboards
Rank every tower by approach health across the plant, directing attention to the unit bleeding the most energy first.
"
We were chasing a mysterious summer energy spike for two cooling seasons — the chillers "just ran hard in the heat," or so we assumed. Once we started trending approach in OxMaint, the story was obvious: one tower's approach had crept from 7 to 12°F over eighteen months of fouling we'd never quantified. It wasn't the weather; it was scale on the fill silently costing us efficiency the whole time. We cleaned it, approach dropped back near design, and the energy draw fell with it. Now a 1.5°F rise raises a work order automatically. We stopped paying for degradation we couldn't see.
Plant Engineer · Commercial Real Estate Portfolio
Frequently Asked Questions
What is cooling tower approach temperature?
It's the difference between the cold water leaving the tower and the ambient wet-bulb temperature. Wet-bulb is the physical limit the tower cools toward, so a smaller approach means a more efficient, healthier tower.
Why is approach a better KPI than water temperature alone?
Because it self-corrects for weather. Cold-water temperature rises on a hot day even with a healthy tower, but approach — measured against wet-bulb — only rises when the tower is actually degrading, making it a true performance signal.
How much does a rising approach really cost?
On a roughly 500-ton chiller, about a 2°F rise in approach commonly corresponds to a 6–8% efficiency loss, and it compounds as approach climbs. Exact figures vary by plant, but the direction is universal — degrees of approach equal dollars at the meter.
What causes approach to rise?
Scale and fouling on the fill, poor water distribution from clogged nozzles, reduced airflow from fan or louver problems, and drift or poor water quality. Each has a specific maintenance fix that brings approach back toward design.
How does OxMaint help track approach?
It logs and trends approach continuously, alerts on a set rise threshold, and auto-generates the right work order when a tower drifts — plus keeps water treatment and inspections on schedule.
Sign up free to build it.
Catch Fouling at 1°F, Not at the Energy Bill.
Approach temperature is the earliest, cheapest warning your cooling tower gives. Use it plus OxMaint to trend every tower continuously, flag a rise before efficiency bleeds, and raise the right fix automatically — so you stop paying for degradation you can't see. Start free — no credit card, unlimited users, forever. Or book a demo.