A delivery either lands right or it doesn't — on time, complete, undamaged, to the correct address. Miss any one and it's a failed delivery, a support ticket and a dented reputation, no matter how good the other three were. The only way to fix what you can't see is to measure it: damage rate, late rate, misdelivery rate, order accuracy, and the composite scores that roll them up. OXMAINT AI is the quality and defect-tracking software that turns every delivery failure into a logged, trended, corrected record.
Logistics · Delivery Quality · KPIs & Defect Tracking · 2026
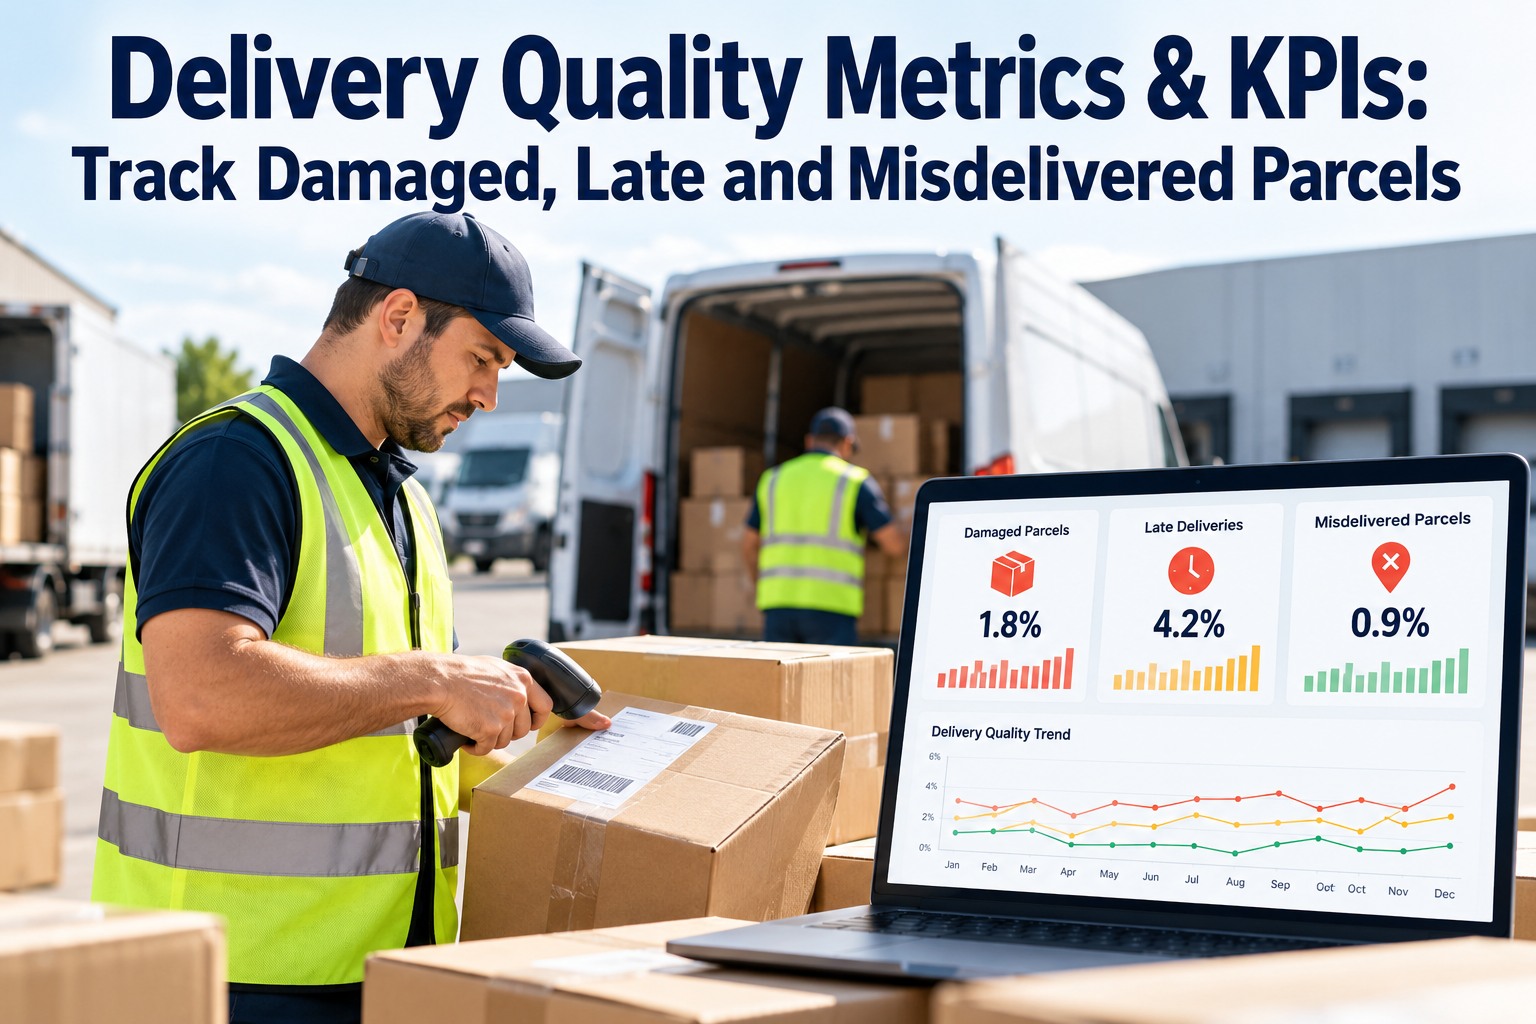
Delivery Quality Metrics & KPIs: Track Damaged, Late and Misdelivered Parcels
You can't improve a delivery operation you only feel. OXMAINT AI turns delivery failures into measured defects: damage rate, late-delivery rate, misdelivery rate and order accuracy computed from your own data, rolled into DIFOT and perfect-order scores, and every failure logged as a tracked corrective action. The dashboard shows where quality leaks — and the loop closes it.
Measure
→
Rank
→
Correct
→
Verify
DELIVERY QUALITY · THIS WEEK
Perfect Order Rate93.4%
95%+
DIFOT benchmark top supply chains target
<90%
a DIFOT below this usually signals a structural problem
4 factors
perfect order = on-time × in-full × damage-free × accurate
1 miss
any single failure makes the whole delivery a defect
The Delivery Quality KPIs That Matter
A handful of metrics carry most of the signal in a delivery operation. Four measure specific failure types; two roll them into a single score leadership can track. Each is a simple formula — the hard part is capturing the failures cleanly.
DEFECT RATE
Damage Rate
Damaged Parcels ÷ Total Delivered
The share arriving broken, crushed or spoiled. Points straight at packaging, handling and carrier care.
Lower is better
DEFECT RATE
Late Delivery Rate
Late Deliveries ÷ Total Deliveries
The share missing the promised window. The failure customers feel first and complain about most.
Lower is better
DEFECT RATE
Misdelivery Rate
Wrong-Address Deliveries ÷ Total
Parcels delivered to the wrong place or person. A costly failure that turns into a lost parcel and a reship.
Lower is better
ACCURACY
Order Accuracy
Correct Orders ÷ Total Orders
The share with the right items, quantities and documents. A picking and fulfillment quality signal.
Higher is better
COMPOSITE
DIFOT
Delivery In Full, On Time
In-Full & On-Time ÷ Scheduled
The share delivered both complete and on time — one late or short item fails the whole order.
Target: 95%+
COMPOSITE
Perfect Order Rate
The strictest score
On-Time × In-Full × Damage-Free × Accurate
DIFOT plus damage-free and correct documents — the truest measure of end-to-end delivery quality.
Higher is better
Track the four defect rates to find the leak and the two composites to see the whole picture — chasing one in isolation hides the others. Start free and put every delivery KPI on one board in OxMaint.
Perfect Order, Decomposed: Small Gaps Compound
Perfect order rate looks like one number, but it's four multiplied together — and multiplication is unforgiving. Four factors that each look excellent still land well short, because the failures stack. Breaking it apart is the fastest way to find which gap is costing you.
96%
On Time
Lost to missed windows, failed attempts and route delays.
×
98%
In Full
Lost to short-ships, splits and out-of-stock lines.
×
99%
Damage-Free
Lost to crushing, breakage and spoilage in transit.
×
99%
Accurate
Lost to wrong items, wrong address and bad paperwork.
=
91.2%
Perfect Order
Four strong factors, nearly one order in ten still imperfect.
The point isn't the arithmetic — it's that a few points on the weakest factor drag the whole score down, so you fix the worst factor first. Book a demo to see your perfect-order score split into its four factors in OxMaint.
Where Deliveries Fail: The Defect Taxonomy
You can't fix “bad deliveries” — you fix a specific failure with a specific cause. Classifying every failed delivery into a defect type is what turns a complaint into a correctable pattern. These are the five that cover most of them.
DAMAGED
Cause: packaging, handling, carrier
Arrived broken, crushed or spoiled. Trace to pack spec, load handling or a specific lane or carrier.
MISDELIVERED
Cause: address, routing, driver
Wrong address or wrong person. Often an address-quality or final-step verification problem.
LATE
Cause: route, capacity, upstream
Missed the promised window. Trace to dispatch timing, route load or an upstream fulfillment delay.
WRONG / SHORT
Cause: picking, packing, stock
Wrong item or missing items. A fulfillment-accuracy failure that fails the order before it ships.
DOC ERROR
Cause: labeling, paperwork
Wrong label, invoice or customs document. Small, but it fails a perfect order and stalls the parcel.
FAILED ATTEMPT
Cause: access, timing, contact
Couldn't complete the delivery. Drives repeat trips and late scores — often fixable with better contact data.
Tag every failure by type and cause, and the dashboard stops showing “errors” and starts showing exactly what to fix first. Start free and classify delivery defects by type in OxMaint.
A KPI You Only Read Is a Scoreboard. A KPI You Act On Is a Fix.
Measuring the damage rate doesn't stop the damage — closing the loop does. OXMAINT AI logs every failed delivery as a defect, ranks the worst offenders, drives a corrective action to a verified close, and shows the rate falling. The number becomes a result, not a report.
From Metric to Fix: Closing the Quality Loop
A metric only earns its keep when it drives an action. OXMAINT AI runs delivery quality the way a reliability team runs equipment defects — measure, find the repeat offenders, fix the root cause, and confirm it stayed fixed.
1
Capture the defect
Every failed delivery is logged by type and cause, with the order, lane and carrier attached.
→
2
Find the repeat offenders
Defect history ranks the lanes, carriers and SKUs causing the most failures and cost.
→
3
Fix the root cause
A corrective action targets the real driver — packaging, routing, picking or address data.
→
4
Verify the rate falls
The trend confirms the fix held, so the defect type is retired instead of recurring.
That loop is the difference between an operation that reports its errors and one that eliminates them. Book a demo to run the defect-to-fix loop in OxMaint.
How OxMaint Runs Delivery Quality
Your operations team runs the routes and the fixes. OXMAINT AI gives it the system underneath — the capture, the KPIs, the corrective actions and the trend that turn effort into fewer failures.
Defect Capture
Every damaged, late, misdelivered or wrong order logged by type and cause, with a photo and the order attached.
Live KPI Dashboard
Damage, late, misdelivery and accuracy rates plus DIFOT and perfect order, computed from your own data.
Trend & Benchmark
Watch each rate move week over week against your target, so improvement is visible, not anecdotal.
Corrective Actions
Each defect pattern becomes a tracked corrective action with an owner, a due date and a verified close.
Lane & Carrier Scorecards
Quality broken down by lane, carrier and SKU, so you know where the failures concentrate and who owns them.
Root-Cause History
Link each failure to its cause and fix, so repeat defects are retired instead of re-explained every month.
The routes and the fixes stay with your team; the data, the KPIs and the loop that closes live in one place. Sign up free and build delivery quality tracking in OxMaint.
Reviewed by OxMaint Quality & Operations
KPI definitions and formulas were checked against standard logistics and supply-chain quality practice, including DIFOT and perfect-order measurement. Benchmark targets vary by sector, product and service model — calibrate them to your own operation and customer promise.
Frequently Asked Questions
What are the most important delivery quality KPIs?
Four defect rates — damage, late, misdelivery and order accuracy — plus two composites, DIFOT (in full and on time) and perfect order rate, which also add damage-free and accurate documentation.
What is a good DIFOT score?
Top supply chains target 95% or higher, as close to 100% as possible. A DIFOT consistently below 90% usually points to a structural problem in fulfillment or delivery.
Book a demo to benchmark your score.
How is perfect order rate different from DIFOT?
DIFOT measures in-full and on-time. Perfect order rate is stricter — it multiplies on-time, in-full, damage-free and accurate documentation, so a single failure in any of the four fails the order.
Why track defects by type instead of one error rate?
Because each type has a different cause and fix. Damage points to packaging or handling; late points to routing; misdelivery to address data. Classifying failures is what makes them correctable.
How does tracking metrics actually reduce failures?
Measuring finds the leak; the corrective-action loop closes it. Each defect pattern becomes a tracked fix with an owner and a verified close, and the trend confirms the rate fell — so the same failure stops recurring.
Stop Reporting Delivery Failures. Start Eliminating Them.
Put every delivery quality metric on one platform with OXMAINT AI — damage, late, misdelivery and accuracy rates, DIFOT and perfect order computed from your own data, every failure logged as a defect, ranked by cost, and driven to a verified fix. Measure what matters, correct the root cause, and watch the rates fall.